Location: Home >> Detail
J Sustain Res. 2024;6(3):e240042. https://doi.org/10.20900/jsr20240042
 ,
Evgeniia V. Likhajrova
,
Evgeniia V. Likhajrova
The Institute of Transport, Industrial University of Tyumen, Tyumen 625000, Russia
* Correspondence: Artur I. Petrov.
The purpose of this article is to present new empirical data on the trends in improvement of road safety in Russian cities and to structure the nature of risks of fatalities in road traffic accidents. This study examined both the general trends in risks of fatal traffic accidents and the dynamics over time (2015–2023) of the structure of such risks. The research was conducted for four groups of Russian cities, differentiated by population size. The final conclusion of the study is the statement of a steady, progressive reduction in risks of fatalities in road traffic accidents from 2015 to 2023 that is common to all classification groups of Russian cities. A crucial aspect of the research was the study of the structural specifics of risks of fatalities in road traffic accidents for residents of Russian cities and the dynamics of these specifics over time. The analysis made it possible to establish a precise definition of the concept of Road Safety Risk and differentiate this concept into three components—the probability of an accident, the scale of an accident and the severity of the consequences of an accident. The scale and severity of an accident together is identical to “the totality of the consequences of an accident”. As part of the research, specific structural features of the risk of road accidents were established for Russian cities with different populations; patterns of statistical relationship between the probability of road accidents and the totality of their consequences were established; the risk of death in road accidents for residents of Russian cities was assessed. Based on the research results, a conclusion was made about various mechanisms for the formation of road accidents in different types of cities. The most important result of the study was the establishment of a dialectical contradiction between the probability of an accident and the totality of the consequences of an accident. In general, the research results can be the basis for constructing a multidimensional classification of cities according to the degree of Road Safety Risk and recommendations for reducing the risk of death in road accidents.
RS, Road Safety; RTA, road traffic accident; RSR, road safety risk; Risk RTA died year, annual risk of death in a road accident; P RTA year, probability of getting into an accident during the year; Cons RTA, totality of the consequences of an accident (consequences of RTA); Sc RTA, scale of an accident; Sv RTA, severity of an accident; EL, elasticity index
Ensuring Road Safety (RS) has been a key task in managing motor transport systems throughout the 130 years of global motorization. In recent years, significant advances have been made in the field of RS in some countries [1]. However, for the world-system the problem of ensuring RS continues to remain relevant [2]. That is why, with resolution 74/299, the UN General Assembly proclaimed the period 2021–2030 as the second Decade of Action for Road Safety. The global goal of the world community in this area is to reduce road traffic deaths and injuries by at least 50% within the decade [3]. The crucial fundamental approach to achieving this goal is to reduce road traffic risks. To begin with, it would be useful to understand the essence of this concept. Road safety is a phenomenon with a complex structure. When discussing the improvement of road safety over time, it is essential to justify the selection of indicators upon which the conclusions about the trends of the studied processes are based. Such indicators include the total number of traffic accidents, the number of injuries and fatalities in traffic accidents, the total material damage, and many others. In this context, it is important to note that the key fundamental approach to achieving the goal of reducing mortality and injuries resulting from traffic accidents is to mitigate the risks of road incidents. It is very useful to understand the essence of this concept.
As T. Aven [4] states: “There is no agreed definition of the concept of risk. If we study the literature we find a number of different ways of understanding the risk concept”. In general, the lack of uniform, generally accepted approaches to identifying the essence of the concept of “Risk” is not surprising, but it complicates the selection of best practices in the field of ensuring RS that would be publicly accessible, effective, and efficient.
How the research topic discussed in this article is worded may alert the reader. It is known that RS is ensured by improving the safety of road infrastructure and vehicles, improving traffic management systems, teaching safe driving practices, creating systems for effective assistance to victims of road accidents, etc. And this knowledge is indisputable. Is there really any doubt about this? Could measures taken to improve RS have the opposite effect?
The answers to these two questions are much more complex than they seem at first glance. Perhaps the reaction to the thesis about the inconsistency of risks in the field of RS will be completely different among professionals and people not related to is. The basis of these differences in judgments about the nature of road traffic accident risk lies in the sphere of professional experience, even if subjective and not always expressed in the form of formulas and recommendatory methods.
This paper presents the results of the author’s statistical research on the specifics of road accident risks in the cities (towns) of the Russian Federation. Based on state statistics on road safety for different cities of Russia, the following factors were calculated (2022):
●
●
●
Considering this information, the risks of death in road accidents were determined for residents of 141 different Russian cities (in total, the study involved data on accident rates in the 16 largest, 20 large and 39 big cities and 66 towns of Russia). The most important result of these studies is understanding the contradictory nature of the dialectical relationship between the probability of an accident P RTA and the totality of the consequences of an accident Cons RTA. This problem is considered and analyzed with regard to Human Factor. It has been established that the risk of death in an accident Risk RTA died for residents of Russian cities is distributed over a wide range of values and is formed taking into account the different probability of an average individual being involved in an accident P RTA and the totality of consequences of an average accident (scale and severity of the accident) Cons RTA.
The structure of this paper consists of three parts: fundamental-analytical (includes sections “Literature Review” and “Materials and Methods”), experimental (“Results”) and philosophical-ideological (includes sections “Discussion and Conclusions”). Statistical data used in the studies are given in the Appendix A and Appendix B.
The work of C.E. Althaus [5] presents a detailed overview of the historical background of the emergence of the concept of “Risk”. Referring to [6] C.E. Althaus concludes that the concept of “Risk” can mean:
1.
2.
3.
As T. Aven [4] points out: “It is impossible to present and discuss all definitions of the risk concept suggested and used in the scientific risk fields. Quite many definitions can be found in for example Wood [7], Crowe and Horn [8], Aven [9], Aven and Renn [10] and Aven et al. [11], but there are many more”. T. Aven [4] also provides the results of a serious analysis of historical approaches to the definition of the “risk” concept. During this analysis, T. Aven summarized the results of the analytical work of a large number of authors [12–41], differentiating the concept of human risk into nine categories.
So, there are the following different risk definition categories:
●
●
●
●
●
●
●
●
●
Among them, the concept of “Risk = Probability and scenarios (R = P&S)” has recently been the most commonly used in the community of experts in the management of motor transport systems [7]. It is usually understood that, collectively, Probability and scenarios increase risk, which means a multiplier effect. Risk scenarios are usually understood as a combination of two concepts—Consequences and severity of consequences [12]. If the risk of death as a result of any activity is identified, then it is necessary to multiply the values of Probability and Consequences and severity of consequences. It is this approach to risk identification that will be used in the research, the results of which are presented in this article.
Analysis of Researches on “Road Safety Risk”Today, the concept of risk by S. Kaplan and B.J. Garrick [12] is the most generally accepted among experts on industrial safety. It is used to quantify the combination of the probability of an event with the magnitude of the impact it could have. Since we are talking about industrial safety, it is natural that the concept of risk is mainly viewed with a negative connotation, i.e., it is assumed that the consequences of risky actions are always unfavorable [42].
Classically, risk is defined as a combination of the probability and consequences of the occurrence of any events [43]. The concept of “combination of two components”, from a calculation point of view, implies their product [44].
In relation to motor transport systems, such authors as [45–49] studied the issues of Road Safety Risk at different times. It should be noted that the works of these authors are characterized by certain uses of the terms “risk”, “risk factors”, etc. Most of them use the definition of “risk” specifically in relation to factors contributing to or influencing the increase in the road traffic accident rate.
A.I. Vecino-Ortiz et al. [45] presented a list of risk factors for death in car accidents, compiled on the basis of a Literature review of 8375 studies, and published it in the Lancet. 753 of them (9%) were subjected to in-depth analysis. As A.I. Vecino-Ortiz et al. state: “Of all papers undergoing in-depth review, 74 (10%) studies were included and a total of 159 parameters were extracted for the analyses. […] Most parameters (77%) assessed combined legislative and enforcement interventions. The great majority of the parameters assessed drink driving (63%) followed by speeding (19%). 15% parameters assessed seatbelt and child restraint use, whereas only six eligible (4%) parameters were found on helmet use”. I will emphasize that risk factors here and in other studies are understood as a set of causes that contribute to road accidents, but the likelihood and severity of consequences of an accident are not discussed in any way.
In [46] the authors present some examples of risk indicators on an aggregate level and their availability in international databases as well as the US database on fatal accidents (FARS) (Figure 1). In doing so, they refer to studies presented in [47]. Analyzing information in Figure 1 we can see that the semantic load of risk indicators [47] does not at all correspond to the definition that is consensus among risk specialists.
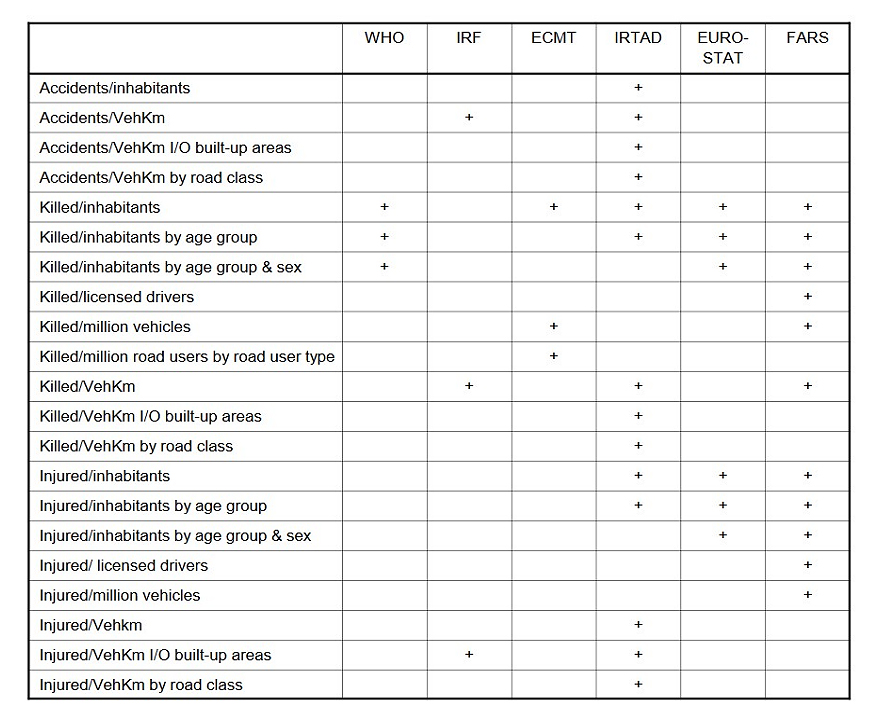 Figure 1. Available risk indicators [47].
In [48] accident risks are assessed using the “Road traffic safety entropy (RTSE)” indicator, which takes into account such characteristics of the traffic flow as “Rapid acceleration frequency, rapid deceleration frequency, rapid turning frequency, speeding frequency, and high-speed neutral coasting frequency”. Once again, we can conclude that most specialists in road traffic accidents do not consider the concept of “risk” according to the classical canons.
To the delight of the author of this article, the authors of [49] implemented a classical approach to determining accident risks. As they point out [49]: “to obtain a synthetic Risk index [R], it is universally recognized that it must be the result of a combination of at least two key factors: Danger [D] (likelihood that a crash can happen) and Vulnerability [V] (risk of injury of road users given a crash occurred). Another important factor is also the Exposure [E] (i.e., the amount of “activity” a user is exposed to a risk)”. The resulting (general) formula used for risk assessment is as follows (1):
where, D: danger or likelihood that a crash can happen; V: risk of injury of road users given a crash occurred; E: amount of “activity” a user is exposed to a risk.
It is this classical approach to assessing accident risks that will be used in this study.
Factors Affecting Road Accident RisksThe volume of research dedicated to the study of road accident risk factors is extraordinarily vast, amounting to tens of thousands of studies [50]. Perhaps the primary conclusions from these works have been encapsulated by R. Elvik et al. in the Handbook of Road Safety Measures [51]. R. Elvik et al. present [51] state-of-the-art summaries of current knowledge regarding the effects of 128 road safety measures. It covers all areas of road safety including: traffic control; vehicle inspection; driver training; publicity campaigns; police enforcement; and, general policy instruments. With many original chapters revised and several new ones added, extra topics covered in this edition include: post-accident care; DUI legislation and enforcement; environmental zones; and speed cameras.
Countermeasures against road accidents are undoubtedly based on understanding and accounting for the mechanisms through which various factors influence the risk of incidents. Ultimately, these factors can be broadly categorized within a simplified grand system “Human-Vehicle-Road-Environment”, where the interactions between these main subsystems are as crucial as the subsystems themselves. An example of such interactions might be the combination of “Human transport behavior (specific actions, their evaluation, and description) under adverse conditions (weather, road, traffic), exacerbated by stress and general fatigue”. Various studies provide selective assessments of such influences on the characteristics of road accidents (e.g., the specific number of road accidents, the severity of road accident manifestations, etc.). The forms of presenting such research results are extremely varied. Almost every study indicates that only partial results from a multitude of possibilities are presented. This is entirely understandable, as R. Elvik [52] suggests, it is possible to count up to a thousand factors influencing actual road safety, making it practically impossible to create an accounting system that integrates hundreds of statistical models into a cohesive whole.
Analysis of Works on Road Safety Risk ParadoxesIn case all road users are fully guided by the requirements of the Road Traffic Rules in choosing their actions, Road Safety Risk (RSR) is reduced to a theoretical minimum. It is this idea that underlies the ideological concept of zero mortality—Vision Zero [53]. The problem is that human behavior is characterized by the effects of the so-called risk homeostasis [54]. The phenomenon of humans is that they are constantly looking for optimal behavior options for themselves in any situation. This optimality is determined by comparing the hypothetical benefits of risky behavior with the possible damage. Finding this balance is extremely difficult and the choice of the level of acceptable risk is often determined by established habit. The habit of taking risks or, conversely, being cautious depends on many factors [55], the most important of which are the physiological features of the human body [56] and the general cultural background of society [57]. Thus, the maximum values of Road Traffic Accident Severity Sv RTA in Russia are typical for the Chechen Republic (Sv RTA ≈ 20–25 died /100 victims), the median age of the population of which is only 25.5 years (for reference, in most regions of Russia this figure exceeds 40 years). G.J.S. Wilde, the author of the concept of risk homeostasis [58], has been developing his theory for more than 30 years now, and all these years his ideas have asserted themselves more and more convincingly.
Note that from the point of view of dialectics, there are two ideologically opposing approaches to ensuring road safety in the world today. The first is based on the need to minimize potential conflict by separating traffic in space (multi-level road junctions) and time (traffic lights and other means of traffic control). The consequence of such traffic separation policy is an unfounded belief of the traffic participant that there are no obstacles to traffic and, as a result, unpreparedness for sudden traffic situations that require increased focus and quick reaction. The second approach, the concept of shared space [59], is based on the need to create conditions to sharpen the attention of road users and ensure instant readiness to respond to external road safety threats. The first approach is mainly used by countries that are characterized by authoritarian domestic policy options. Russia is one of them. The second approach is typical for countries that are conventionally classified as people’s democracies (the Benelux countries, Australia, New Zealand and many others). The paradox is that where everything has been done to eliminate traffic conflicts, the relative indicators of road accidents (such as Human Risk) are higher than where this conflict is created on purpose. So, in Russia HR 2022 = 9.9 died/100 thousand people [60]; in the Netherlands HR 2022 = 3.6 died/100 thousand people [1].
Adaption the Transport Systems of Russian Cities to the Ideas of Sustainable Transport ConceptRussia, as part of the civilized world, is characterized by all modern development trends. One of these trends is the need to enhance systemic sustainability. In the realm of urban transport systems, this primarily involves the need to change transport mobility implementations, shifting the focus from the use of private cars to increasing the importance of public transport [61] and a clear understanding of the significance of developing MaaS technologies [62]. Currently, the level of development of sustainable transport mobility forms in Russia lags somewhat behind most European countries but surpasses the results of hundreds of developing countries [63]. It should be noted that in Russia, the issues of sustainable development of transport systems are supported by the government. One of the largest automotive research institutes in Europe, the Scientific Research Institute of Automobile Transport (JSC NIIAT), hosts a research department dedicated to “Sustainable Development of Transport Systems”. The results of the department’s work are presented in dozens of scientific studies [64]. A comprehensive analytical study, focusing on the analysis of trends in the development and degradation of public transport in some Russian cities, was presented by A.Y. Ryzkov and P.V. Zyuzin from the National Research University Higher School of Economics (HSE) [65]. The key conclusion of their work is formulated as follows: “Public transport is still not competitive in comparison with the private cars. Public transport often doesn’t have physical priority (priority lanes and separated tracks) on key routes, and its consumer qualities are absolutely not comparable to those of private cars”.
It is premature to speak of significant achievements in the development of MaaS (Mobility as a Service) technologies in Russia. For instance, in study [66], it was concluded that there exists serious resistance of the public environment to the expected MaaS-reorganization of the structure and technologies of urban mobility provision in Russia. Simultaneously, there is also evidence of a slow but steady adaptive expansion in the methods of urban mobility implementation in Russian cities. MaaS technologies are gradually gaining market share in the mobility sectors of these cities.
The conclusions regarding studies on the impact of user behaviour in sustainable urban mobility forms (such as cycling and personal mobility devices) on road traffic accidents are intriguing. Research [67] presents the results of the verification of objectivity of hypothesis: “It is expected that both risky cycling behaviors (i.e., driving errors and traffic violations) and protective cycling behaviors exert a significant effect on the self-reported riding crash rates of Russian cyclists”. This conclusion can also be applied to the assessment of the connection between road traffic accidents and the behavior of car drivers.
Thus, the Concept of Sustainable Transport is gradually gaining more adherents in Russian cities, which has a beneficial effect on reducing road traffic accident rate.
So, the risk of road traffic accidents must be considered, first of all, in relation to the risk of death in an accident Risk RTA died. This indicator is quantified as the product of the probability (in relation to an individual) of getting into an accident and the totality of the consequences of this accident (taking into account the scale and severity of the accident). Typically, for comparative purposes, the concept of annual risk of death in a road accident Risk RTA died year is used formula (2):
where P RTA year: probability (in relation to an individual) of getting into an accident during the year; Cons RTA: totality of the consequences of an accident.
The probability of getting into an accident during the year P RTA year for an individual city resident is determined as formula (3):
where N RTA year: annual number of road accidents; P: city population, people.
The totality of the consequences of an accident (Consequences of RTA) Cons RTA is calculated as formula (4):
where Sc RTA: scale of the accident, number of victims / 1 accident; Sv RTA: severity of the accident, share (from 1) of the number of deaths among victims.
The scale Sc RTA and severity Sv RTA of an accident are determined, respectively, as formulas (5) and (6):
where N Victim: number of victims (sum of dead and injured) in road accidents, people; N RTA: number of accidents.
where N died: number of deaths in road accidents, people.
The risk of death in an accident Risk RTA died is a very specific indicator of existing risks in the field of Road Safety, which is not difficult to calculate if the necessary statistical data is available.
It is perhaps more convenient to consider the essence of this concept using a hypothetical example (Table 1). Using formulas (2–6) and the initial data of Table 1, we get Risk RTA died year = PRTA year × ConsRTA = 0.001 × 0.075 = 0.000075 or 0.0075%.
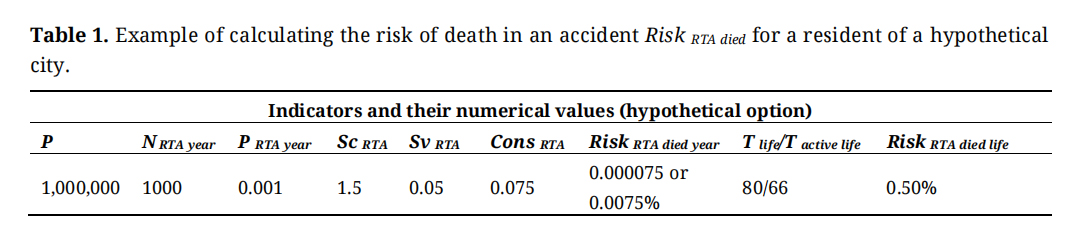 Table 1. Example of calculating the risk of death in an accident Risk RTA died for a resident of a hypothetical city.
If we assume that the average life expectancy of a city dweller Tlife = 80 years, of which 66 years are socially active, then the annual risk of an accident can be scaled to the level of the risk of an acciden Risk RTA life in the course of a lifetime: Risk RTA died life = Risk RTA died year × Tlife = 0.0075% × 66 = 0.50%. According to it, every two hundredth (or 1/200) city dweller can die due to the consequences of a road accident during a lifetime. This calculation may be hypothetical, but it is a very convincing example of a fairly high level of risk of death in a road accident for the average city dweller [50].
We will assess the risk of death in an accident Risk RTA died year for the average resident of a Russian city in the dimension 1−n or in % for the average year.
The Purpose and Objectives of the ResearchWithin the framework of this paper, using the example of official statistics of road traffic accidents provided by the Main Directorate for Traffic Safety of the Russian Federation [60], the following objectives are met:
●
●
●
●
●
●
The research was using data characterizing the road safety systems of Russian cities differentiated into 5 groups based on the criterion “Population”:
●
●
●
●
●
Meeting the objectives of this study is subordinated to the main goal—to illustrate the dialectical inconsistency of the nature of Road Safety by proving the argument that it is impossible to reduce the risk of death in an accident by simultaneously influencing both the probability and the totality of the consequences of an accident. This is explained by paradoxes in the behavior of road users, the reasons for which D. Kahneman and A. Tversky [68] define as “inadequacy of risk perception under conditions of uncertainty”. According to D. Kahneman and A. Tversky human factor is the most important aspect of ensuring road safety in cities. Human behavior within the framework of the “Human-Car-Road-Environment” system can often be irrational and illogical [68], significantly affecting Road Safety.
The essence of a dialectical contradiction always lies in the presence of logical feedback between the components of a dialectical pair—as one characteristic increases, the other characteristic must decrease. The opposite is also true.
Methodology for Assessing the Sustainability of Road Safety Improvement Processes in Russian CitiesThe sustainability of road safety improvement processes is identified through the elasticity index EL RS. The purpose of the elasticity index ELi is to measure the percentage change in one variable in response to a change in another (7):
where ELi: elasticity index in i-year; Y: dependent variable; X: independent variable; 8: number of years of the period (2015–2022).
Elasticity EL RS—a measure of the sensitivity of one variable (Y) to changes in another (X).
In our case, these variables are: X—the annual number of traffic accidents; Y—the annual number of fatalities in traffic accidents.
Accordingly, the general formula (7) is transformed into (8):
where EL RS i: elasticity index for road safety in i-year; N died i: number of deaths in road accidents in i-year, people; ∑N died 2015–2022, the amount of deaths in road accidents during 2015–2015, people; N RTA i: number of road accidents in i-year, unit; ∑N RTA 2015–2022: the amount of number of road accidents during 2015–2015, unit.
The results of the EL RS elasticity index calculation can take the value EL RS = 1, indicating that between 2015 and 2023, the number of fatalities in road traffic accidents changed proportionally to the change in the number of road traffic accidents. If EL RS > 1, the rate of change in the number of fatalities in road traffic accidents is lower than the rate of change in the number of road traffic accidents. If EL RS < 1, the rate of change in the number of fatalities in road traffic accidents exceeds the rate of change in the number of road traffic accidents themselves.
Methodology for Establishing a Dialectical Contradiction between the Probability of an Accident P RTA year and the Totality of the Consequences of an Road Accident Cons RTA yearThe essence of a dialectical contradiction always lies in the presence of logical feedback between the components of a dialectical pair—as one characteristic increases, the other characteristic must decrease. The opposite is also true.
This is how the dialectical unity of the aspects of the phenomenon is manifested and the contradiction between them is revealed. In order to explicitly determine the presence and form of manifestation of this dialectical contradiction in relation to the specifics of road traffic accidents, it is necessary to experimentally establish the pattern Cons RTA year = f (P RTA year). The shape of the curve approximating the dependence will identify the presence of this dialectical contradiction. Presumably this will look like the model in Figure 2.
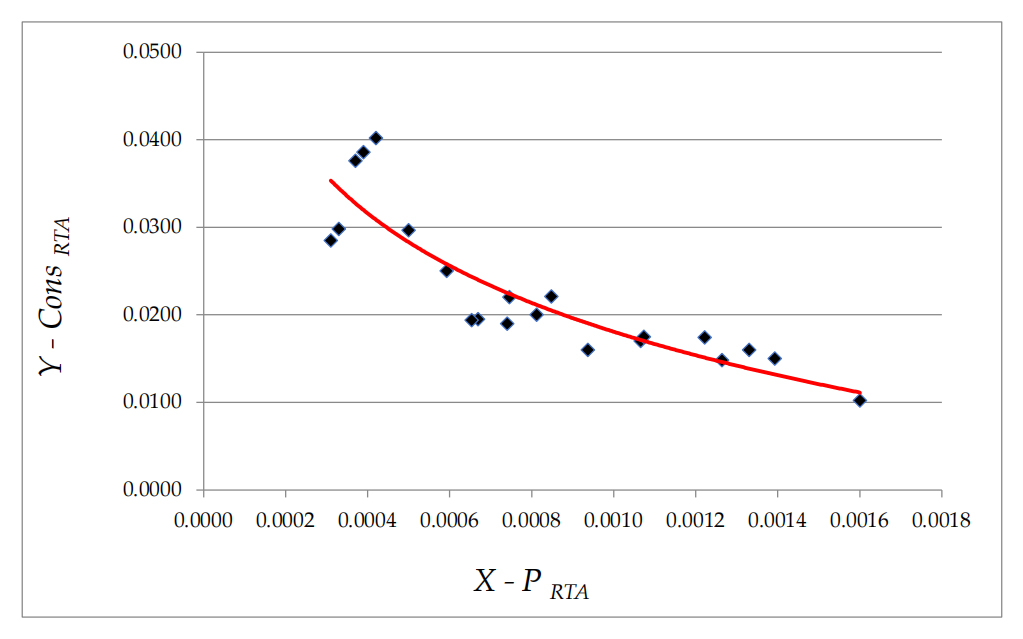 Figure 2. Hypothetical forecast of the visual appearance of Cons RTA year = f (P RTA year).
According to the research hypothesis, it is expected that at low values of the probability of an accident P RTA year, the values of the totality of consequences of an accident Cons RTA year will be quite high. And, conversely, with high values of P RTA year the values of Cons RTA year will be relatively low. Presumably, the relationship between Cons RTA year and P RTA year will be described either by a linear (a simplified version of the description of the desired pattern) or, preferably, by a logarithmic model.
This hypothesis was formulated taking into account the analysis of the results of previously performed studies. In particular, [60] shows that high vehicle speeds are typical for free traffic modes. If traffic is congested, vehicle speeds decrease sharply; the likelihood of minor accidents increases and the severity of their consequences will be low. It is known that the severity of the consequences of an accident depends on the kinetic energies of impacts during a car collision and is directly proportional to the speed of these collisions.
This statement can be illustrated by Figure 3. For this case (Figure 3), the probability of an accident increases significantly during the morning transport jam (7:20–8:40), but the severity of the consequences of such accidents is relatively low.
Z. Zheng [69] used the term “traffic chaos”: “traffic chaos is closely related to speed, speed variance and flow. To evaluate impact of traffic chaos on traffic safety, speed variance alone is not sufficient. Therefore, new variable, the Сhaos index”.
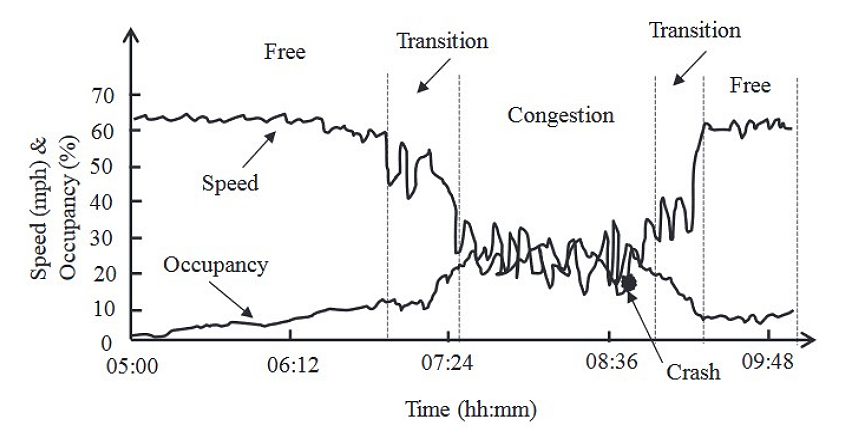 Figure 3. The speed and occupancy time series [69].
The Chaos index is defined according to formula (7).
As a result, Z. Zheng [69] says: “there is strong evidence that the chaos index has the adverse impact on crash occurrence likelihood (COL)”. This idea should be understood as an increase in the likelihood of an accident with increased traffic connectivity and increased chaos on the road. The inverse of this relationship is: in a free (disconnected) mode of traffic flow, the probability of an accident decreases and the severity of these rare accidents increases.
This hypothesis will be tested by determining Cons RTA year = f (P RTA year) for five sets of data on accident rates (for four groups of cities [70] and the fifth group of generalized data for all cities in total). The relevant data were obtained from the website of the Main Directorate for Traffic Safety of the Russian Federation [60] and are presented in the Appendices.
Limited in data volume, of the data required for constructing the relevant time series is provided in Appendix A. This example is presented only for one group of cities—large cities (Population = 501–1000 thousand people). Similar calculations have been performed for cities of other groups. The overall volume of used data is very substantial and, therefore, not fully presented.
Figure 4 presents the time series for the indicator Risk RTA died 2015–2023 for Russian cities selected as representative of the classification groups based on population size.
For all the presented dependencies, a positive trend in the reduction of urban residents’ fatality risks in road traffic accidents Risk RTA died over time is evident. Notably, the values of Risk RTA died are significantly lower in the largest and large cities of Russia compared to medium and small cities, both in 2015 and 2023. At the same time, the rate of reduction in Risk RTA died over time is higher for medium and small cities. This aligns well with the theory of the complexity of goal achieving—the lower the initial level of road safety, the easier it is to implement planned actions and achieve the goal of reducing road accident rates.
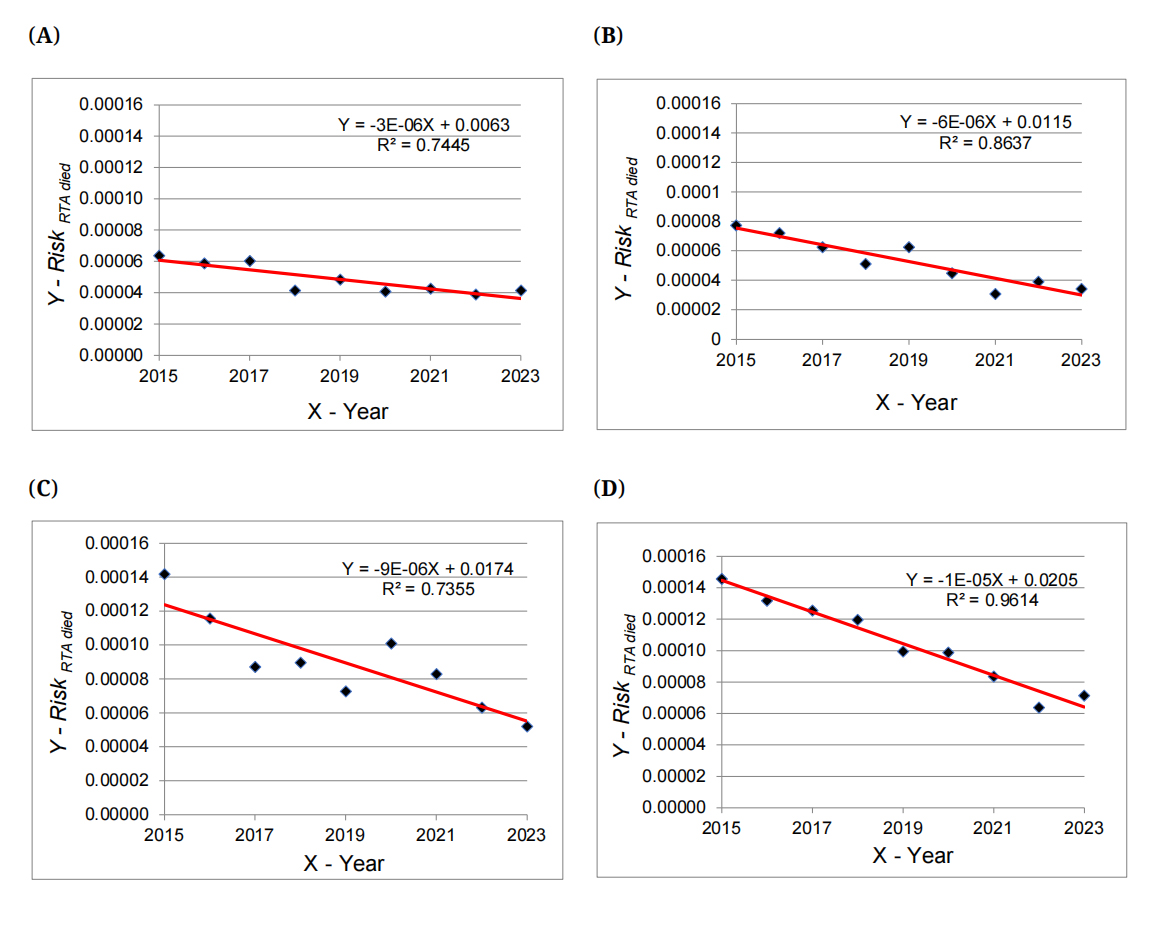 Figure 4. Time series for the Indicator Risk RTA died 2015–2023 in Russian cities with different population sizes. (A) Ekaterinburg (Population 2023 = 1539.4 thousand people) (B) Irkutsk (Population 2023 = 611.2 thousand people) (C) Vladimir (Population 2023 = 346.8 thousand people) (D) Maykop (Population 2023 = 139.7 thousand people).
A simple visual analysis of the time series depicted in Figure 5 allows us to infer general trends but does not identify the level of stability in the process of road safety improvement in Russian cities.
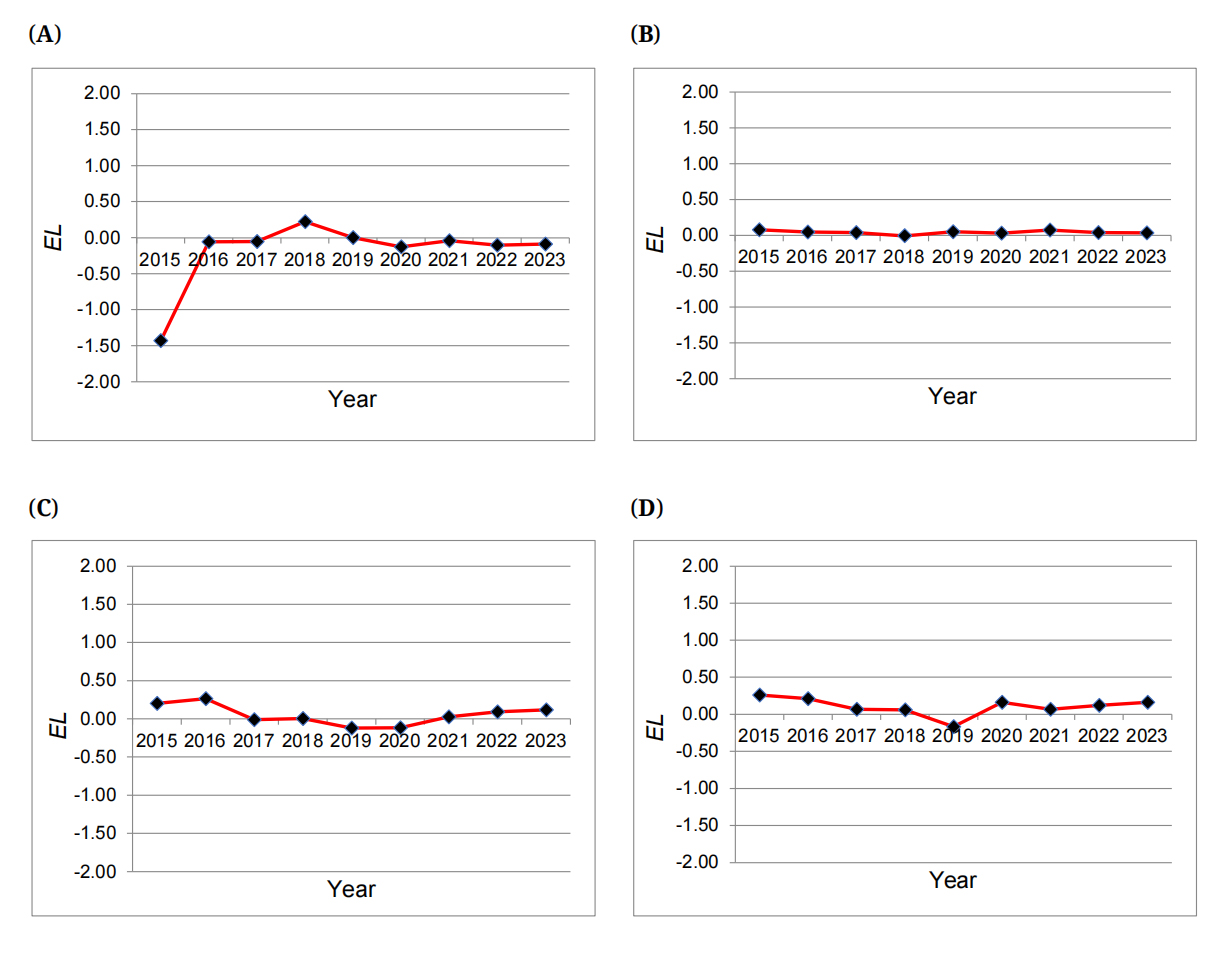 Figure 5. Time series of EL indicators change in Russian cities with different population sizes. (A) Ekaterinburg (Population 2023 = 1539.4 thousand people) (B) Irkutsk (Population 2023 = 611.2 thousand people) (C) Vladimir (Population 2023 = 346.8 thousand people) (D) Maykop (Population 2023 = 139.7 thousand people).
Figure 6 shows histograms of the distribution of accident probability values P RTA 2022 year for Russian cities of four classification groups. The corresponding values of the probability of an accident P RTA 2022 year are calculated according to formula (2) based on the data in the Appendices.
Figure 7 presents histograms of the distribution of values of the totality of the consequences of road accidents Cons RTA 2022 year for Russian cities of four classification groups.
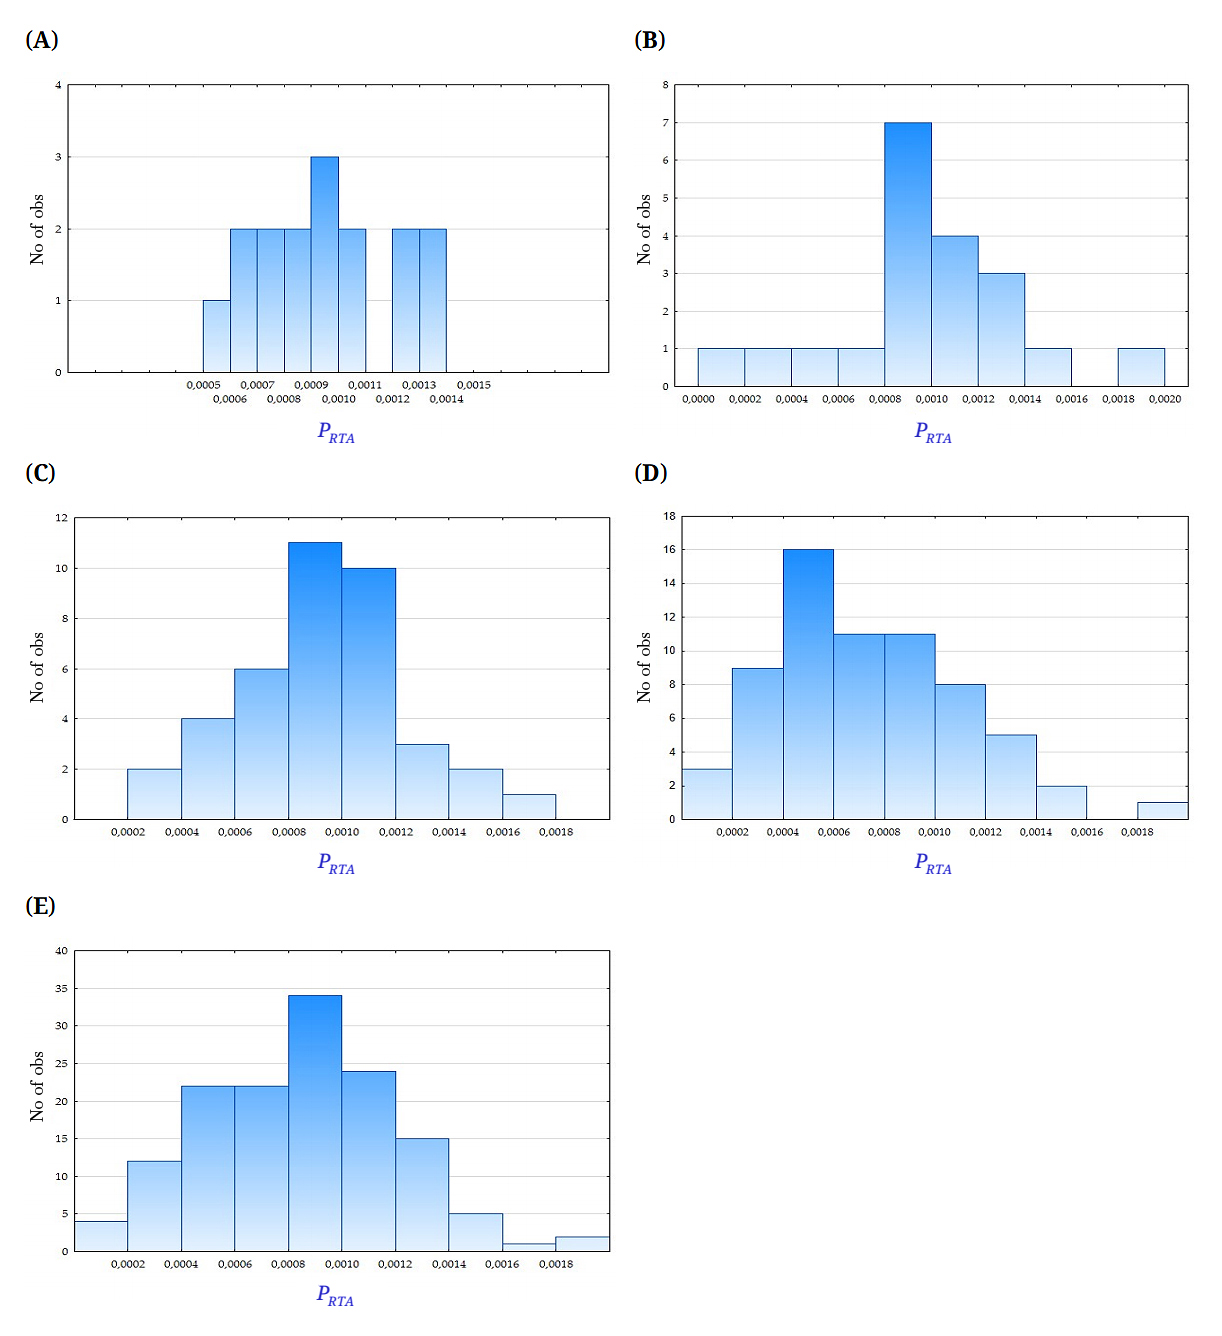 Figure 6. Histograms of the distribution of values of the P RTA 2022 year. (A) Russian cities with population = 1001–13,000 thousand people (B) Russian cities with population = 501–1000 thousand people (C) Russian cities with population = 251–500 thousand people (D) Russian cities with population = 100–250 thousand people (E) All Russian cities with population = 100–13,000 thousand people.
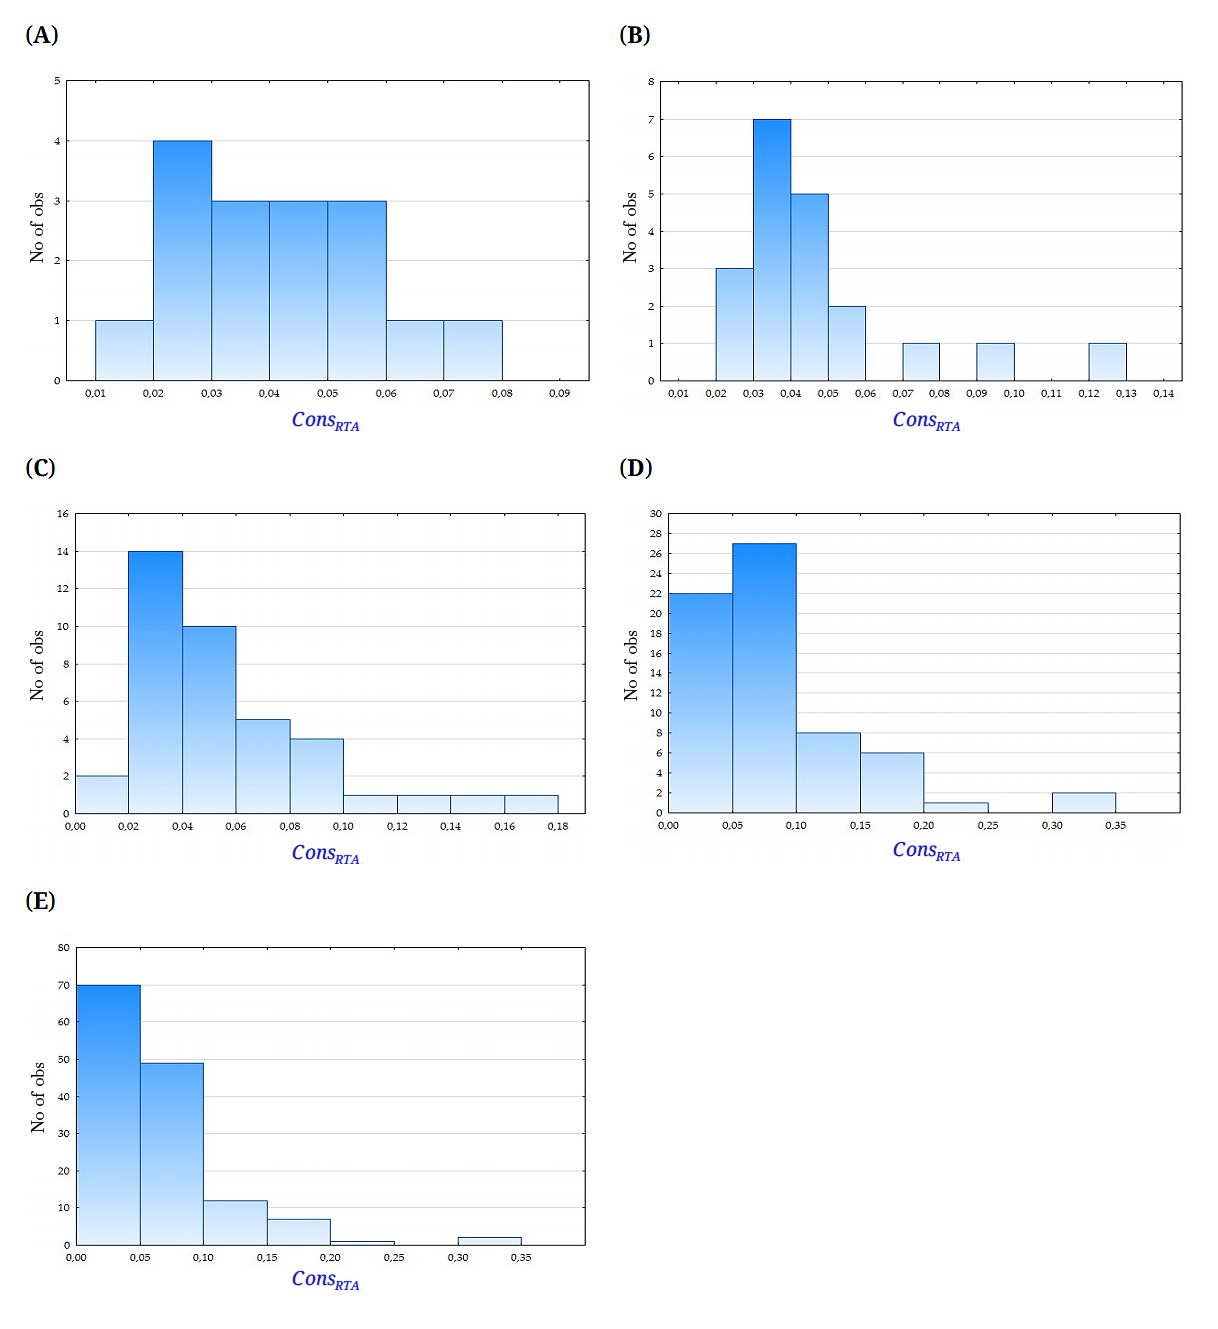 Figure 7. Histograms of the distribution of values of the Cons RTA 2022 year. (A) Russian cities with population = 1001–13,000 thousand people (B) Russian cities with population = 501–1000 thousand people (C) Russian cities with population = 251–500 thousand people (D) Russian cities with population = 100–250 thousand people (E) All Russian cities with population = 100–13,000 thousand people.
Table 2 presents characteristics of the distribution of P RTA 2022 year.
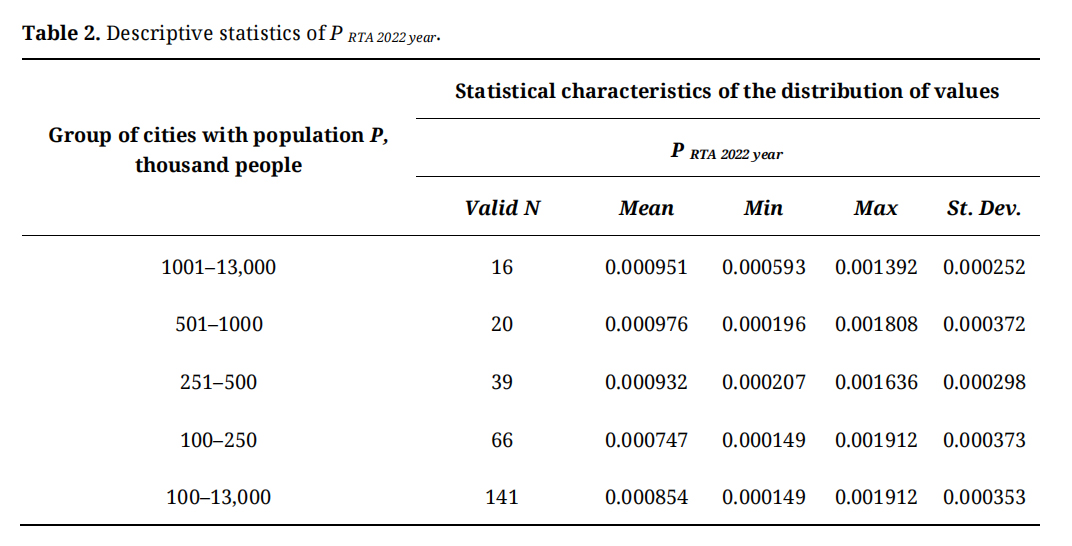 Table 2. Descriptive statistics of P RTA 2022 year.
Table 3 presents characteristics of the distribution of Cons RTA 2022 year.
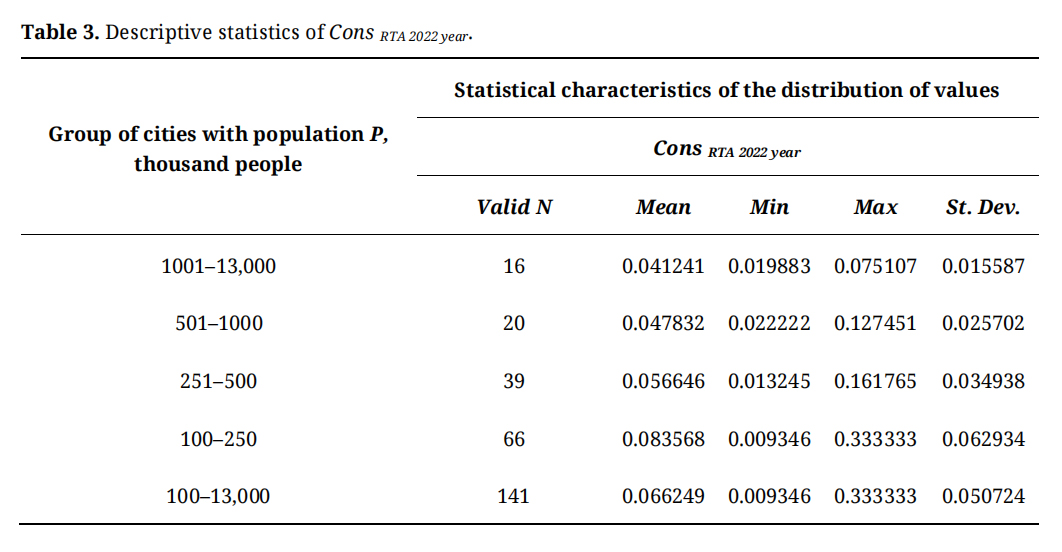 Table 3. Descriptive statistics of Cons RTA 2022 year.
The risk of death in an accident Risk RTA died is quantified as the product of the probability P RTA (in relation to an individual person) of getting into an accident and the totality of its consequences Cons RTA (taking into account its scale and severity). Let us take it as an axiom that the specificity of the structural features of Risk RTA is determined primarily by the probability of an accident P RTA; the totality of the consequences Cons RTA is already a result of the very fact of an accident and, accordingly, is secondary in relation to the probability of an accident.
Hypothetically, there are three fundamental options for classifying cities taking into account the probability of an accident P RTA:
●
●
●
These three options of the probability of an accident P RTA correspond to the following ranges of values:
●
●
●
Analysis of the data in Appendix B allows us to classify the largest cities as follows (Table 3).
Classifications similar to Table 4 taking into account the probability of an accident P RTA can be proposed for cities from other groups.
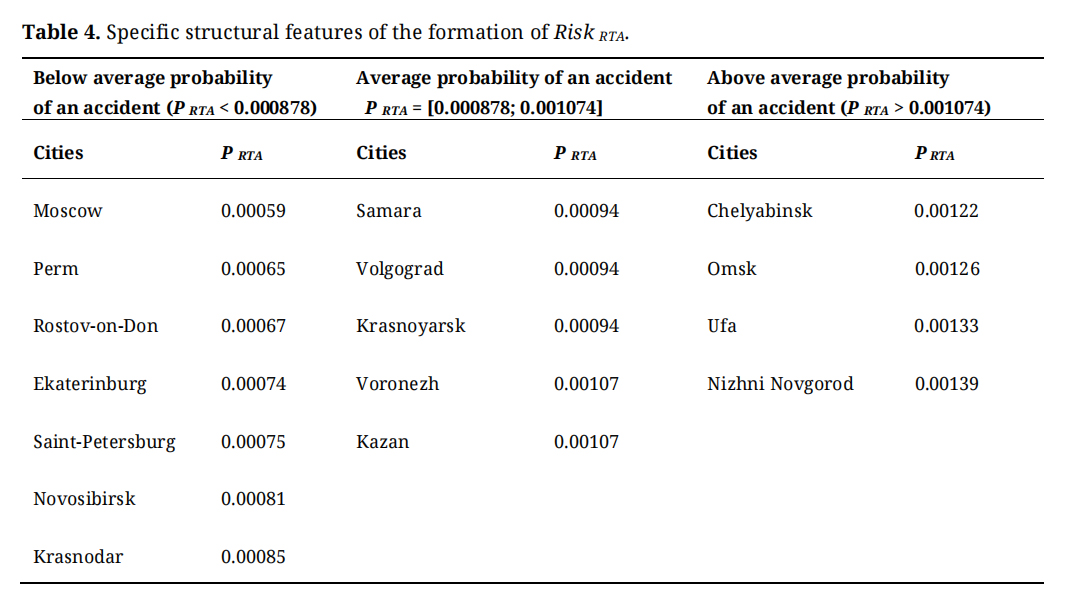 Table 4. Specific structural features of the formation of Risk RTA.
Figure 8 shows the relation Cons RTA 2022 year = f (P RTA 2022 year) for Russian cities with different populations.
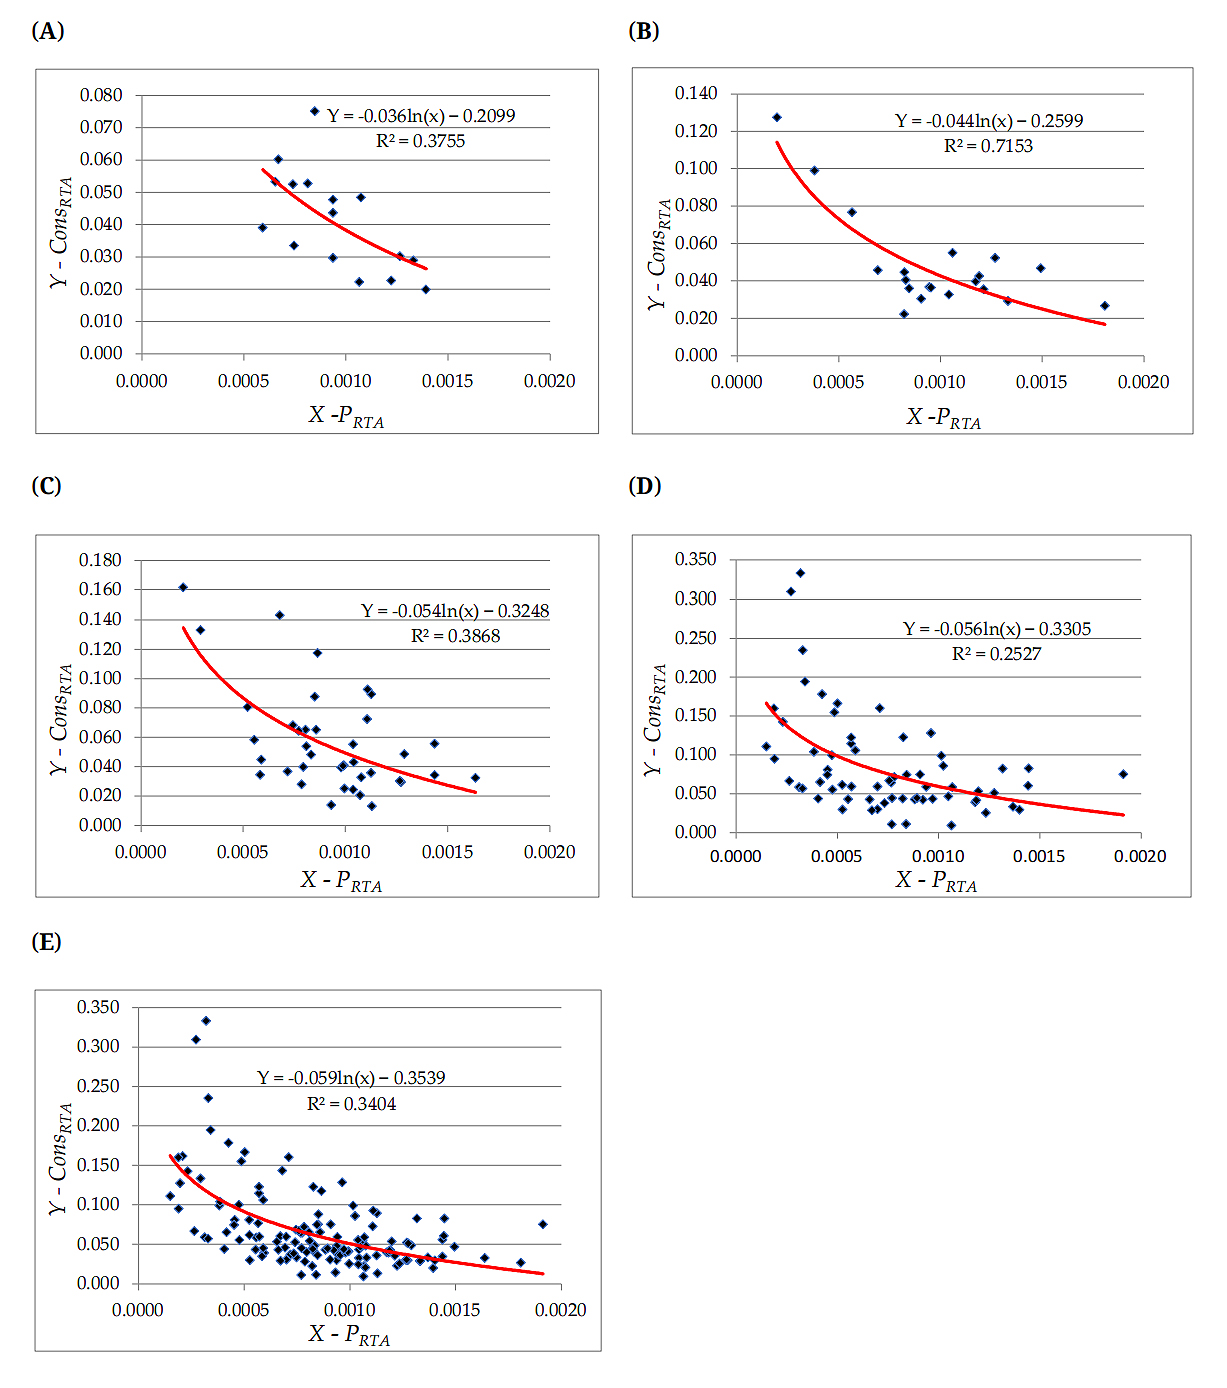 Figure 8. Curves of the relation Cons RTA 2022 year = f (P RTA 2022 year) for Russian cities with different populations. (A) Russian cities with population = 1001–13,000 thousand people (B) Russian cities with population = 501–1000 thousand people (C) Russian cities with population = 251–500 thousand people (D) Russian cities with population = 100–250 thousand people (E) All Russian cities with population = 100–13,000 thousand people.
Testing the hypothesis about the dialectical opposition between the probability of an accident P RTA 2022 year and the totality of the consequences of an accident Cons RTA 2022 year showed that as P RTA 2022 year increases, Cons RTA 2022 year decreases, and vice versa. Figure 8E demonstrates the relation Cons RTA 2022 year = f (P RTA 2022 year) for a generalized data set (all Russian cities with a population from 100 to 13,000 thousand people).
It is perhaps worth noting that while the Cons RTA 2022 year = f (P RTA 2022 year) models for different groups of cities are of the same type, the parameters of these models differ significantly. This is easy to notice by the range of the actual values of Cons RTA 2022 year and P RTA 2022 year, typical for groups of cities with different population sizes.
Thus, the totality of the consequences of an accident Cons RTA 2022 year in cities with Population = 100–250 thousand people can reach 0.300–0.350 of the theoretical average statistical life, despite the fact that the probability of an accident P RTA year is quite low (P RTA year < 0.00035). For cities with Population > 1001 thousand people, the probability of an accident P RTA year is much higher (0.00050 < PRTA year < 0.00150), and the totality of the consequences of an accident Cons RTA 2022 year is much lower (0.020 < Cons RTA 2022 year < 0.080), than in the case of small cities. Obviously, this indicates different mechanisms for the formation of road accidents in different types of cities. This situation is a result not only of different approaches to managing traffic and ensuring its safety, but also of very different behavioral habits of residents of different types of cities. This point will be discussed in more detail in Section 5 (Discussion).
Assessment of the Risk of Death in an Accident Risk RTA 2022 year for Residents of Russian CitiesFigure 9 shows histograms of the distribution of values of the risk of death in an accident Risk RTA 2022 died for Russian cities of four groups.
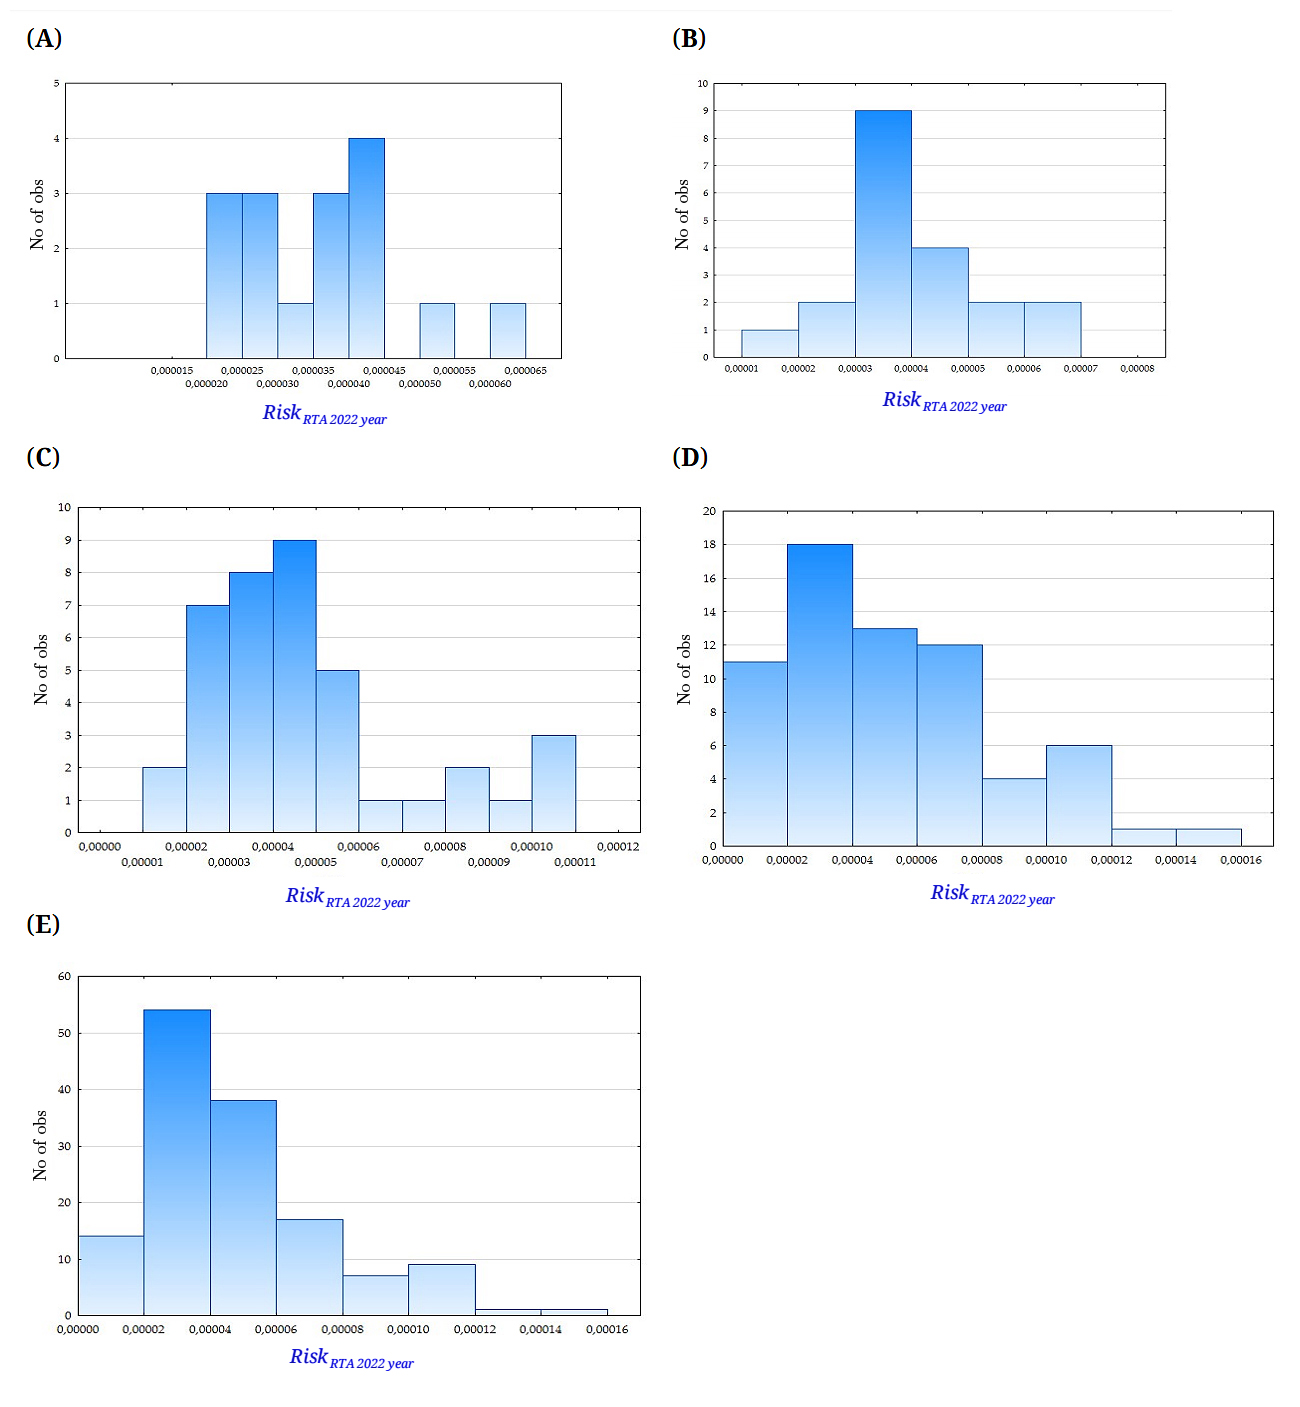 Figure 9. Histograms of the distribution of values of the risk of death in an accident Risk RTA 2022 year in Russian cities with different populations. (A) Russian cities with population = 1001–13,000 thousand people (B) Russian cities with population = 501–1000 thousand people (C) Russian cities with population = 251–500 thousand people (D) Russian cities with population = 100–250 thousand people (E) All Russian cities with population = 100–13,000 thousand people.
Table 5 presents statistical characteristics of the distribution of Risk RTA 2022 year.
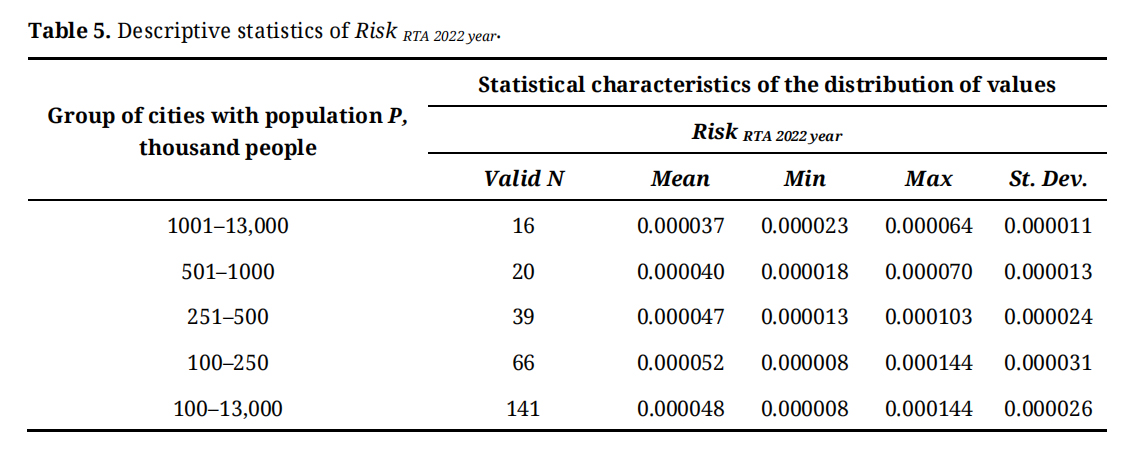 Table 5. Descriptive statistics of Risk RTA 2022 year.
The risk of fatalities in road traffic accidents Risk RTA died in Russian cities has been decreasing during the period from 2015 to 2023. The primary observation from analyzing assessment of the models Risk RTA died 2015–2023 = f (Time) is the various rates of reduction of fatalities risk due to road traffic accidents across cities of different population sizes. In cities with a population of more than 1 million people these rates are the lowest. Conversely, the smaller the city's population, the higher the rate of reduction in fatality risks over time. Initial (2015) level of Risk RTA died was the lowest in Yekaterinburg, whereas smaller cities started with a higher initial risk level. Naturally, this low initial base is the main reason for the slower reduction rates of Risk RTA died in the largest cities (e.g., Yekaterinburg) and large cities (e.g., Irkutsk). Conversely, a higher initial base explains the faster reduction rates in medium-sized (e.g., Vladimir) and small cities (e.g., Maykop).
Therefore, the coefficient b in the linear model Risk RTA died 2015–2023 = f (Time), characterizing the rate of change in the risk of fatalities for an average city resident within the observed trend, is as follows:
●
●
●
●
An analysis of the time series data for the elasticity index EL RS in representative Russian cities has shown that in all four cities (Yekaterinburg, Irkutsk, Vladimir, Maykop), the rate of change in the number of fatalities in road traffic accidents from 2015 to 2023 exceeds the rate of change in the number of road traffic accidents themselves. This situation is characterized by EL RS < 1. Notably, the range of the elasticity index EL RS 2015–2023 across all four cities is relatively narrow:
●
●
●
●
Evidently, the process of reduction of risks of fatalities in road traffic accidents in Russian cities can be considered relatively stable, as the overall amplitude of EL RS values is comparatively small. However, this process is characterized by a relative skew towards an increase in passive safety measures (evaluated by the number of fatalities in road traffic accidents) and a relative shortcoming in active safety measures (evaluated by the actual number of road traffic accidents).
Fundamental Dialectical Contradiction between the Probability of an Accident P RTA and the Consequences of an Accident Cons RTAThe patterns presented in Section Statistical Relationship between P RTA 2022 year and Cons RTA 2022 year for Russian Cities) clearly demonstrate that there exists a dialectical contradiction between the probability and consequences of an accident. Table 6 presents the starting premises for explaining this phenomenon.
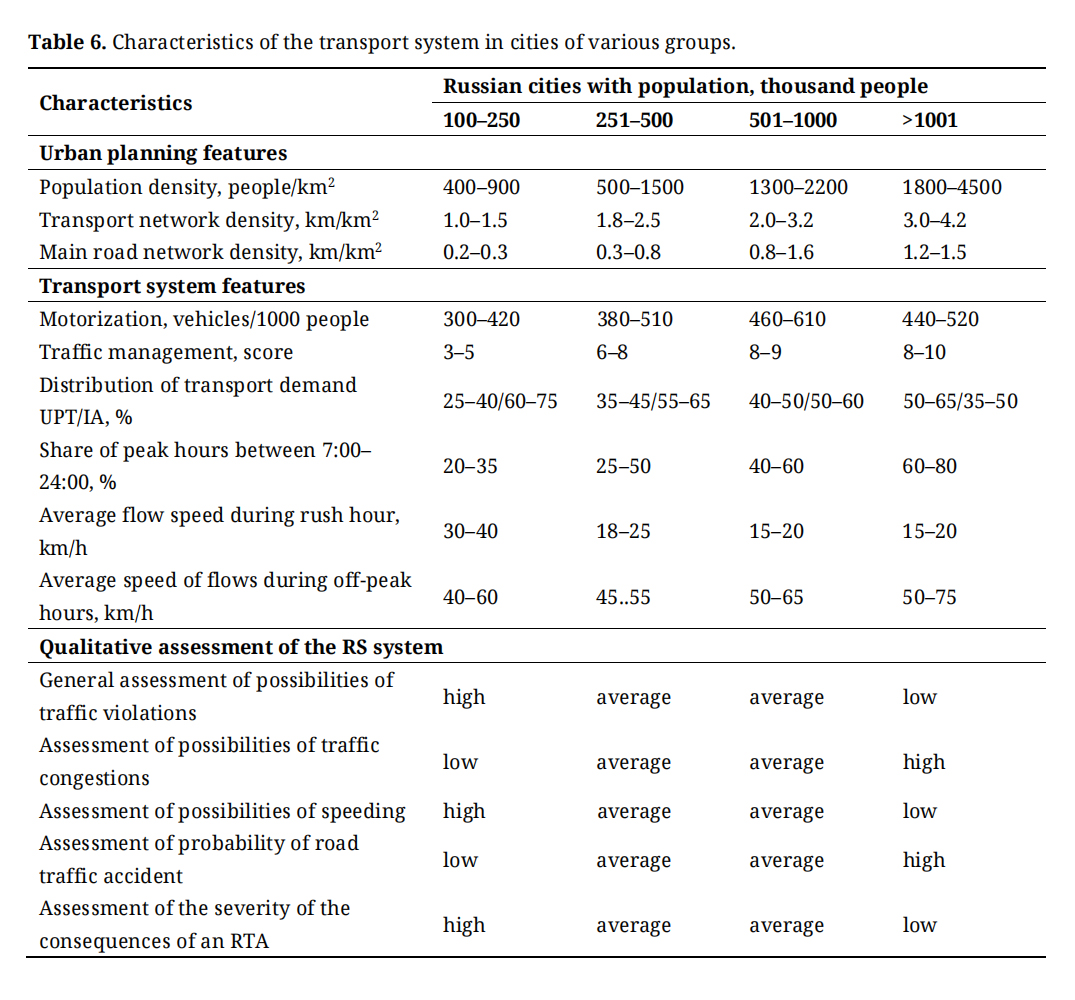 Table 6. Characteristics of the transport system in cities of various groups.
Considering the data in Table 6, it becomes clear that the specifics of accident rates in cities of different types are very different. It is in towns that the frequency, and as a result, the likelihood of violations of traffic rules (traffic regulations) is significantly higher. At the same time, taking into account low traffic density, there are much more opportunities for speeding (speed limit in Russia is 60 km/h). If we take into account that in towns photo and video traffic surveillance equipment is not as readily available, it becomes clear that with low traffic density the probability of an accident is lower, but if an accident does occur, then the severity of its consequences is much higher than in megalopolises and large cities.
Dialectical Contradiction between the Risk of Death in an Accident Risk RTA in Various Cities and the Quality of the Urban EnvironmentLet us look at the results of the statistical analysis of Risk RTA.
The first thing we pay attention to when analyzing the histogram of the distribution of Risk RTA (Figure 9) is a wide range of values. Of the 141 values of Risk RTA, 14 cities are characterized by Risk RTA 2022 year < 0.00002. 11 Russian cities are characterized by Risk RTA 2022 year > 0.00010. This allows us to conclude that there is serious heterogeneity in the risk of death in road accidents for residents of Russia.
Table 7 presents the cities belonging to these heterogeneous groups.
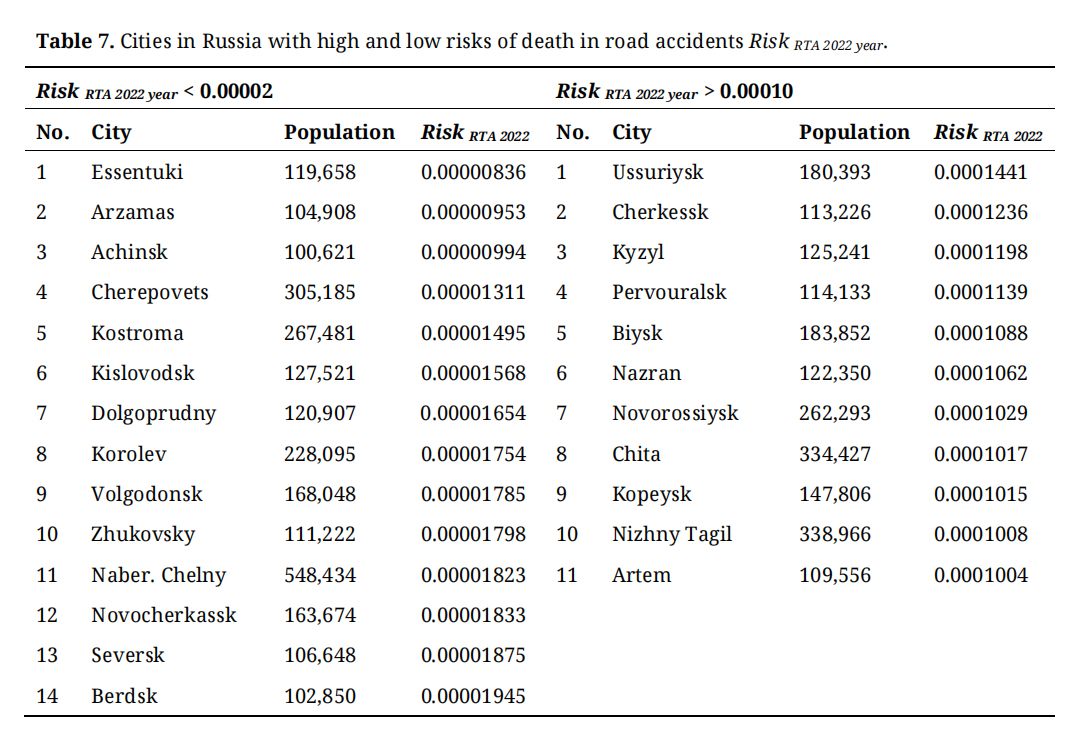 Table 7. Cities in Russia with high and low risks of death in road accidents Risk RTA 2022 year.
Primary analysis shows that among the cities with low Risk RTA, the share of resort towns (Essentuki, Kislovodsk) and science towns (Arzamas, Korolev, Zhukovsky, Seversk) is high. The cities with high Risk RTA mainly include industrial cities (Nizhny Tagil, Ussuriysk, Pervouralsk, Biysk, Chita, Kopeisk, Artem), administrative centers of national republics (Cherkessk, Kyzyl, Nazran) and a port city (Novorossiysk). This specificity suggests a connection between Risk RTA and the quality of the urban environment [71].
Table 8 shows the corresponding values of the Urban Environment Quality Index or UEQI [72] for cities with high and low Risk RTA.
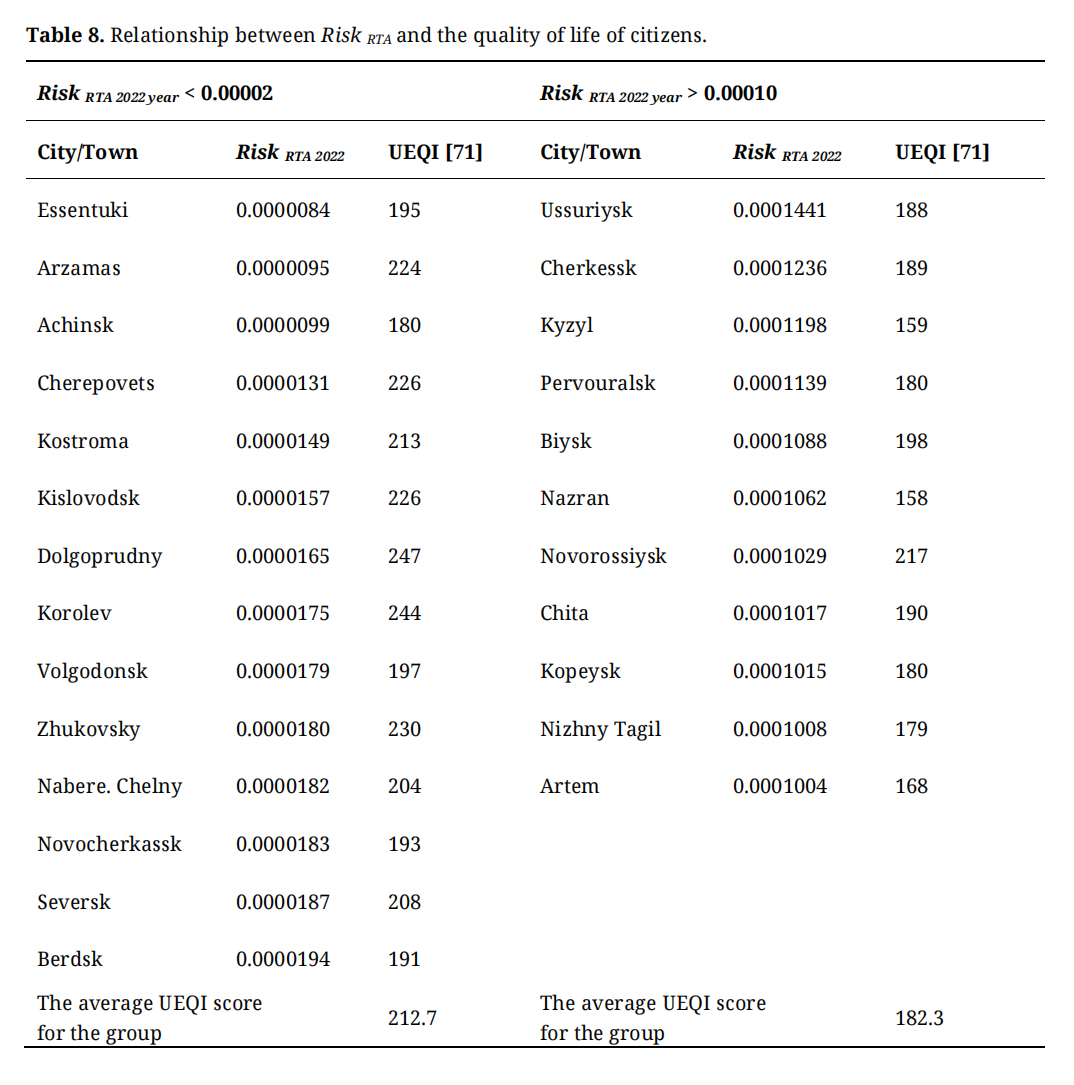 Table 8. Relationship between Risk RTA and the quality of life of citizens.
It is easy to notice that the average Urban Environment Quality Index score for the compared groups of cities differs quite significantly—213 versus 182 in favor of cities with low Risk RTA. Obviously, this fact testifies to the existence of a dialectical contradiction between the quality of the urban environment and the risk of death in an accident Risk RTA.
Influence of the Specific Behavior of Road Users on the Risk of Death in an AccidentThe quality of the urban environment determines the lifestyle of city residents, somehow influences their worldview, shapes their habits and, ultimately, can influence the level of aggression/tact of city residents. In turn, aggressiveness is a direct threat to Road Safety, significantly determining the style of behavior on the road. There are quite a lot of research works devoted to the influence of driving style on road accidents and they all indicate that aggression is a clear source of the causes of road accidents. Let us look at just a few of them [72–77].
G.J.S. Wilde [72] developed a schematic model of driving behavior on the road. In his signature style, which he later uses when developing the theory of risk homeostasis [58], G.J.S. Wilde presents the motives for the driver’s actions that determine the choice of driving style.
T.A. Ranney [73] analyzes models of driving behavior in sufficient detail and concludes that it is difficult to model the motivation of drivers’ actions, noting that the risk of accidents is largely influenced by the aggressive behavior of drivers.
T. Lajunen et al. [74] studied the cultural characteristics of the behavior of drivers of different nationalities (British, Finnish and Danish). The result of their research is that there are, albeit minor, differences in the level of aggression of drivers of different nationalities.
M. Alcañiza et al. [75] studied drinking patterns and drunk-driving behavior of drivers of different gender and age. It turned out that the share of binge drinkers is especially high in the age category of 25–29 years among men. It is this category of drivers who practice extremely risky driving and are dangerous to others.
In [76], the research emphasis is on studying the frequency, style and duration of the manifestation of anger by road users following any road incidents. It turns out that drivers who are irritated by any traffic situation retain their anger for a long time. Of course, there is a clear risk factor for such drivers to display inappropriate actions.
The author in [77] compares the behavior patterns of drivers on the roads in three countries—Estonia, Russia and Kazakhstan and concludes that there really is a specificity in the behavior of drivers in different countries.
So, the behavior of road users is extremely diverse and motivated by many factors. It is clear that the level of aggression on the roads is quite high, but not all drivers participate in it—mostly young and prone to drunk-driving behavior. Obviously, it is the road behavior of such drivers that increases the risk of accidents and death in road accidents.
Summarizing the material of this research we will conclude that the risks of accidents and death in road accidents are extremely heterogeneous in different countries, different cities, and that there is a connection between these risks and the quality of life and lifestyle of people.
The results of our study are generally consistent with the data of the aforementioned authors. The relatively higher risk of fatal road traffic accidents in small towns is explained by the set of factors presented in studies [72–77]. Specifically, in small towns, there are higher risks of traffic violations by drivers under the influence of alcohol and exhibiting aggressive behavior. Different groups of cities also show demographic particularities. In the largest and large cities, a significant proportion of drivers are more senior individuals. In contrast, small Russian towns have a larger proportion of young people leading marginal lifestyles, who don’t value their life and health and are prone to breaking the law. Thus, the authors of this article agree with the main conclusions of the aforementioned works.
The Limitations of the Research and Prospects for Further StudiesThe results of the presented research focus on three main points: the study of the dynamics of the risk of fatalities in road traffic accidents Risk RTA died among residents of Russian cities, the stability of this process, and the identification of the dialectical relationship between the fundamental components of risk—Cons RTA and P RTA. Within the framework of this study, a certain influence of the quality of life on the average city-wide risks of fatalities in road traffic accidents was also established.
This is a crucial aspect, which has led the authors to consider further research in the following areas:
●
●
Additionally, during the course of their research, the authors formulated an important hypothesis regarding the statistical relationship between the specifics of traffic management technology and the behavior of road users. In this context, the authors wish to test this hypothesis and examine the impact of the duration of traffic light cycles, as well as the number of phases in the cycle and their proportional distribution, on the behavior of road users and the number of traffic violations. This research could potentially be pivotal in identifying the relationship between the probability of road traffic accidents and the severity of their consequences, thereby explaining the degree of deviant behavior among road users.
Hypothetically, transport behavior is largely determined by the psychological reactions of individuals, which depend on the waiting time before traffic movement begins, a factor influenced by the characteristics of the traffic light cycle (its duration, number of phases, and the proportions between phases).
In the authors’ view, the first two research directions are interrelated and relevant to all major countries worldwide. The relevance of the third research direction is less obvious, but the authors are deeply convinced that it is connected to the assessment of the entropy of transport systems and the possibility of optimizing traffic light regimes by reducing the chaotic actions of road users.
The most crucial finding of this study is that the risk of fatalities in road traffic accidents Risk RTA died in Russian cities has been decreasing during the period from 2015 to 2023. It is also important to note the various rates of risk reduction in representative cities across different population groups. The largest Russian cities have the slowest dynamics in the reduction of Risk RTA died; conversely, the smaller the city’s population, the higher the rate of reduction in fatality risks in road traffic accidents.
Overall, the process of reduction of the risk of fatalities in road traffic accidents Risk RTA died can be deemed stable. However, the nature of this stable process indicates that the levels of implementation of active and passive safety measures are not identical. The annual number of road traffic fatalities is decreasing more intensively than the annual number of road traffic accidents. This fact indicates relative shortcomings in the implementation of active road safety measures in Russian cities.
The materials of this study indicate extreme heterogeneity in the risk of death in an accident Risk RTA in different cities of the same country (Risk RTA 2022 = [0.0000084; 0.0001441]). The 17-fold difference between the minimum and maximum values of the risk of death in an accident Risk RTA is primarily typical for towns (Population = 100–250 thousand people). For the largest Russian cities, this difference is only 3-fold, and the mathematical expectation of Risk RTA for such cities shifts significantly to the left, towards low values. This is explained, first of all, by the quality of the urban environment—a very broad concept, the essence of which is both the quality of life of citizens and the ways of ensuring their safety. An interesting example is Russian towns (Population = 100–250 thousand people), the risks of accidents in which vary extremely. The minimum values of Risk RTA 2022 are typical for two types of towns—resort towns (Essentuki, Kislovodsk) and science towns (Arzamas, Korolev, Zhukovsky, Seversk). The functional and historical uniqueness of these towns, as well as the specific behavior of local residents and guests, help minimize aggression and, as a result, reduce the risk of death in road accidents. The opposite situation is typical for cities with the highest risk of death in an accident Risk RTA. In such industrial cities as Nizhny Tagil and Pervouralsk, and in national centers such as Cherkessk, Kyzyl, and Nazran, the life of people is quite difficult, which contributes to the formation of high levels of aggressiveness and accident rates.
An important conclusion was obtained during the analysis of the structural features of the risk of death in road accidents. It was found that as the probability of an accident P RTA increases, the value of the “Totality of consequences of an accident” Cons RTA decreases. This feature of the relationship between Cons RTA and P RTA is typical for all categories of cities; however, the parameters of the models describing these characteristics differ for cities with different populations. This is perhaps the most interesting research result from a scientific standpoint. This observation allows us to assert that there is a dialectical contradiction of risks in the field of Road Safety. Otherwise, as the frequency probability of road accidents increases, the risks of death in road accidents decrease. This is explained by the peculiarities of the transport behavior of road users. In the largest cities, traffic conditions create a high density of traffic flows and, as a result, relatively low traffic speeds. In addition, residents of the largest cities, to a greater extent than residents of towns, are characterized by a more or less high-level road culture. Under these conditions, even if the probability of an accident is quite high, the consequences are often not fatal. In towns, on the contrary, violations of safety requirements (speeding, drunk-driving behavior, etc.) are very common, although the traffic density in such cities is much lower, which reduces the likelihood of accidents. Perhaps it is this explanation that determines the paradoxes of Human Factor in the field of Road Safety.
The dataset analyzed in the study can be found at http://stat.gibdd.ru/.
Conceptualization, AP, EL; methodology, AP; software, AP; validation, AP, EL; formal analysis, AP, EL; investigation, AP; resources, AP; data curation, AP, EL; writing—original draft preparation, AP, EL; writing—review and editing, AP, EL; visualization, AP; supervision, AP, EL; project administration, AP, EL; funding acquisition, AP. Author have read and agreed to the published version of the manuscript.
The authors declares that they have no conflicts of interest.
The author would like to thank Viсtor I. Kolesov for his friendly support and professional communication. The author would like to thank the anonymous referees for their very useful suggestions.
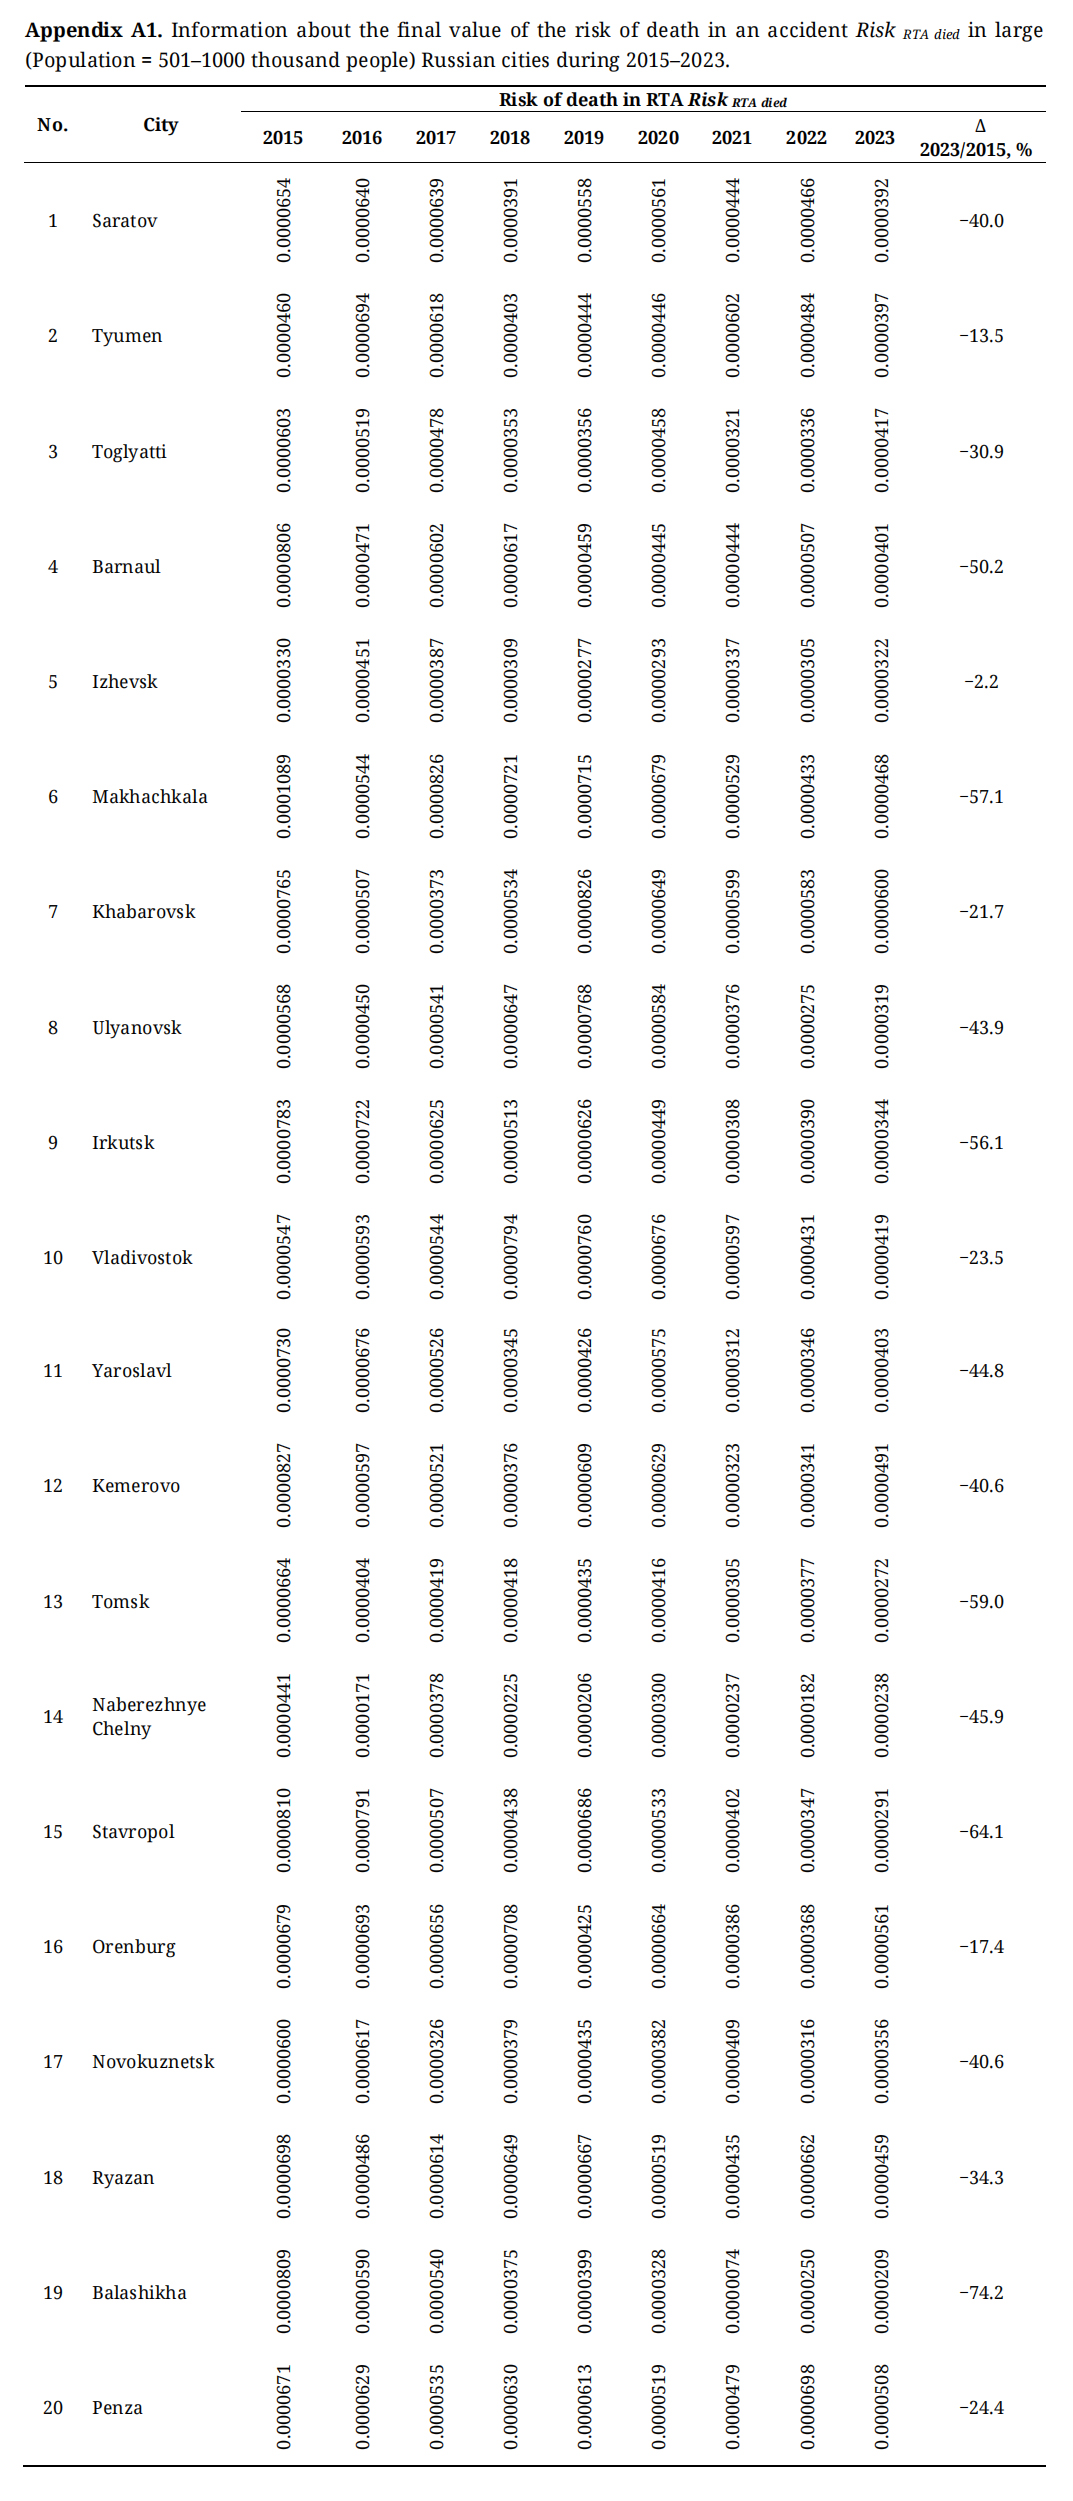 Appendix A1. Information about the final value of the risk of death in an accident Risk RTA died in large (Population = 501–1000 thousand people) Russian cities during 2015–2023.
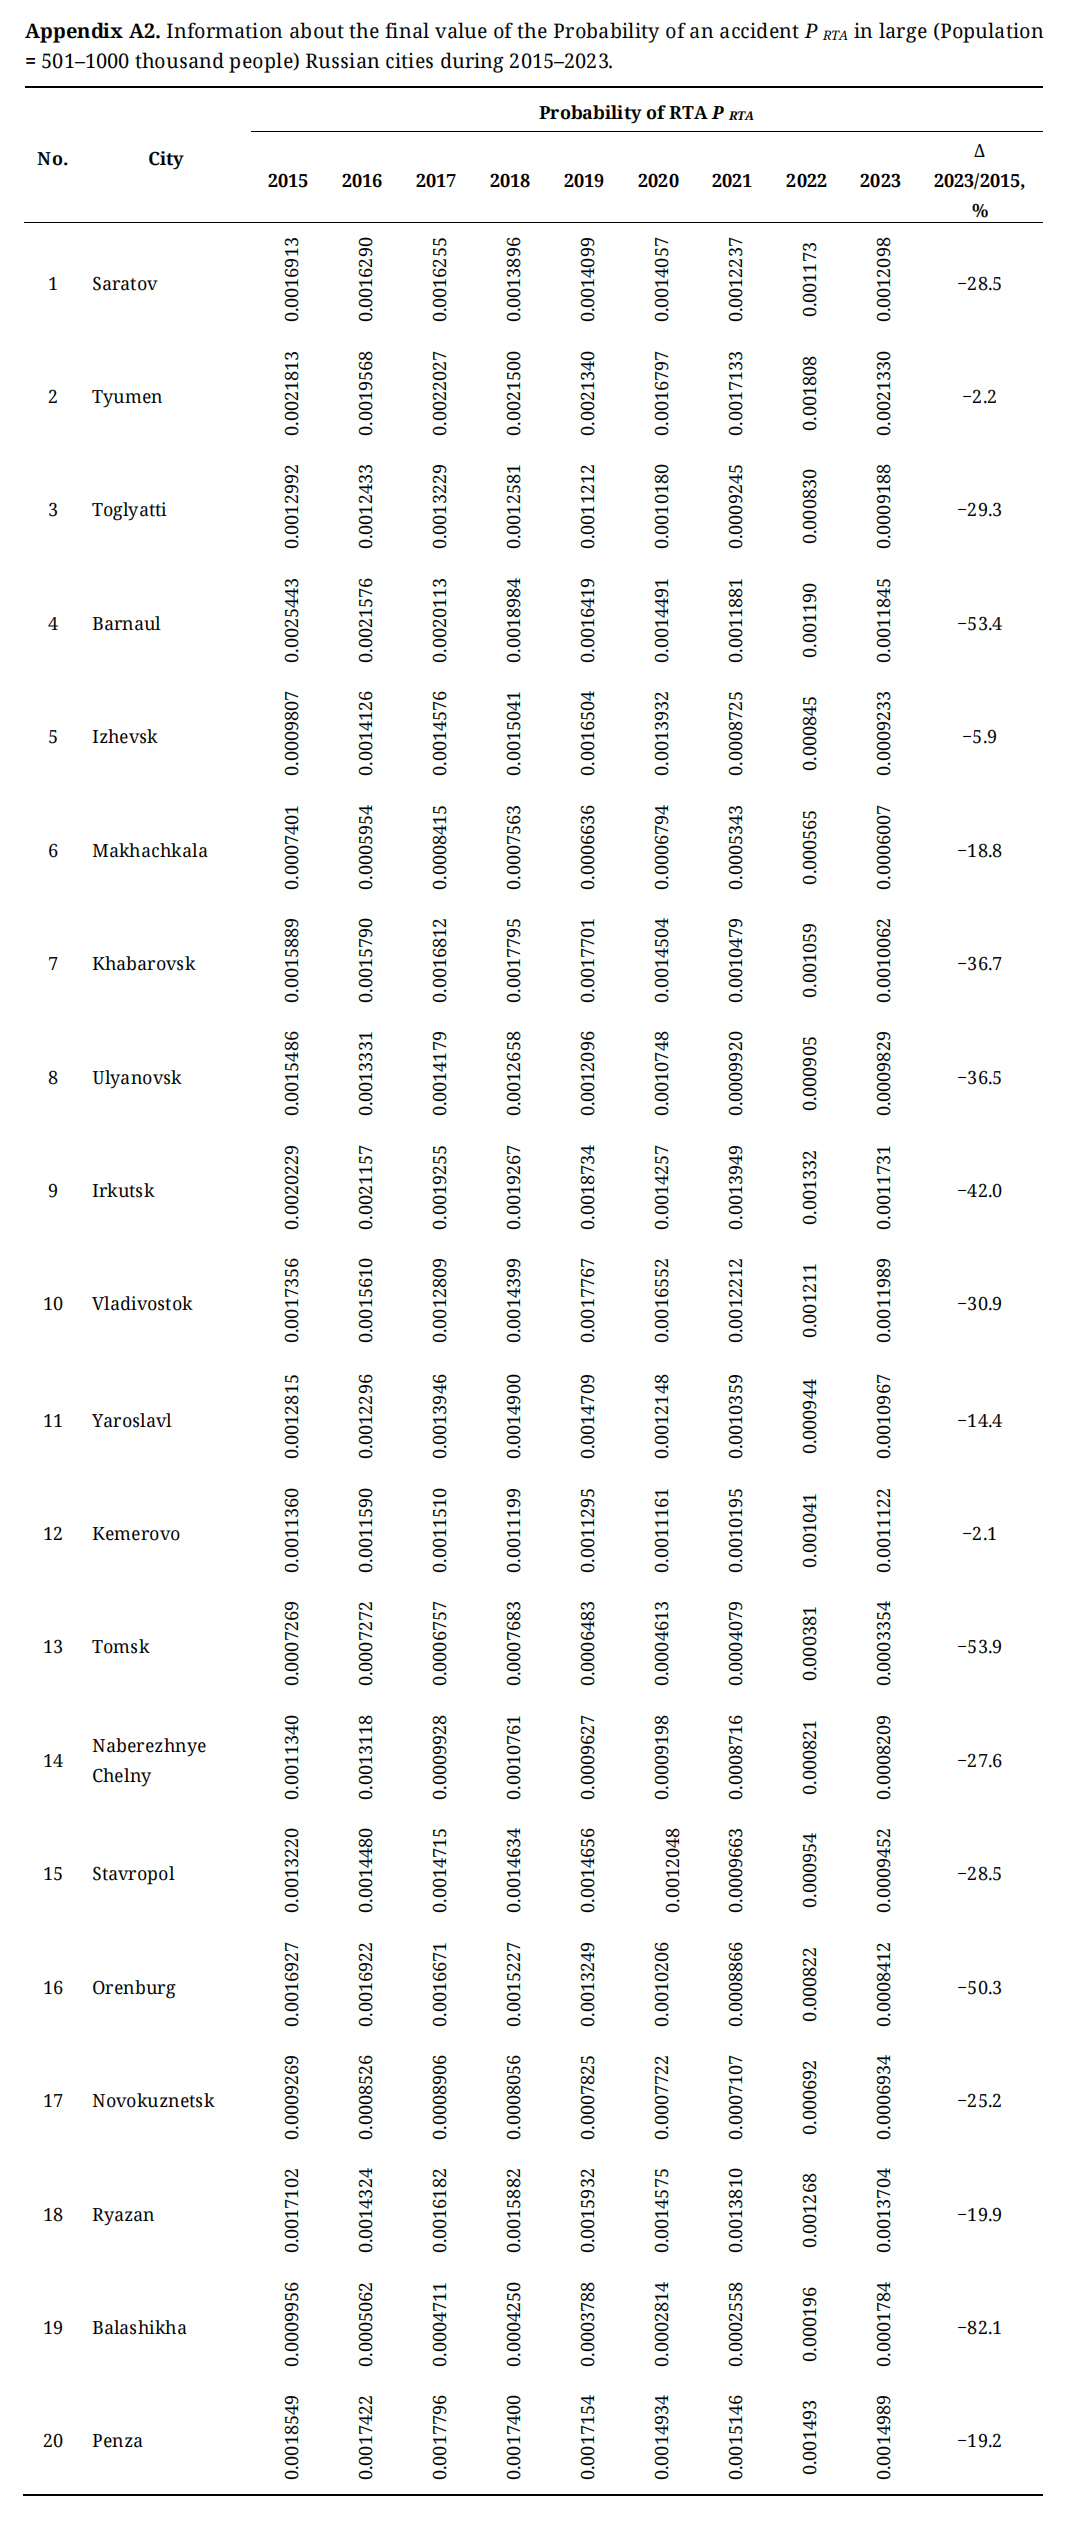 Appendix A2. Information about the final value of the Probability of an accident P RTA in large (Population = 501–1000 thousand people) Russian cities during 2015–2023.
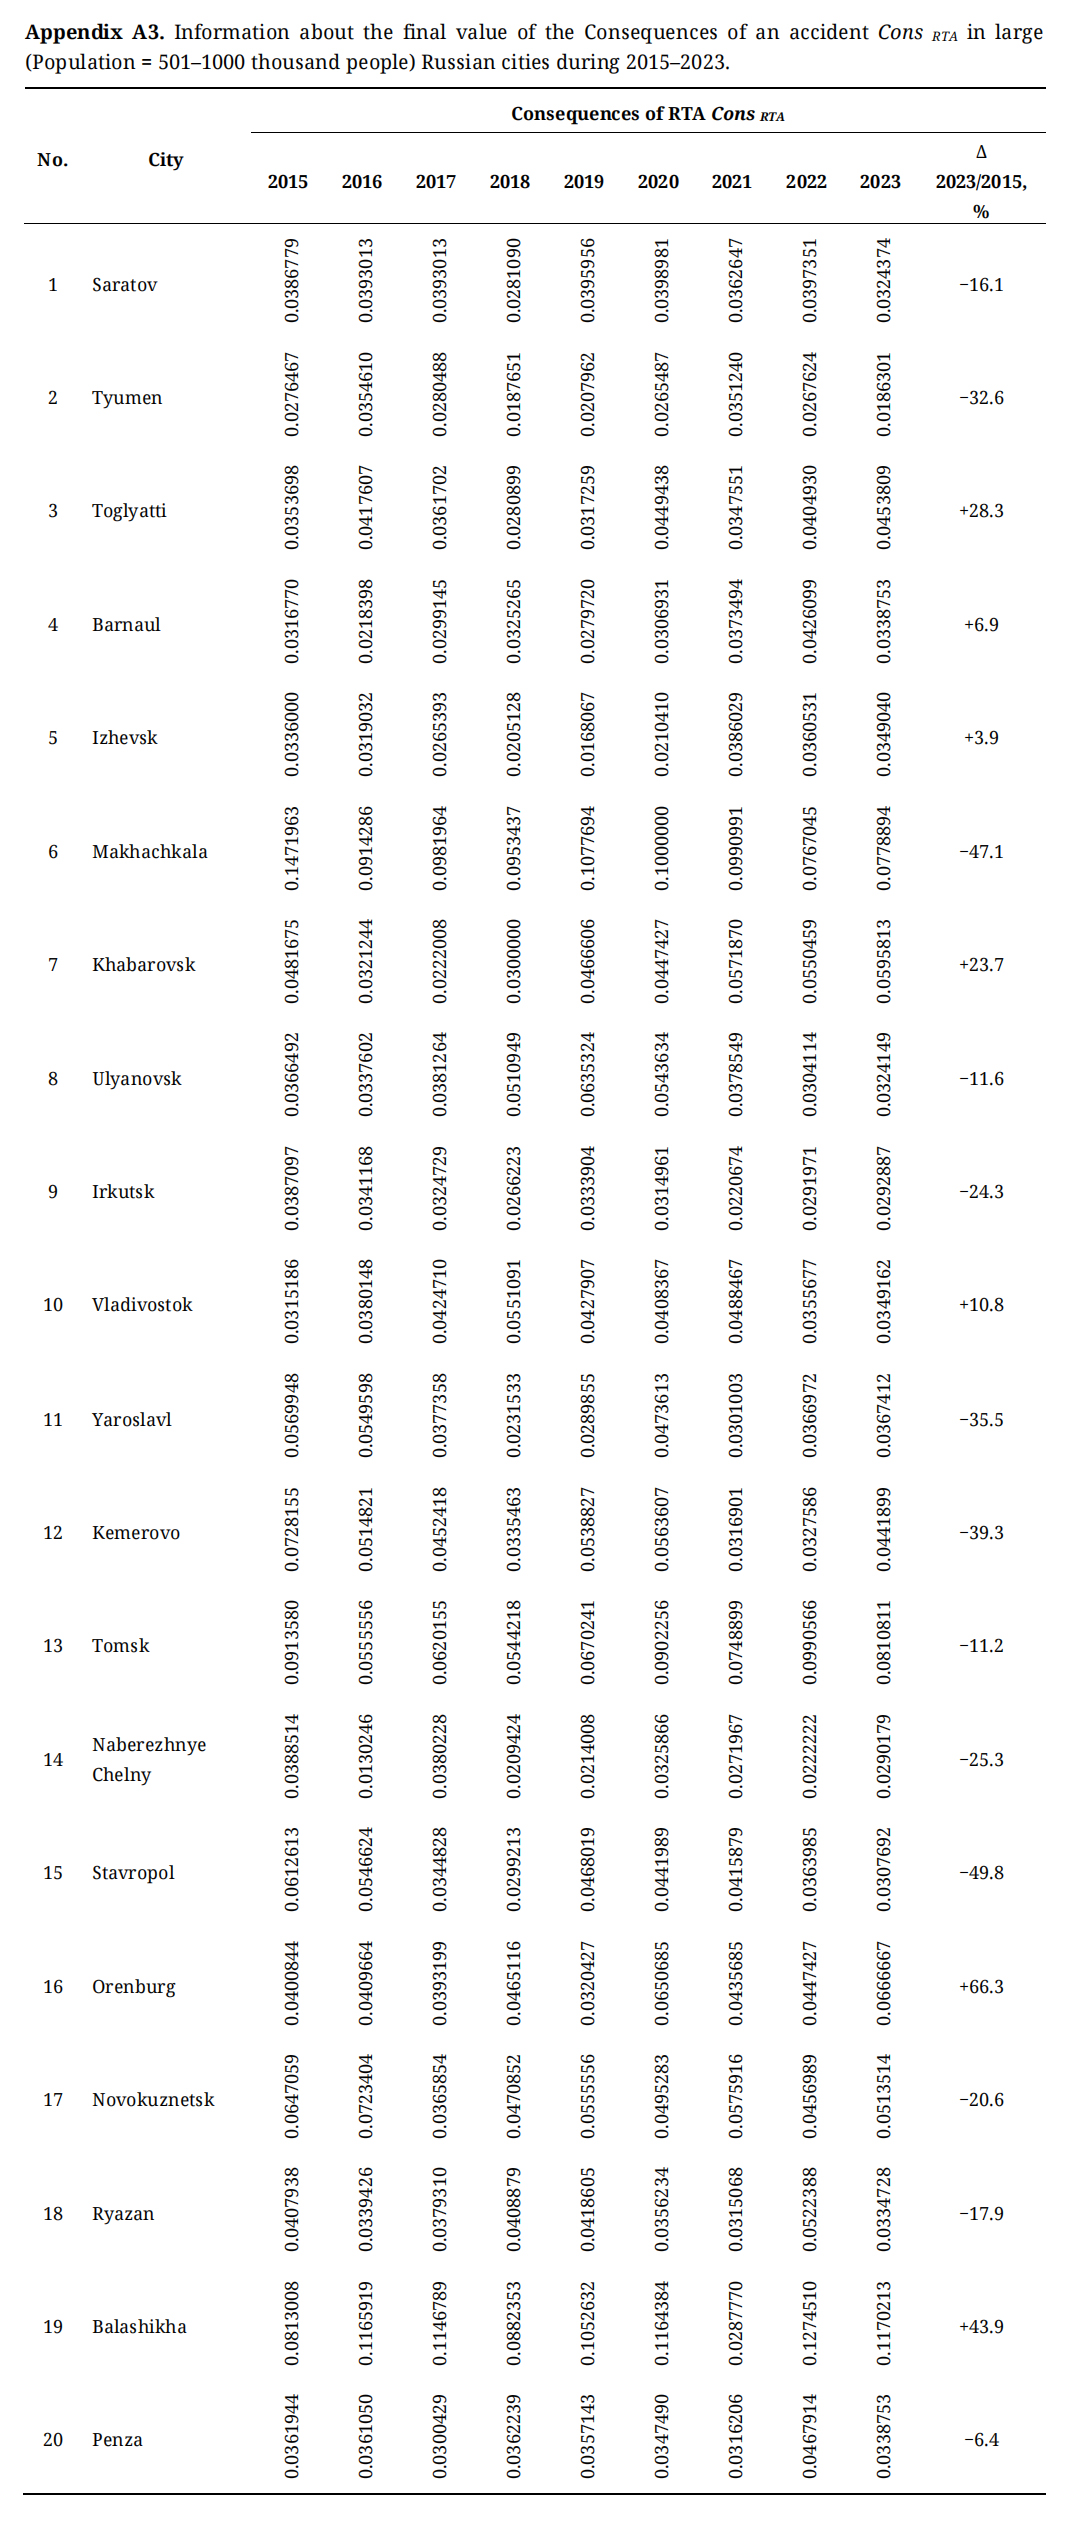 Appendix A3. Information about the final value of the Consequences of an accident Cons RTA in large (Population = 501–1000 thousand people) Russian cities during 2015–2023.
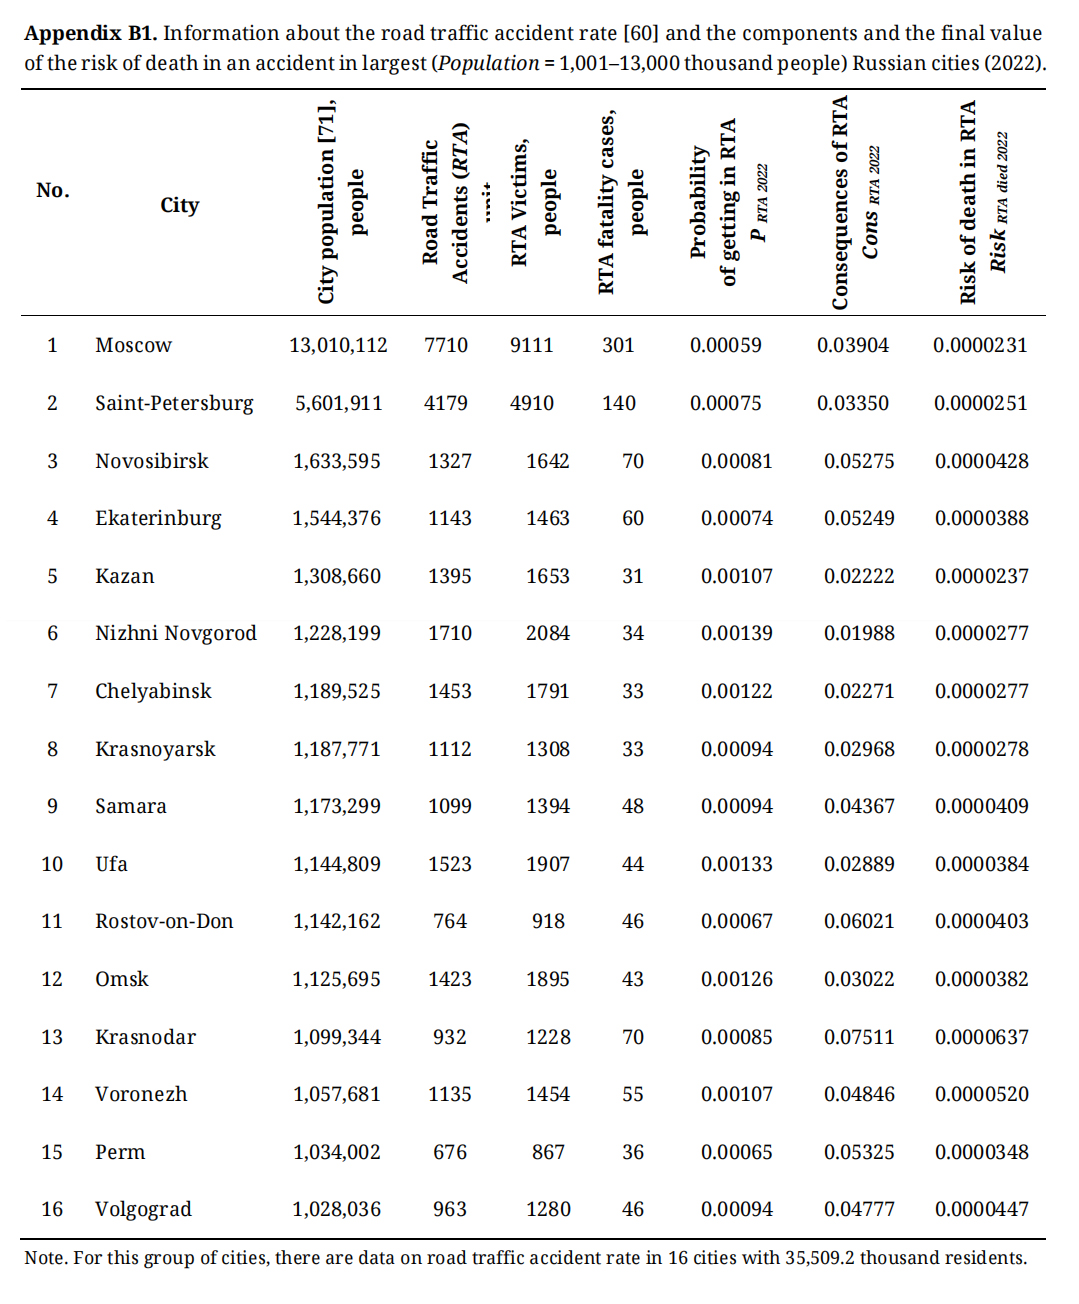 Appendix B1. Information about the road traffic accident rate [60] and the components and the final value of the risk of death in an accident in largest (Population = 1,001–13,000 thousand people) Russian cities (2022).
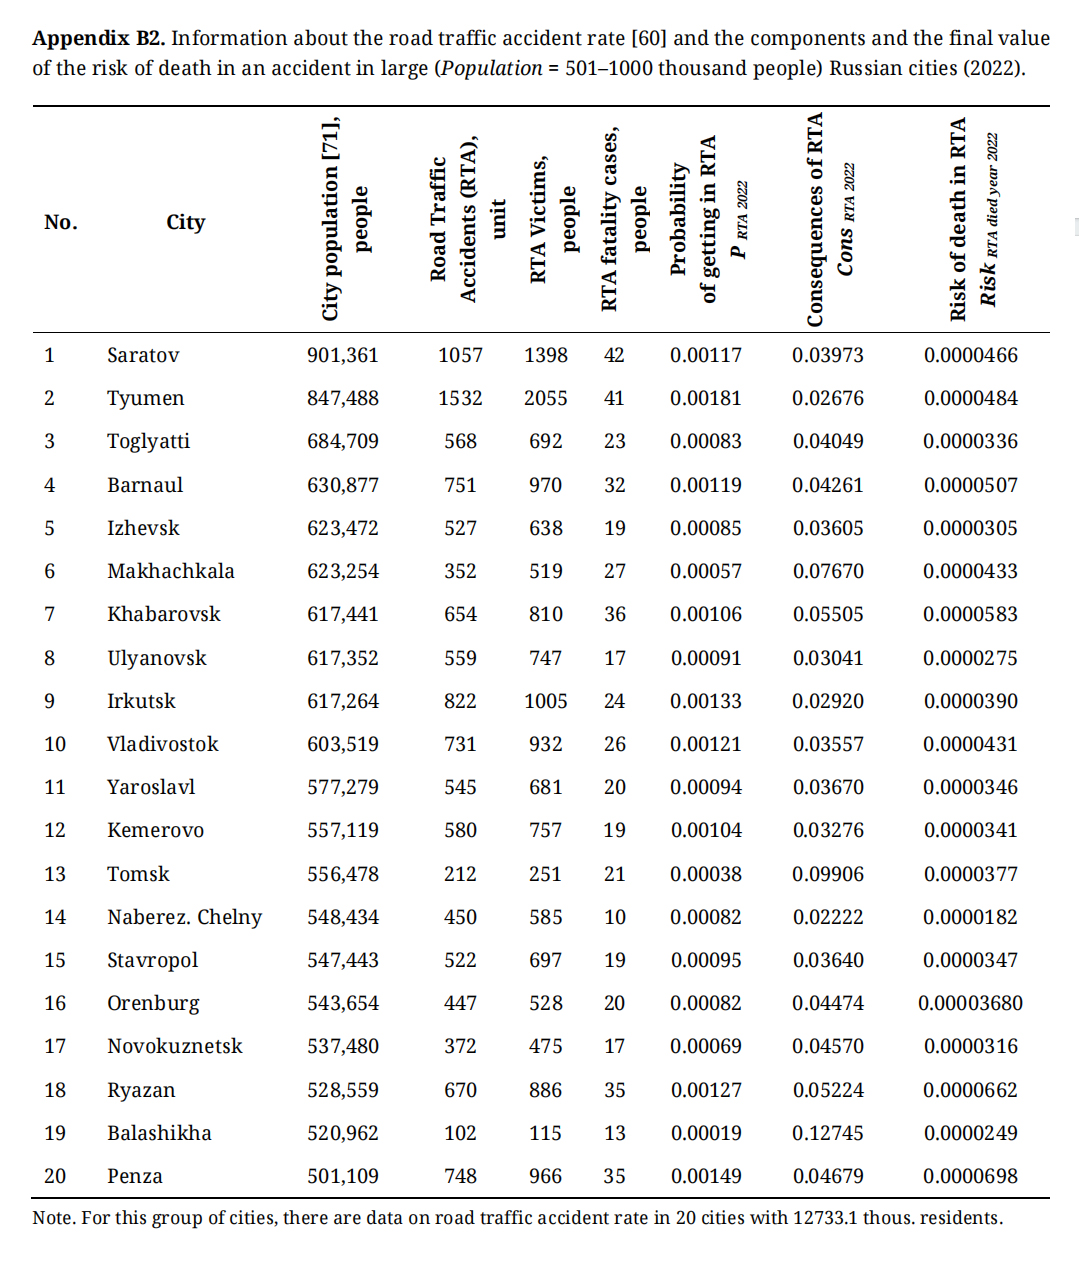 Appendix B2. Information about the road traffic accident rate [60] and the components and the final value of the risk of death in an accident in large (Population = 501–1000 thousand people) Russian cities (2022).
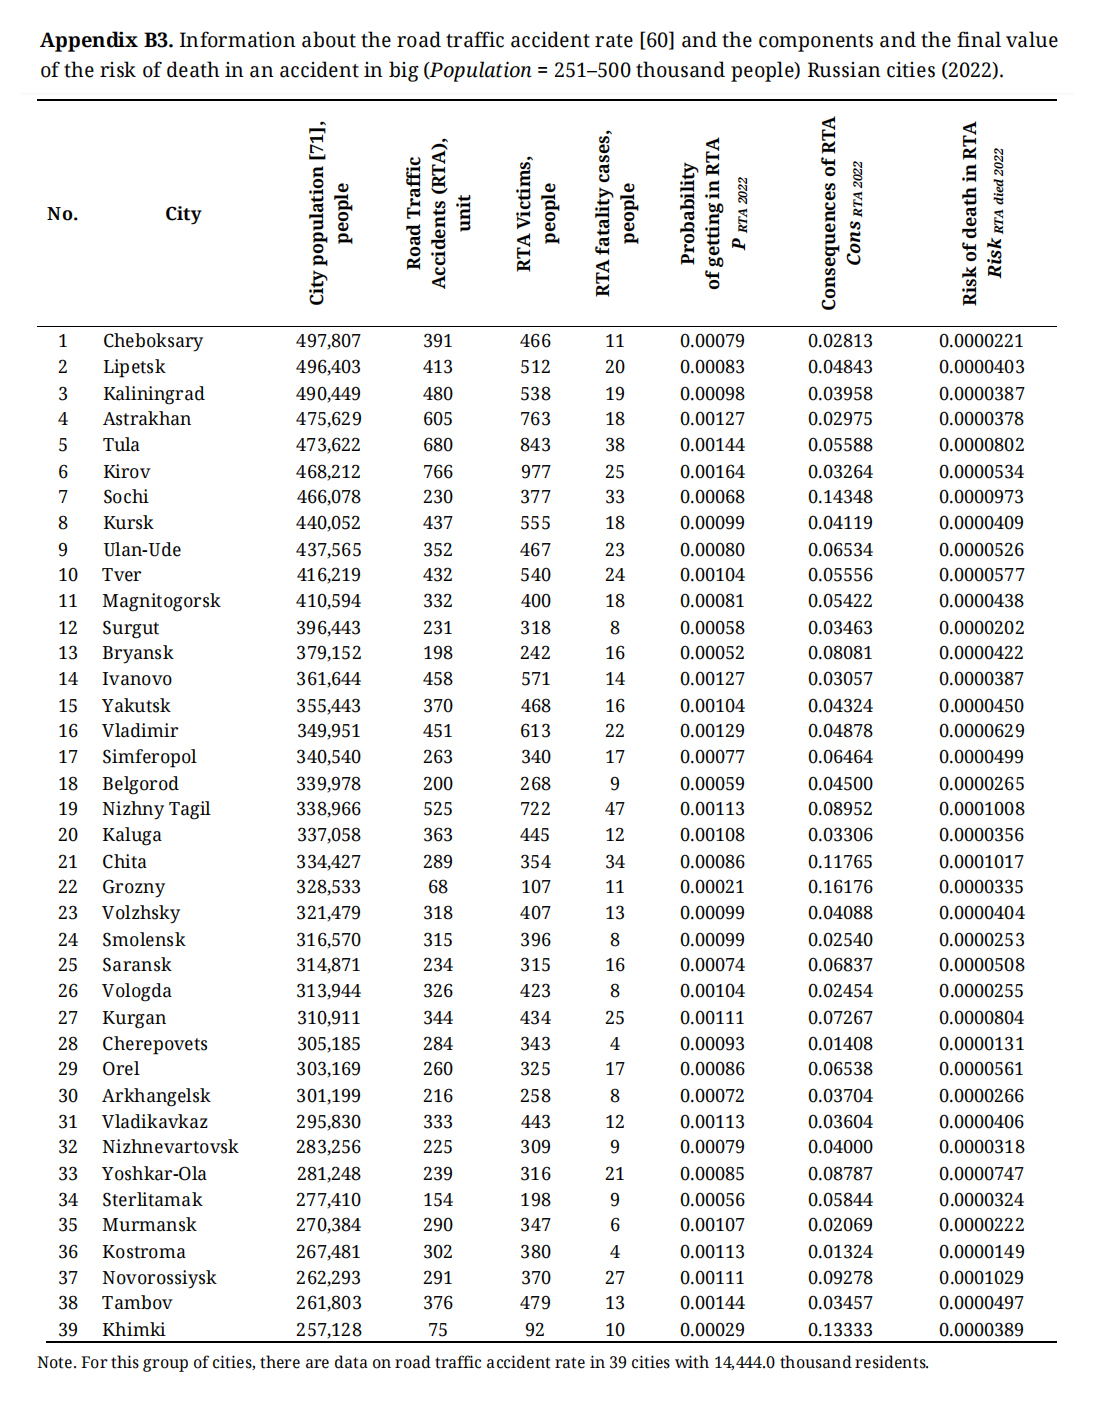 Appendix B3. Information about the road traffic accident rate [60] and the components and the final value of the risk of death in an accident in big (Population = 251–500 thousand people) Russian cities (2022).
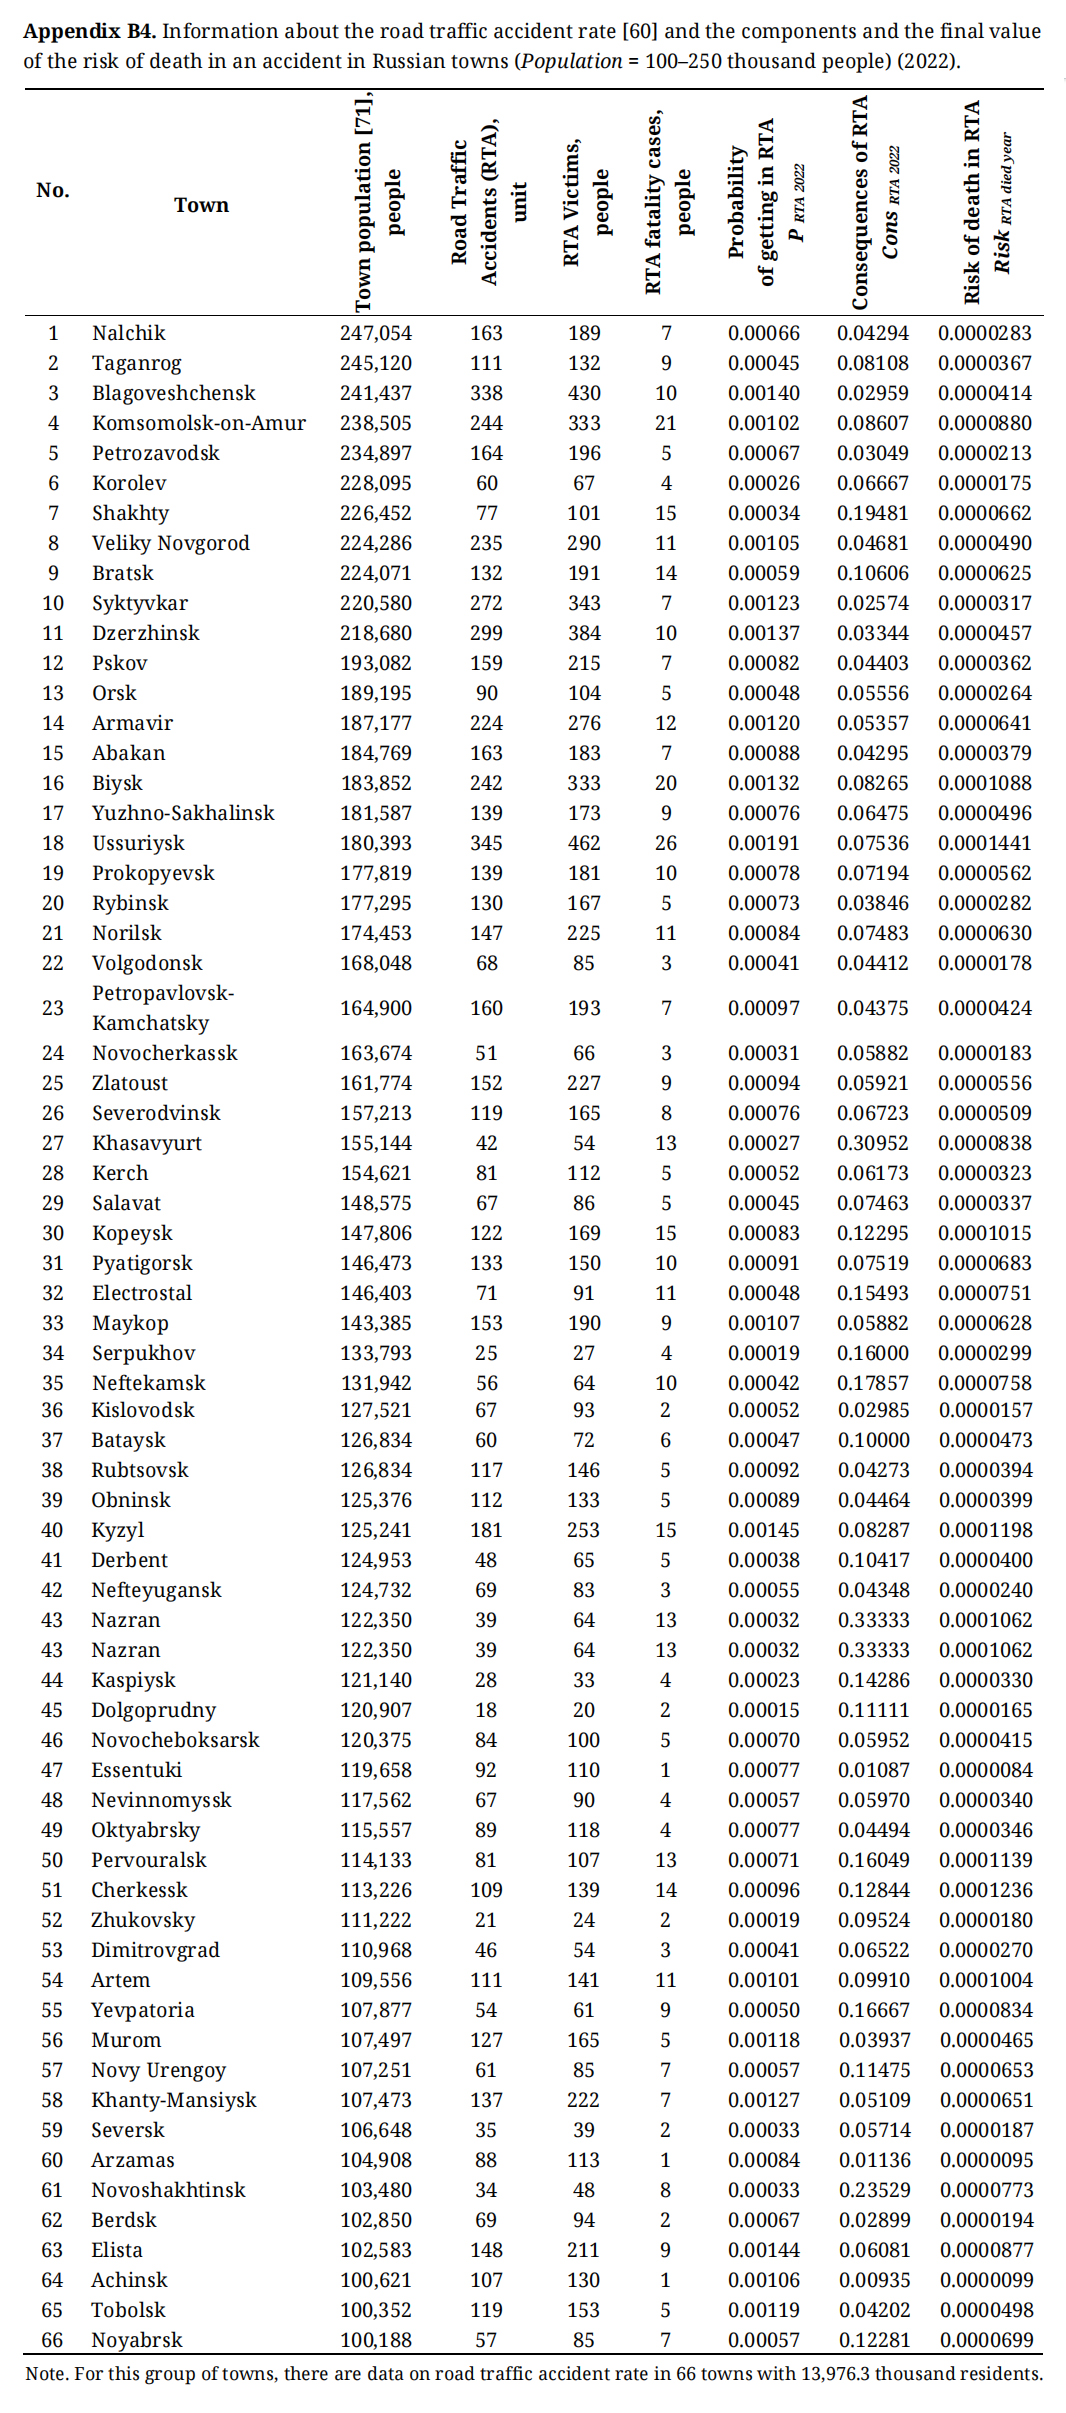 Appendix B4. Information about the road traffic accident rate [60] and the components and the final value of the risk of death in an accident in Russian towns (Population = 100–250 thousand people) (2022).
1.
2.
3.
4.
5.
6.
7.
8.
9.
10.
11.
12.
13.
14.
15.
16.
17.
18.
19.
20.
21.
22.
23.
24.
25.
26.
27.
28.
29.
30.
31.
32.
33.
34.
35.
36.
37.
38.
39.
40.
41.
42.
43.
44.
45.
46.
47.
48.
49.
50.
51.
52.
53.
54.
55.
56.
57.
58.
59.
60.
61.
62.
63.
64.
65.
66.
67.
68.
69.
70.
71.
72.
73.
74.
75.
76.
77.
Petrov AI, Likhajrova EV. Sustainable Improvement of Road Safety in Russian Cities: General Trends and the Dialectical Contradictions in the Structure of Risks of Fatalities in Road Traffic Accidents. J Sustain Res. 2024;6(3):e240042. https://doi.org/10.20900/jsr20240042

Copyright © 2024 Hapres Co., Ltd. Privacy Policy | Terms and Conditions