Location: Home >> Detail
Crop Breed Genet Genom. 2022;4(1):e220001. https://doi.org/10.20900/cbgg20220001

Corteva Agriscience, Leland, Mississippi, MS 38756, USA
This article belongs to the Virtual Special Issue "GGE Biplot Analysis"
Corteva Agriscience cotton breeders were early adopters of GGE Biplot analysis and they have consistently used GGE Biplot as a valuable tool in analyzing G × E interactions in variety advancement trials. After the preliminary evaluations of new experimental lines are conducted by maturity group within their expected areas of adaptation, Corteva combines the more advanced “elite” lines across the early-mid and late maturity programs into the same trial for uniform testing across the eastern half of the US Cotton Belt. The resulting balanced dataset has been analyzed with GGE Biplot to identify meaningful patterns in the data regarding genotype main effects and multiplicative G × E interaction effects. While the maturity of genotypes and the latitude of locations have generally been the primary sources for G × E in Corteva cotton trials, the development of experimental lines with host plant resistance to root-knot nematodes and reniform nematodes has more recently complicated trial analysis. The exclusion of cross-over environments from “GGE-N” and “GGE-S” means has better identified which early-mid or late maturing genotypes should be advanced as compared to typical geographical breakouts. GGE Biplot has proven to be very useful in peeling through the layers of G × E interactions to make effective cotton variety advancement decisions.
G × E, genotype by environment; GGE-N, set of northern environments where early genotypes excel; GGE-S, set of southern environments where late genotypes excel; AMMI, additive main effects and multiplicative interaction; ATC, average tester coordinate; RKN, root-knot nematode; RN, reniform nematode
Corteva began breeding cotton for the Upland picker market in the eastern half of the US Cotton Belt in 1994. The author assumed responsibility for the early-mid maturity program at Leland, MS in 1998 and brought an understanding of yield stability, genotype by environment (G × E) interactions and multi-environment trial analysis gleaned through reading the book Genotype-by-Environment Interaction [1]. The chapters on the Additive Main effect and Multiplicative Interaction (AMMI) model and analysis of yield trial data were particularly informative. This understanding of the AMMI model set the stage for the author to appreciate the unique utility of GGE Biplot [2] to similarly analyze and visualize cotton yield trial data. The primary differences seen between AMMI and GGE Biplot were (1) the removal of the environment main effects from the model even though those effects are often many fold the largest, (2) various graphical displays such as “Mean vs Instability” and “Which Won Where/What” that facilitated further understanding [3,4] and (3) the ability to easily fine tune the dataset by dropping genotypes and/or environments [5]. Corteva was one of the earliest adopters of GGE Biplot and continues to use it as a valuable tool for cotton trial analyses.
Cooperation and coordination between Corteva breeders gave rise to uniform testing of the most advanced experimental lines in the “Elite Conventional” and “Elite Transgenic” trials across all trial locations from Louisiana to Missouri and from Georgia to Virginia. The primary driver in that decision was a desire to facilitate GGE Biplot analysis of the data to better understand G × E interactions and identify superior genotypes that were either broadly adapted or best suited to a specific region. As might be expected from a trial comprised of entries with a wide range of maturities conducted at environments across a broad geography, genotype maturity and environmental latitude have been the primary sources for G × E interaction in those trials over the years. Not surprisingly, the earliest genotypes have yielded higher in the North Delta locations of MO, TN, north AL, north MS and north AR (“GGE-N”) while the latest genotypes have yielded higher in the Deep South locations of GA and south AL (“GGE-S”). However, GGE Biplot has identified some locations in some years that cross over in how they interact with genotypes and are thus excluded from GGE-N or GGE-S means across locations that are identified by GGE Biplot as favoring either the early or the late maturing genotypes, respectively. Consistent with the adage that, “Cotton varieties developed on the banks of Deer Creek (near Leland, Mississippi) uniquely travel well both east and west”, some early-mid genotypes are broadly adapted and have superior yield potential from Missouri to Georgia. However, G × E interactions are often complex and multi-faceted. The development of experimental cotton lines expressing native host plant resistance to root-knot and reniform nematodes has complicated trial analysis because resistant genotypes have significantly higher yield in fields infested with those nematode species. GGE Biplot has again proven to be a useful statistical tool for understanding how the various sources of G × E interaction factor into variety advancement decisions.
The GGE Biplot analysis of Corteva’s “Elite Strains” test in 2010 with both early-mid and late maturity as well as both conventional and transgenic entries will be used to demonstrate the utility of GGE Biplot to cotton trial analysis. The trial had three or four replications of 48 entries in a randomized complete block design at 21 test locations from Louisiana to Virginia. Locations were coded by the two-letter state abbreviation and a serial number. Conventional experimental lines were coded with an “Ex” or “Lx” prefix indicating early-mid or late breeding program genotypes.
The GGE Biplot with Mean vs. Instability view in Figure 1 indicates TN2, SC2 and NC2 locations clustered together away from the other locations. Field observations prior to harvest indicated that the conventional entries at each of these three locations had received significant injury from lepidopteran insect pests during the growing season as evidenced by damaged and missing bolls. Color coding of the transgenic entries in green font in the biplot of Figure 2 indicates a positive G × E interaction with the three lep-damaged locations as evidenced by mostly falling on the same side of the Average Tester Coordinate (ATC). After the three lep-damaged locations were removed from the analysis, the transgenic entries fell somewhat equally above and below the ATC (Figure 3). Examination of the biplot in Figure 3 reveals that the early maturing conventional lines (Ex prefix) mostly fell above the ATC and the late maturing entries (Lx prefix) mostly fell below the ATC which indicated the expected G × E interaction due to differences in maturity and latitude. This effect is visualized in Figure 4 with early-mid genotypes in pink font. Note, however, that GA3, MS2 and AR2 crossed over from their expected region of adaptation and interacted differently with entries from what was expected. Figure 5 is a graph of mean lint yield for genotypes averaged across the five “GGE-N” locations (top circle in Figure 4) and it indicates the highest yielding early maturing lines in pink bars. Likewise, Figure 6 is a graph of mean lint yield for genotypes averaged across the six “GGE-S” locations (bottom circle in Figure 4) and it indicates the highest yielding late maturing lines in blue bars with the exception of the broadly adapted lines PHY499WRF and its conventional parent, Lx74.
 Figure 1. Initial GGE Biplot of 2010 Elite Strains trial.
 Figure 2. GGE Biplot of 2010 Elite Strains trial with transgenic genotypes in green font.
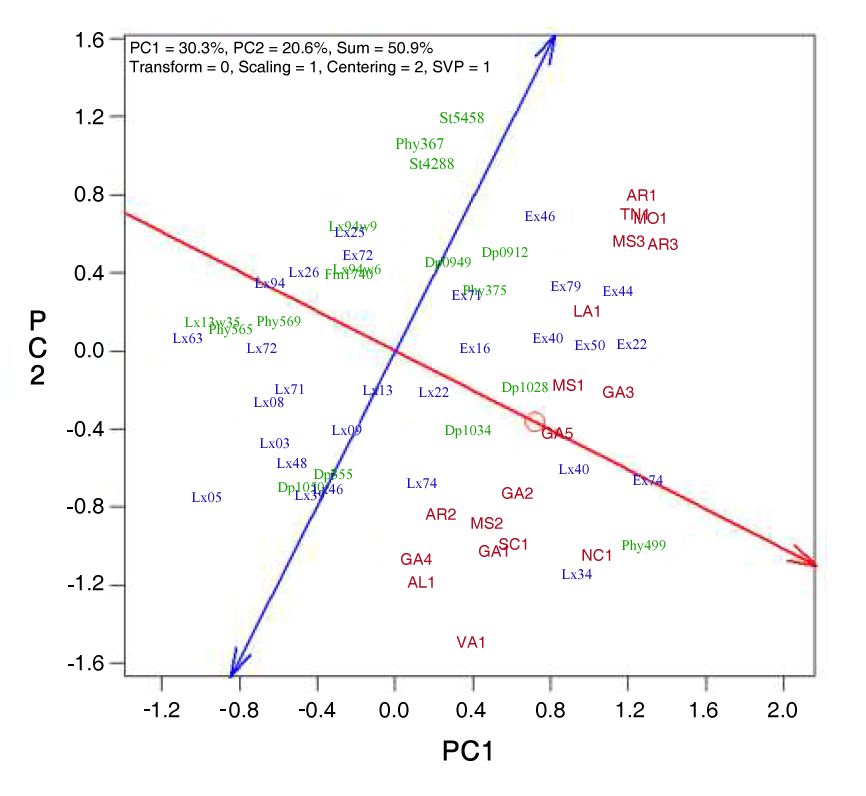 Figure 3. GGE Biplot of 2010 Elite Strains trial less three lep-damaged locations with transgenic genotypes in green font.
 Figure 4. GGE Biplot of 2010 Elite Strains trial less three lep-damaged locations with early-mid genotypes in pink font.
 Figure 5. Mean lint yield for genotypes of 2010 Elite Strains test averaged over five “GGE-N” locations with pink bars indicating early-mid maturing entries.
 Figure 6. Mean lint yield for genotypes of 2010 Elite Strains test averaged over six “GGE-S” locations with blue bars indicating late maturing entries.
In summary, GGE Biplot confirmed field observations of insect damage specifically on conventional entries and it was effective at identifying locations to indicate either the best early-mid or late maturing entries to be advanced. Although G × E contributes relatively little to the discernable variation observed in cotton yield trials, peeling through the layers of G × E interaction enables more effective identification of genotypes to advance toward release as commercial varieties. In 2017, GGE Biplot analysis of the Elite Transgenic test demonstrated that host plant resistance to root-knot nematodes (RKN) in several experimental lines interacted positively (disproportionally higher yield) with several locations known to have fields infested with RKN. Similarly, in 2019, resistance to reniform nematodes (RN) in several new experimental lines was demonstrated to interact positively with several locations known to be infested with reniform nematodes and suggested other locations may be infested as well. Cotton breeders at Corteva use GGE Biplot to understand and to exploit G × E interactions in their variety advancement decisions.
The primary utility of GGE to cotton breeders at Corteva has been the graphical display of both genotype main effects and G × E interactions that conveys meaningful understanding of extensive and complex datasets. While the statistical calculations in the principal component analysis may be difficult to comprehend and understand, the resulting biplots are easily understood by colleagues in marketing and sales as well as those in research and development. As a result, breeders using GGE Biplot, Corteva has been able to effectively target where new varieties should be marketed.
One of the most useful aspects of the GGE Biplot software [5] is the ability to quickly and easily eliminate either genotypes or environments based on both the biplot and the breeder’s knowledge of the genotypes and environments being displayed. A biplot with environments falling to the left of the blue line perpendicular to the red ATC line indicates a complex G × E interaction with genotype performance at those locations being negatively correlated with overall mean performance. While a 3-D view of GGE Biplot may be useful in this case, our approach has been to subset the dataset according to knowledge of genotypes and environments, particularly relative to varietal maturity. The ability to easily get back to the original dataset enables an interactive approach to data analysis.
Another very useful aspect of GGE Biplot software is the ability to color code genotypes and environments to graphically display trends that quickly convey understanding of G × E interactions. To reflect overall performance in a given set of environments and years, one can present a biplot with the overall data with the primary source of G × E interaction indicated by differentially coding of genotypes and environments. Then selected genotypes or environments can be eliminated to display a secondary level of G × E interaction as indicated by another color-coding scheme.
In addition to conducting GGE biplot analysis, cotton breeders at Corteva desire to understand varietal performances in high versus low yielding environments, for example by using the regression statistics and graphs of Finlay-Wilkinson [6].
In conclusion, the author has found GGE Biplot to be a valuable tool for the analysis of trials evaluating the performance of new experimental lines and for conveying understandings of G × E interactions for the marketing of new varieties.
The author declares no conflict of interest.
1.
2.
3.
4.
5.
6.
McPherson M. An Application of GGE Biplot to Cotton Variety Development. Crop Breed Genet Genom. 2022;4(1):e220001. https://doi.org/10.20900/cbgg20220001

Copyright © 2022 Hapres Co., Ltd. Privacy Policy | Terms and Conditions