Location: Home >> Detail
Crop Breed Genet Genom. 2025;7(2):e250005. https://doi.org/10.20900/cbgg20250005
 ,
Zakaria El Gataa 2,* ,
Sherif Thabet 3 ,
Zakaria Kehel 2 ,
Khaled El-Shamaa 1 ,
Shamseldeen Eltaher 4 ,
Sherif Edris 5,6,7 ,
Wuletaw Tadesse 2
,
Zakaria El Gataa 2,* ,
Sherif Thabet 3 ,
Zakaria Kehel 2 ,
Khaled El-Shamaa 1 ,
Shamseldeen Eltaher 4 ,
Sherif Edris 5,6,7 ,
Wuletaw Tadesse 2
1 The International Center for Agricultural Research in Dry Areas (ICARDA), Cairo 13611, Egypt
2 The International Center for Agricultural Research in the Dry Areas (ICARDA), Rabat 10000, Morocco
3 Agricultural Research Center (ARC), Cairo 13611, Egypt
4 Department of Plant Biotechnology, Genetic Engineering and Biotechnology Research Institute (GEBRI), University of Sadat City, Sadat City 32897, Egypt
5 Department of Biological Sciences, Faculty of Sciences, King Abdulaziz University, Jeddah 21589, Saudi Arabia
6 Department of Genetics, Faculty of Agriculture, Ain Shams University, Cairo 11566, Egypt
7 Centre for Excellence in Bionanoscience Research, King Abdulaziz University, Jeddah 21589, Saudi Arabia
* Correspondence: Zakaria El Gataa.
Bread wheat (Triticum aestivum L.) is crucial for food security in North Africa, where climate change and water scarcity threaten its productivity. Optimizing agronomic practices and understanding genetic traits can enhance yield. This study evaluated 159 spring bread wheat genotypes from ICARDA under raised bed, flat, and rainfed conditions in Egypt and Morocco. Five traits, including grain yield (GY), were assessed, and a genome-wide association study (GWAS) was performed using 17,968 SNPs. A total of 181 significant marker-trait associations (MTAs) were identified, with the highest under raised beds (148), followed by rainfed (75) and flat (53) conditions. The B genome had the most associations (91). Raised bed conditions yielded an average of 8.7 t/ha, surpassing flats (7.8 t/ha) and rainfed conditions (4.0 t/ha), demonstrating a +1 t/ha advantage. The top-performing genotype, G147, achieved yields of 11.4 t/ha, 10.7 t/ha, and 4.1 t/ha under raised beds, flats, and rainfed conditions, respectively. Genotypes G91 and G87 also showed stable performance. Notably, the marker “AX-94704405” on chromosome 6B (raised beds) and “AX-109853614” on chromosome 6D (rainfed) were significantly associated with GY, making them promising for marker-assisted selection after validation. The identified high-yielding genotypes will be considered for direct release following adaptation trials and for use as parents in breeding programs to enhance wheat productivity under diverse environments.
GWAS, genome wide association study; MTA, marker trait association; SNP, single nucleoid polymorphism
Wheat has played a fundamental role in human civilization and contributed to improving food security at global and regional levels since its origin in the Fertile Crescent about 10,000 years ago. It provides about 19% of the calories and 21% of the protein needs of daily human requirements at the global level [1]. Egypt grows wheat on an average of 1.4 million hectares per year. The productivity of wheat in Egypt (7 t/ha) is among the highest in the world. However, productivity is still affected by high temperatures, diseases (yellow rust, leaf rust and stem rust), salinity, and water shortage for irrigation. Egypt consumes about 20 million tons of wheat, produces about 10 million tons and imports about 10 million tons of wheat on an annual basis. The situation is further complicated by food production shortfalls associated with climate change [2].
Despite wheat yield increases achieved over the last two decades through improved harvest indices, yields remain significantly challenged by abiotic stresses, particularly heat and early summer drought [3], with drought stress events becoming more frequent globally due to climate change since 1980 [4]. Drought stress impacts critical plant developmental stages such as flowering and grain filling, directly causing major yield losses [5]. Egypt, highly vulnerable due to its arid climate and negligible rainfall limited mostly to a narrow coastal strip, faces severe water scarcity, with per capita water availability around 500 m3, far below water poverty levels, and agriculture consuming approximately 85% of renewable water resources [6].
Conventional surface irrigation in Egypt is still widely used despite being only 40%–50% efficient, with most water lost to seepage, leaks, and deep percolation. To conserve water, Egypt is promoting modern irrigation methods, but high costs prevent rural farmers from adopting them. Furrow irrigation, particularly raised beds, offers a cost-effective alternative with low initial investment, reduced pumping costs, and higher efficiency. Raised beds can increase yields by 15%–25%, improve water productivity by 25%, and cut seed and labor costs by 50%. They also lower disease risk, helping farmers adapt to climate change and water scarcity [7,8].
The characterization of germplasm is a precondition for breeding activities as it provides novel variations that can be used for the marker-assisted breeding of crops [9]. Genetic variations for yield potential, water use efficiency, drought tolerance and other agronomic traits have been reported by many authors [10,11]. The discovery of new genomic regions for specific agronomic traits became feasible after recent breakthroughs in the development of single nucleotide polymorphism (SNP) arrays [12]. Some QTLs associated with various drought resistance traits in wheat have been identified using linkage mapping [13] and association mapping via GWAS [14–16]. In this study, we conducted a GWAS on 159 spring bread wheat genotypes from ICARDA grown under three different cultivation methods: raised bed, flat, and rainfed. Our aim was to study the genetic variation in yield and agronomic trait performance among elite bread wheat genotypes under irrigated conditions using raised bed and flat plot management systems, as well as under rainfed conditions. Additionally, we aimed to identify markers and putative genes associated with grain yield and agronomic traits.
A set of 159 elite spring bread wheat genotypes from the International Centre for Agricultural Research in the Dry Areas (ICARDA), including one Egyptian wheat cultivar, Misr1, obtained from the Agricultural Research Centre (ARC), Egypt, had been evaluated at Sids station in Egypt under irrigated conditions using raised bed and flat plot arrangements. The experiment was also conducted under rainfed conditions at the Merchouch station in Morocco. The Sids station in Egypt is a high-yielding station located in Beni Suef governorate at 29° 358.06 N, 31° 557.79 E, 32.2 m a.s.l. The soil is highly fertile clay loam with a pH level of 7.8. The temperature ranges from 20 to 35 ℃, with an average temperature of 30 ℃ during the cropping cycle (from December to April) [10]. The Merchouch station is located in the Zair region at 33° 36′ 41″ N, 6° 42′ 45″ W, 390 m a.s.l, the soil is characterized by a cambisol soil type with annual temperatures ranging between 10 and 40 ℃, where annual rainfall levels range from 200–300 mm [14].
Experimental Design and PhenotypingAt Sids station of Egypt, planting was carried out at a seeding rate of 100 kg/ha on November 27, 2020, using raised bed and flat (traditional) plots arranged in alpha lattice design with 2 replications. The experiment was conducted in two growing seasons: 2020 and 2021. The raised bed was planted using a raised bed planter machine in plots of 3 m length with two beds each with three rows at 75 cm distance from center to center. The distance between rows and beds is 15 and 30 cm, respectively. For the flat (traditional) planting, genotypes were planted in a plot size of 3 m length with six rows at 0.2 m spacing between rows. In both bed and flat conditions, the surface irrigation method was used.
At the rainfed station of Merchouch, Morocco, planting was carried out at a seeding rate of 80 kg/ha during the first week of December. The experiment was conducted in 2018 and 2019, with genotypes planted in plots measuring 3 m in length, consisting of six rows spaced 20 cm apart. The genotypes were phenotyped for days to heading (DHE), days to maturity (DMA), plant height (PLH), thousand kernel weight (TKW), and grain yield (GY). DHE and DMA in days were recorded for each plot when 50% and 90% of the plants reached the heading and maturity stages, respectively. PLH in centimeters was recorded for each genotype with a meter rule when plots reached maturity by measuring 5 plants in each plot from the ground to the top of the spike, excluding the length of the awns. Grain yield was weighed in kg/plot and then converted into tons per hectare (t/ha) after threshing the whole plot.
DNA Extraction and GenotypingThe wheat samples underwent genotyping utilizing the Wheat Illumina iSelect 25K single nucleotide polymorphism (SNP) array at the SGS Institut Fresenius GmbH TraitGenetics Section in Gatersleben, Germany. Samples were obtained from the flag leaves of each genotype, put on plates, and then sent to the laboratory for DNA extraction and genotyping. A total of 159 bread wheat genotypes were examined using 23K SNP markers. Subsequent to data collection, the genotypic data was subjected to a filtering process to preserve only the most reliable information for analysis. SNPs having a minor allele frequency (MAF) under 5% and heterozygosity over 10% were eliminated. Following this screening procedure, 17,968 SNPs were retained, serving as the foundation for further GWAS investigations.
Genome-Wide Association Study (GWAS) and Putative Candidate GenesTo identify SNP markers associated with grain yield and yield-related traits, GWAS analysis was performed using TASSEL Version 5.0 and the mixed linear model (MLM: Q + K). The model used can be expressed as: Phenotype = Marker + Population structure + Kinship + Error. Principal component analysis (PCA) was applied to represent population structure, with the top five principal components (PCs) included in the analysis. We used a GWAS model incorporating kinship and the top five principal components (PCs) to adequately control for population structure. Although the first three PCs cumulatively explained approximately 79% of the variance (PC1: 48.20%, PC2: 17.26%, PC3: 13.61%), we opted for a conservative and thorough approach using five PCs. This choice ensured comprehensive control of population stratification in alignment with current practices in recent GWAS literature. Results obtained were robust, biologically meaningful, and consistent with literature, confirming that the inclusion of five PCs did not alter the biological interpretations or the conclusions drawn from our analyses. Manhattan plots were conducted by using the negative logarithm at base 10 of the p-values (−log10(p)) across the physical map. The SNPs with −log10(p) > 3.0 were characterized as significant MTAs across the 21 chromosomes. The CMplot package in the R environment [17] was used to trace only significant SNPs (−log10(p) > 3.0) by annotating the SNP.
To further investigate the genetic control of the studied trait under bed and flat conditions, gene models containing the identified significant markers were analyzed. This was done by checking the base pair positions of the markers and identifying gene models at the same positions using the Ensembl Plants database (https://plants.ensembl.org/Triticum_aestivum/Info/Index, accessed 28 Apr 2025). UniProt was used to determine the protein names, molecular functions, and biological processes of the putative genes.
The epistatic interactions of SNPs were examined based on the effects of significant markers, using the following formulas [18]:
●
●
The Circos illustration of the SNP epistasis was created using shinyCircos-V2.0 software [19], focusing just on SNPs exhibiting strong synergy.
The present study investigated 159 spring bread wheat genotypes for 5 traits, grain yield (GY), days to heading (DH), days to maturity (DM), plant height (PTH), and thousand kernel weights (TKW) across the three conditions. Figure 1 showcases the density distribution of agronomic traits in 159 bread wheat genotypes under both bed and flat planting methods as well as under rainfed conditions, revealing that almost all traits exhibit a unimodal distribution.
Table 1 shows the statistical description of agronomic traits under the three conditions. The average grain yield under beds was 8.7 tons per hectare, while it was 7.8 tons per hectare under flats. This translates to an approximately 1-ton increase in net yield when beds were used. Under rainfed conditions, the mean of grain yield was 4 t/ha. The maximum yield under bed conditions was 11.4 t/ha, and under flat conditions, it was 10.7 t/ha, while the maximum yield under rainfed conditions was 5.4 t/ha. Grain yield showed the highest coefficient of variation (CV), with values of 14.8%, 16.1%, and 15.3% under bed, flat, and rainfed conditions, respectively. Plant height exhibited the highest heritability, with values of 0.53, 0.63, and 0.76 under raised-bed, flat, and rainfed conditions, respectively.
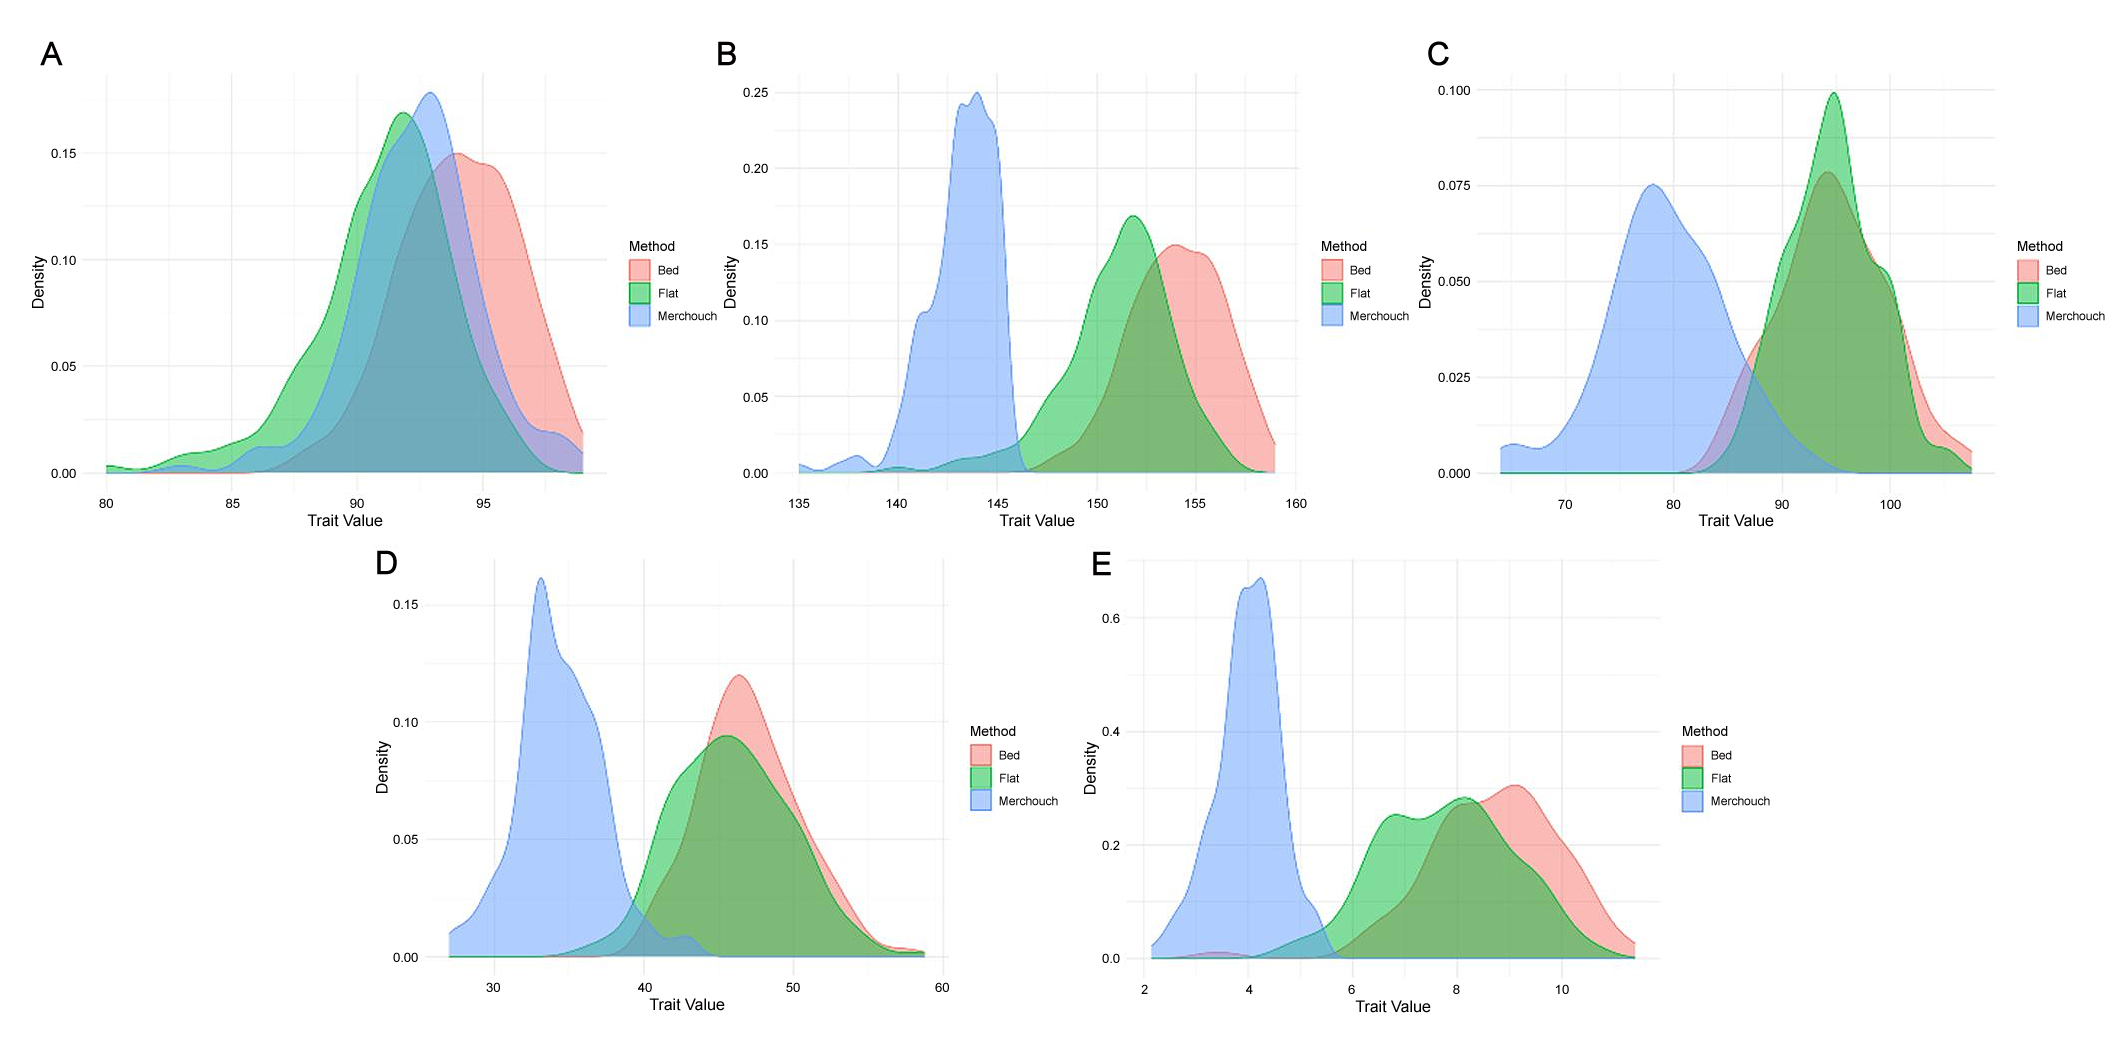 Figure 1. Density distribution of agronomic traits in 159 bread wheat genotypes under bed and flat planting methods as well as rainfed conditions (Merchouch). (A) days to heading, (B) days to maturity, (C) plant height, (D) thousand kernel weights, and (E) grain yield.
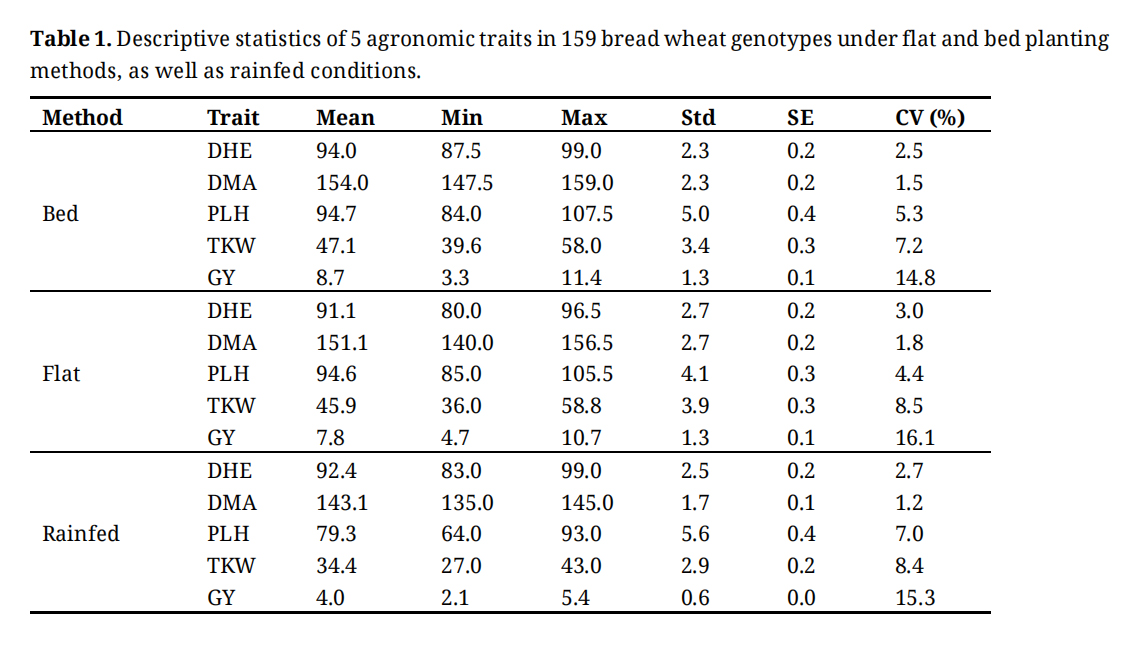 Table 1. Descriptive statistics of 5 agronomic traits in 159 bread wheat genotypes under flat and bed planting methods, as well as rainfed conditions.
Figure 2 presents the Principal Component Analysis (PCA) biplot illustrating the relationship between agronomic traits and 159 bread wheat genotypes under three planting methods: bed, flat, and rainfed. Under bed conditions, the first two principal components (PC1 and PC2) account for 40.4% and 21% of the total variation, respectively. Similarly, under flat conditions, PC1 and PC2 explain 42% and 22% of the variation, respectively. Under rainfed conditions, PC1 and PC2 explain 44.8% and 21.4% of the variation, respectively. The distribution of genotypes across the four quadrants highlights the variability in agronomic performance, with each genotype positioned based on its unique combination of traits. The spread of genotypes suggests a wide range of responses under both planting methods, indicating potential differences in adaptability and productivity. The PCA biplot further reflects the correlations among agronomic traits, reinforcing patterns observed in the original data. DM and DH exhibit a strong positive correlation, as evidenced by their overlapping vectors. Similarly, PLH and TKW point in the same direction under flat conditions, indicating a relationship between these two traits. The length of the vectors for these traits suggests their significant contribution to genotype differentiation along the principal component axes.
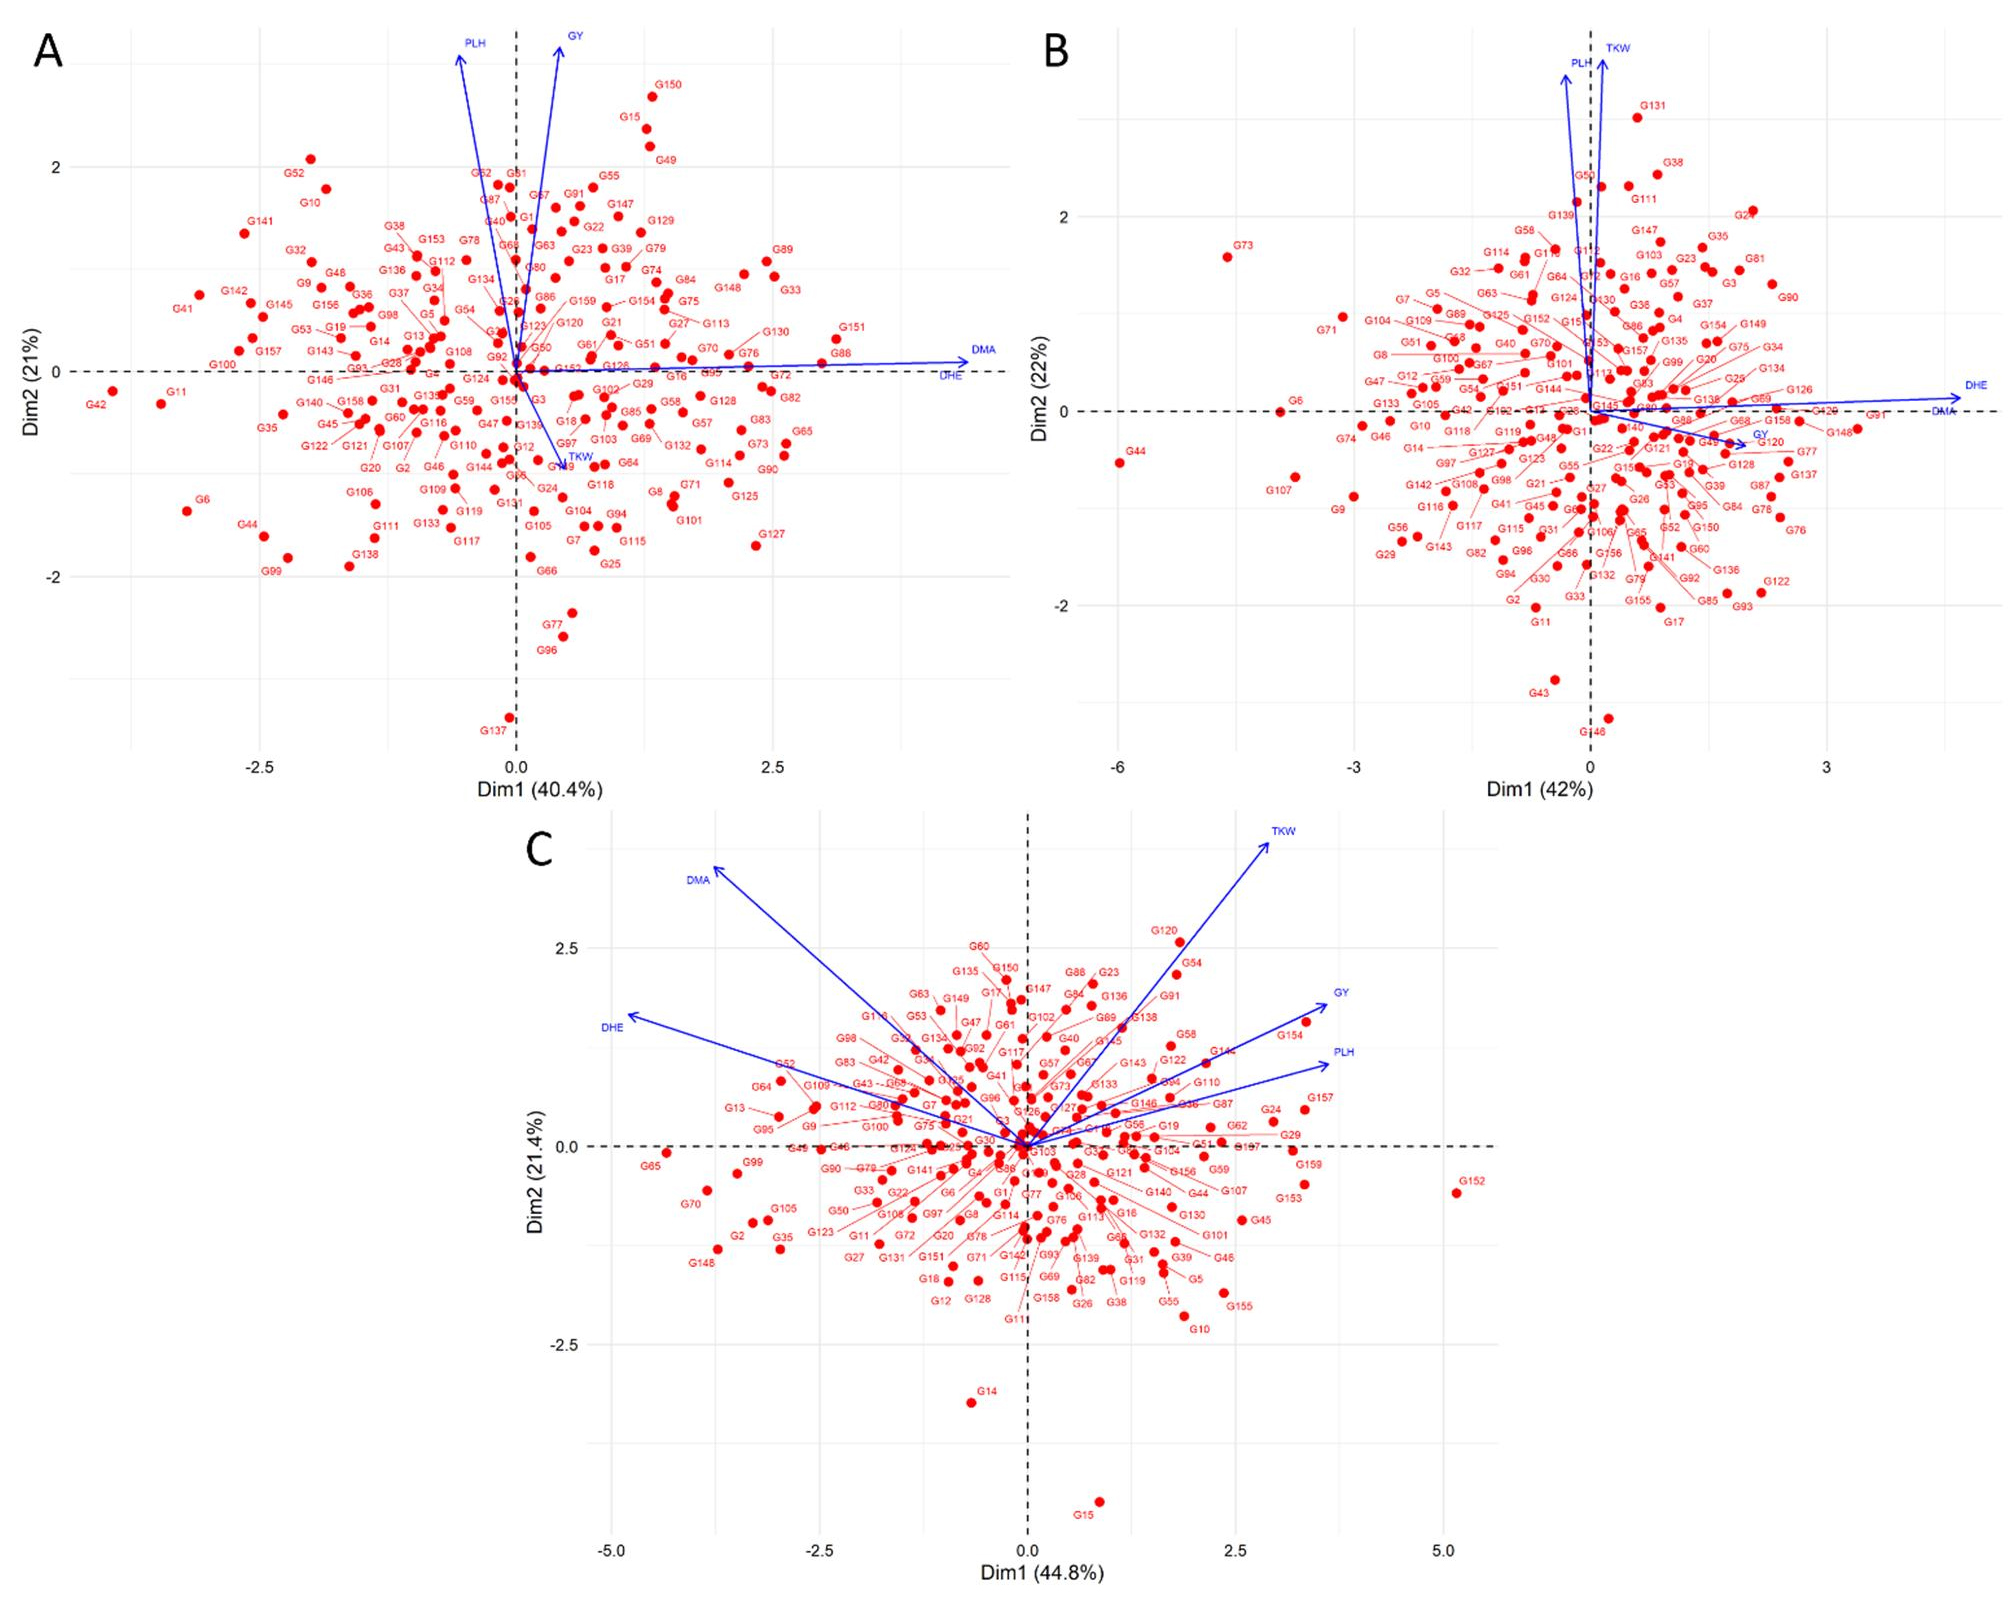 Figure 2. Biplot principal component analysis (PCA) of agronomic traits using 159 bread wheat genotypes under bed (A), flat (B) planting methods and, rainfed condition (C).
Table 2 provides detailed performance data for grain yield (GY) under raised bed and conventional flat cultivation methods as well as rainfed conditions for the top high-yielding genotypes. The raised bed cultivation technique produced higher yields than the flatbed method. Figure 3 illustrates the performance of the top genotypes under each cultivation method, underscoring the impact of raised bed cultivation in enhancing grain yield production. Of all the genotypes, the genotype G147 (PBW343/5/CROC-1/AE.SQUARROSA (205)//BORL95/3/PRL/SARA//TSI/VEE#5/4/FRET2/6/SANDALL-3) recorded the highest GY, with 11.4 tons/ha under raised beds, 10.9 tons/ha under flats, and 4.07 tons/ha under rainfed conditions. Followed by, genotype G91 (SOONOT-10/HUBARA-15) recorded the GY, with 10.4 tons/ha under beds, 9.7 tons/ha under flats, and 4.21 tons/ha under rainfed conditions.
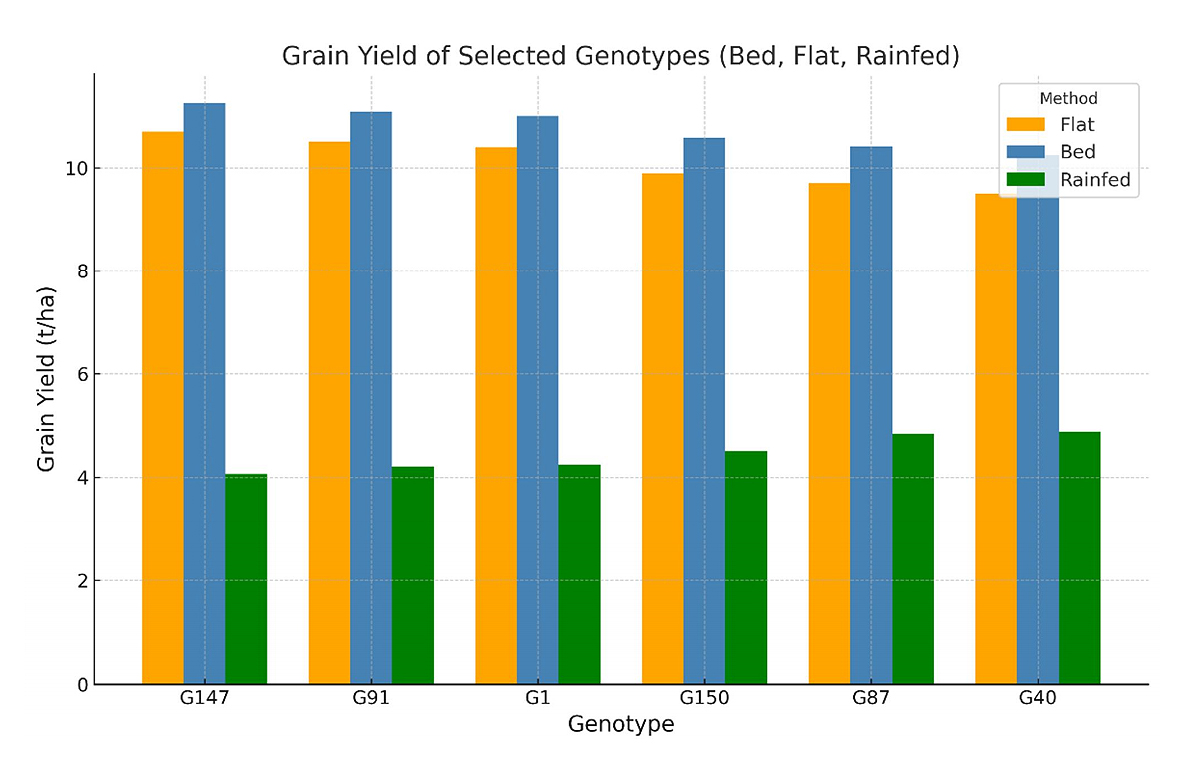 Figure 3. High yielding genotypes under raised bed, flat bed, and rainfed conditions.
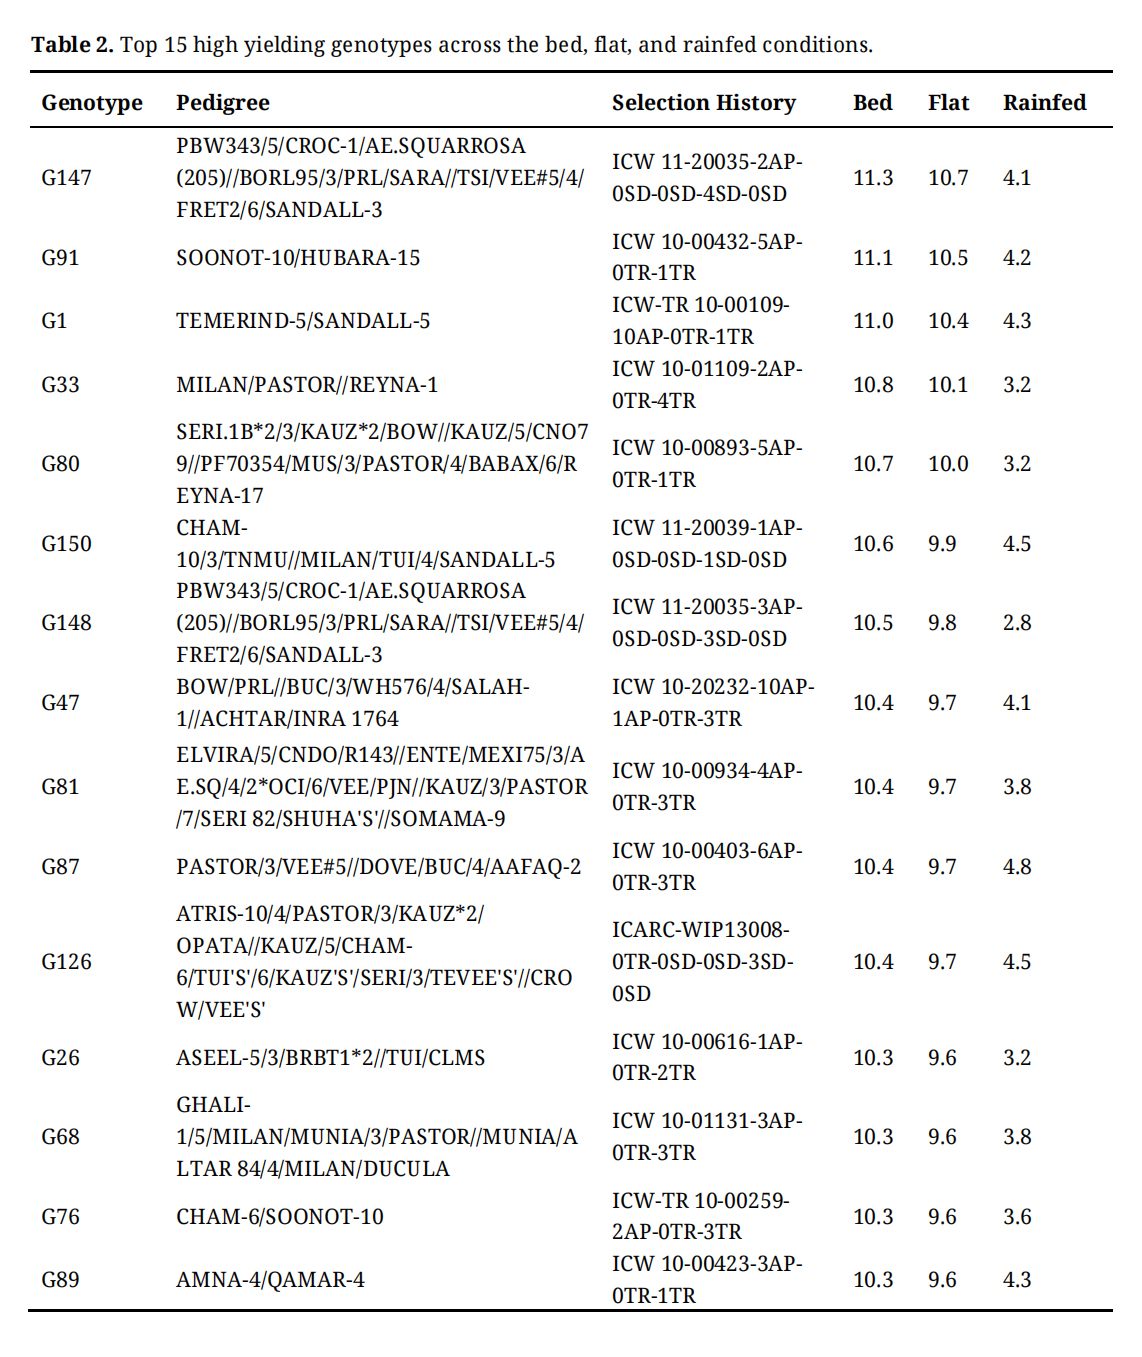 Table 2. Top 15 high yielding genotypes across the bed, flat, and rainfed conditions.
Figure 4 presents the Principal Component Analysis (PCA), Neighbor-Joining (NJ) tree, and kinship matrix of bread wheat genotypes based on genotypic data. Figure 4A displays the distribution of genotypes along the first two principal components (PC1 and PC2), which account for 47.24% and 17.66% of the total variation, respectively. The spread of genotypes across the plot highlights genetic diversity, with clustering patterns indicating varying degrees of relatedness. Figure 4B illustrates the NJ tree constructed from 159 bread wheat genotypes. The tree reveals three distinct subpopulations, visually separated by different colors, representing genetic groupings. This clustering reflects genetic similarities and evolutionary divergence among the genotypes. Figure 4C depicts the kinship matrix, providing insights into the genetic relatedness among genotypes. The diagonal (in green) represents self-relatedness, where each genotype shows the highest kinship with itself. Off-diagonal greenish regions indicate genotypes with closer genetic relationships, while yellow to red areas reflect lower kinship, signifying more distantly related genotypes. This visualization emphasizes the genetic structure and diversity within the population.
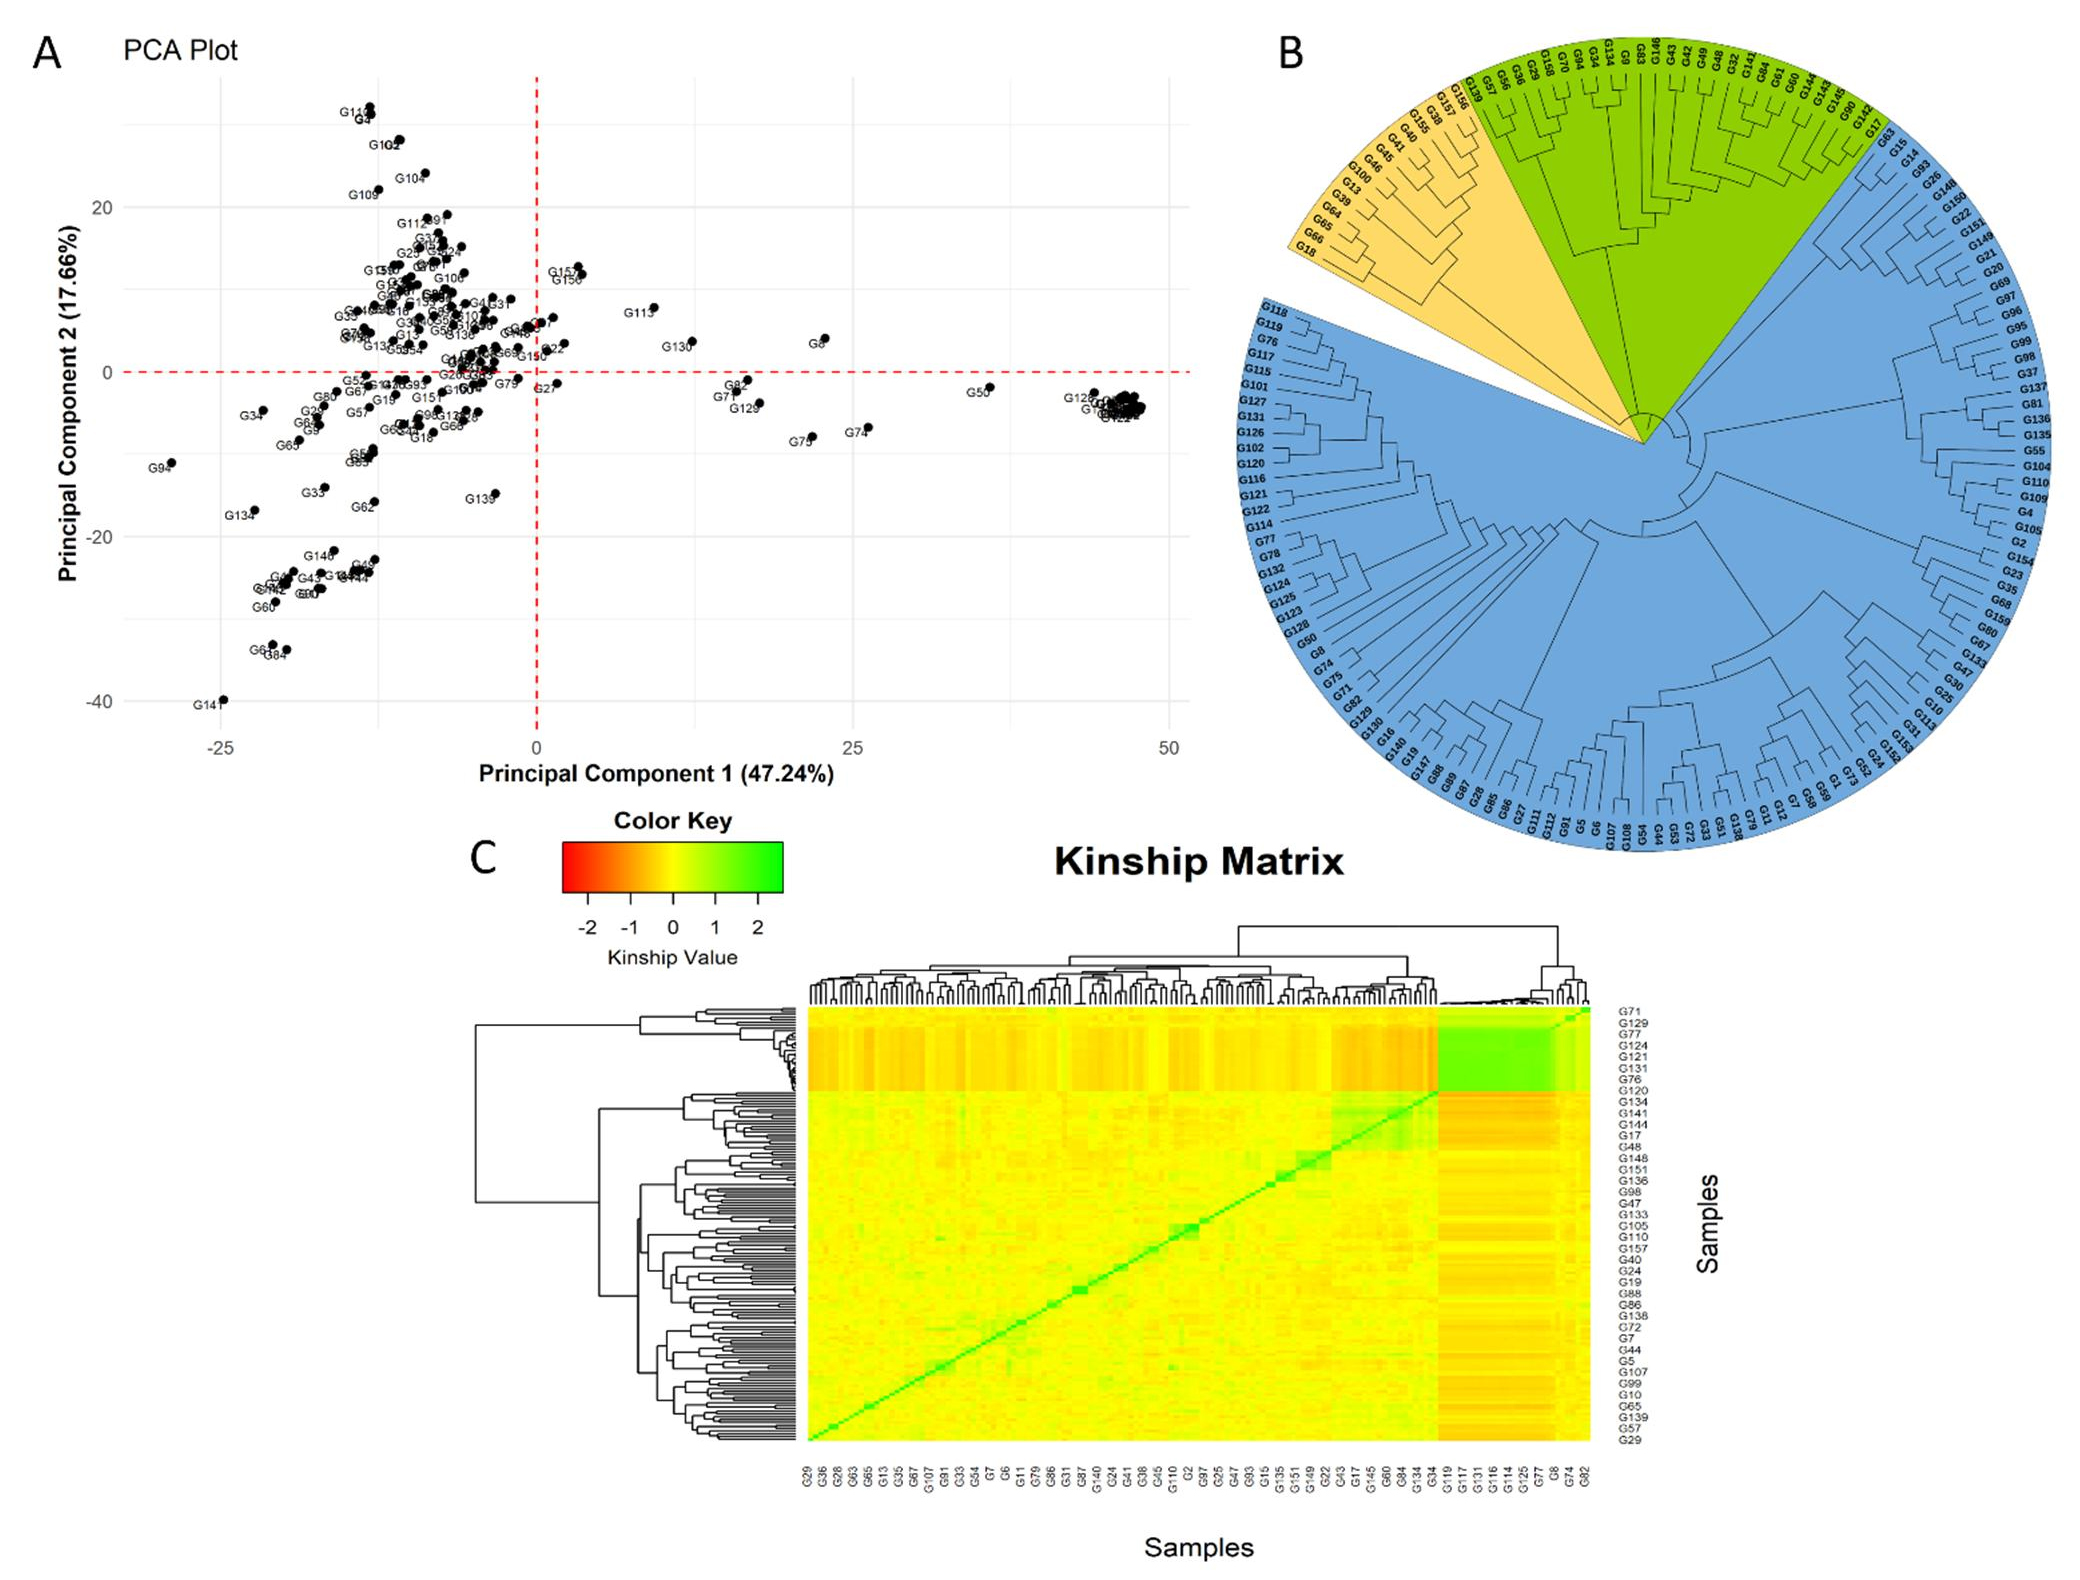 Figure 4. The Principal Component Analysis (A), Neighbor-Joining tree (B), and kinship matrix (C) of 159 bread wheat genotypes based on genotypic data.
Figure 5 illustrates the linkage disequilibrium (LD) analysis of SNP markers in 159 bread wheat genotypes. The left panel shows LD decay by chromosome, where the mean LD decay distance across the genome is 21.87 Mb, and the R² of LD for the whole genome was 0.20. The right panel presents the mean LD (R²) across 21 chromosomes. Chromosome 3B exhibits the highest mean LD value at 0.24, whereas chromosome 4D shows the lowest mean LD at 0.08.
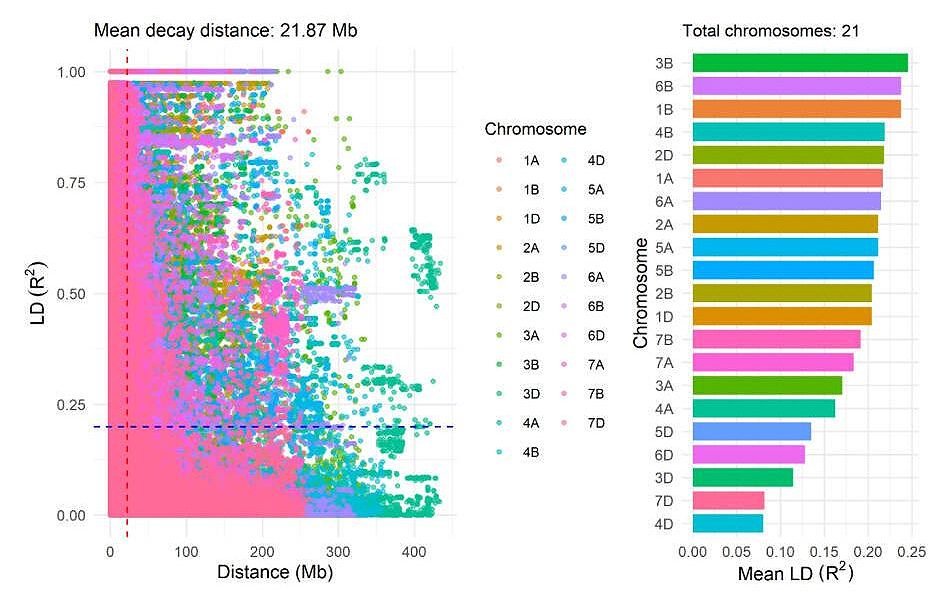 Figure 5. Linkage disequilibrium (LD) analysis of SNP markers in 159 bread wheat genotypes.
A total of 181 significant markers were associated with 5 agronomic traits under bed and flat planting methods as well as under rainfed conditions (Supplementary Table S1). The highest number of marker-trait associations (MTAs) was observed under bed conditions, with 72 significant MTAs, while 34 MTAs were recorded under flat conditions, where under rainfed conditions, 75 MTAs were recorded. Figure 6 displays the Manhattan plots for the 5 agronomic traits (DHE, DMA, PLH, TKW, and GY) under the three planting methods. The A genome exhibited the highest number of MTAs (106), followed by the B genome with 91 MTAs, and the D genome with 76 MTAs. Table 3 lists the significant markers associated with grain yield under bed and flat conditions. A total of 27 significant markers were linked to grain yield, with 26 MTAs identified under bed conditions and one under flat conditions. Among these, under bed conditions, the marker “RAC875_c51781_238” showed the highest significance with a −log10(p) = 4.00. This was followed by marker “AX-94704405” located on chromosome 6B at position 586.8 Mbp with a −log10(p) = 3.89. Conversely, marker “RAC875_c26469_480” on chromosome 2B at position 72.6 Mbp recorded the lowest significance with a −log10(p) = 3.05. Under flat conditions, a single significant marker, “BobWhite_c2937_1426”, was detected on chromosome 3B at position 739.4 Mbp, with a −log10(p) = 3.02. Under rainfed conditions, 15 significant markers associated with grain yield were distributed across chromosomes 2A, 2B, 5B, 6A, and 6D. The markers “AX-109853614”, “BS00070856_51”, and “AX-94841369” located on chromosome 6D recorded the highest −log10(p) with a value of 4.77. Figure 7 illustrates the distribution of significant MTAs across the 21 chromosomes in 159 bread wheat genotypes.
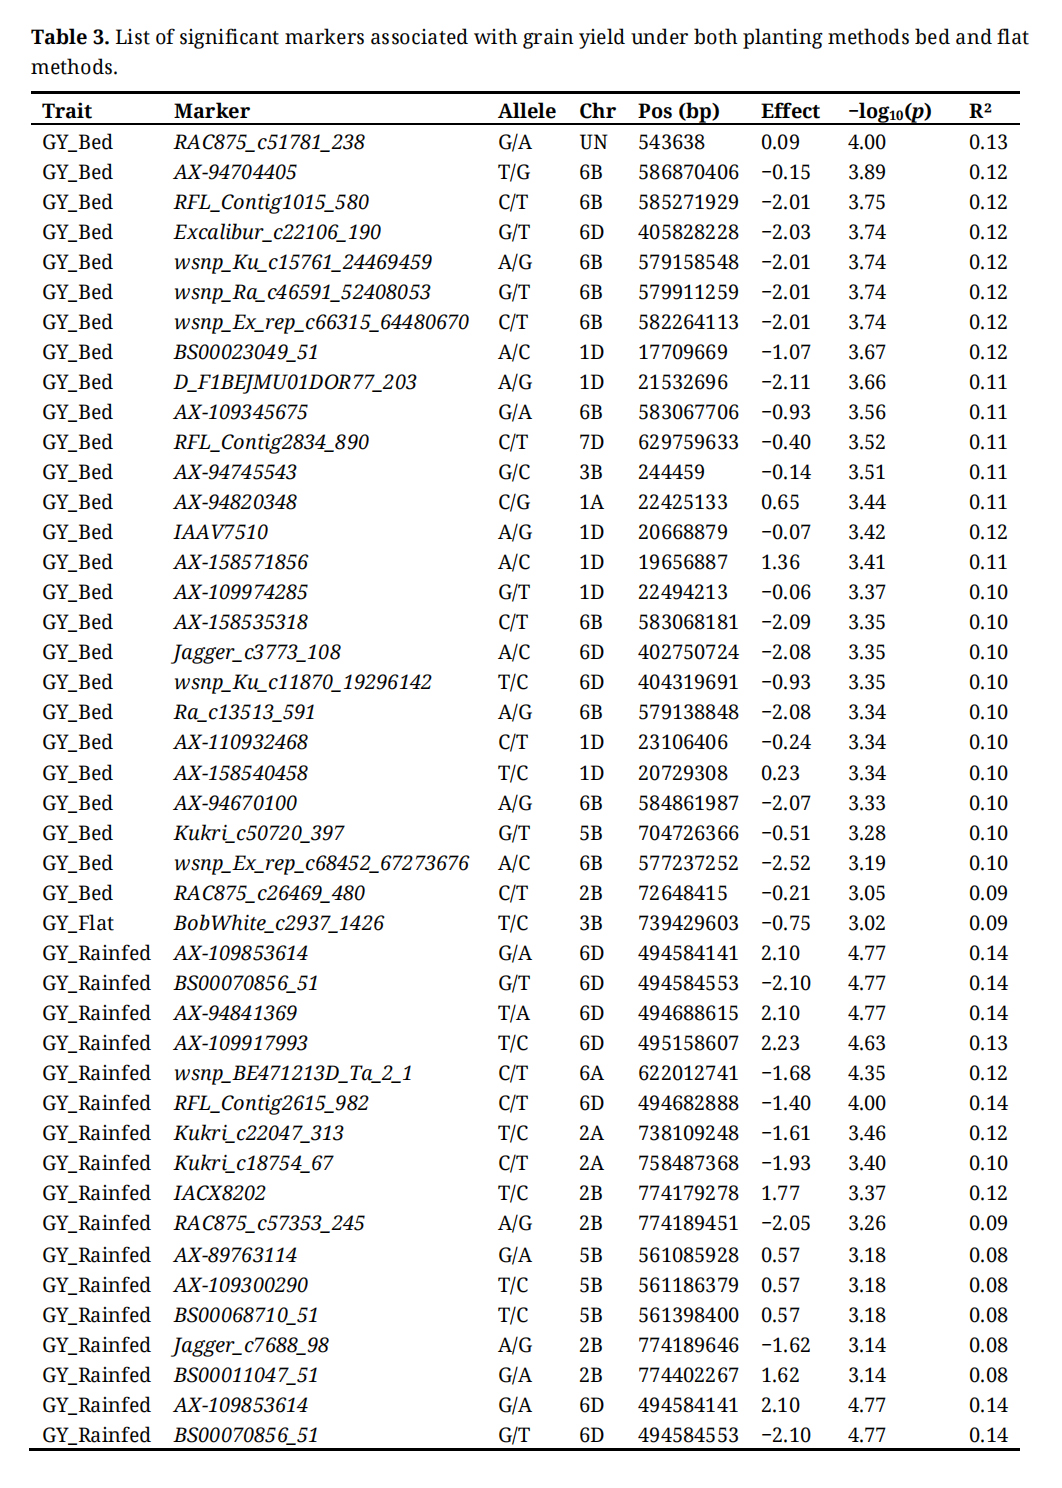 Table 3. List of significant markers associated with grain yield under both planting methods bed and flat methods.
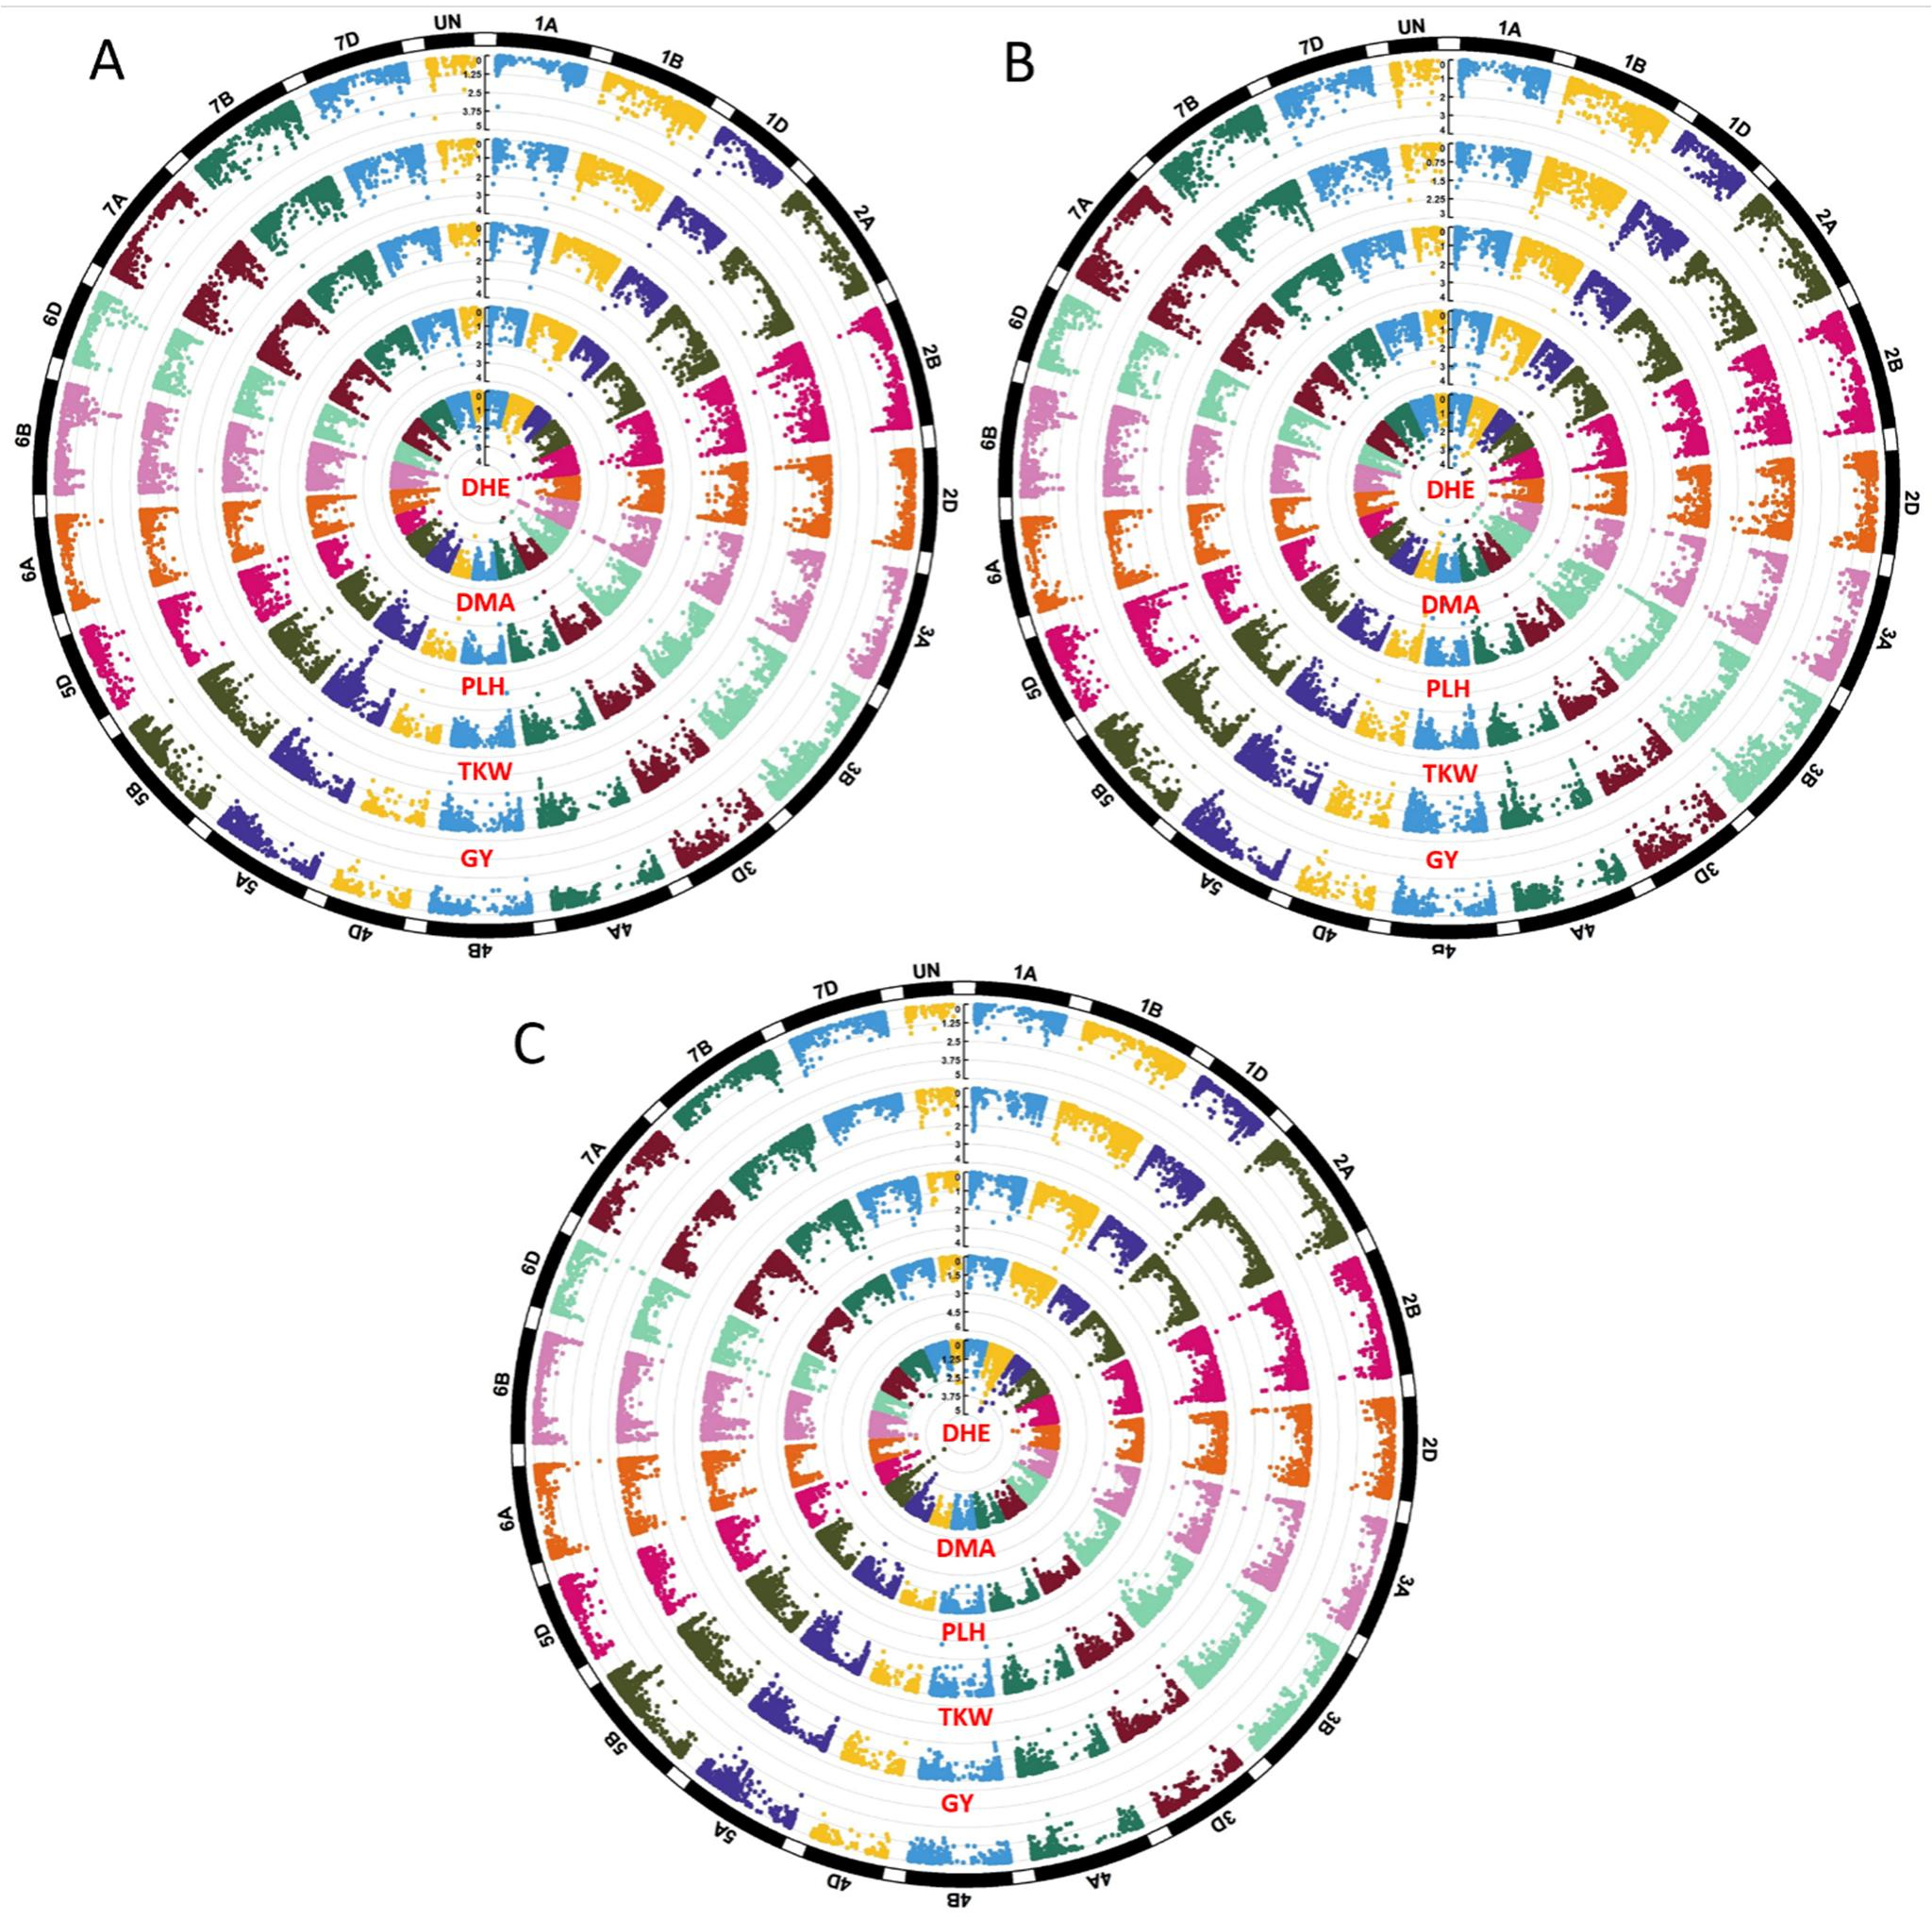 Figure 6. Manhattan plots of 5 agronomic traits under bed method (A), flat method (B), and rainfed condition (C).
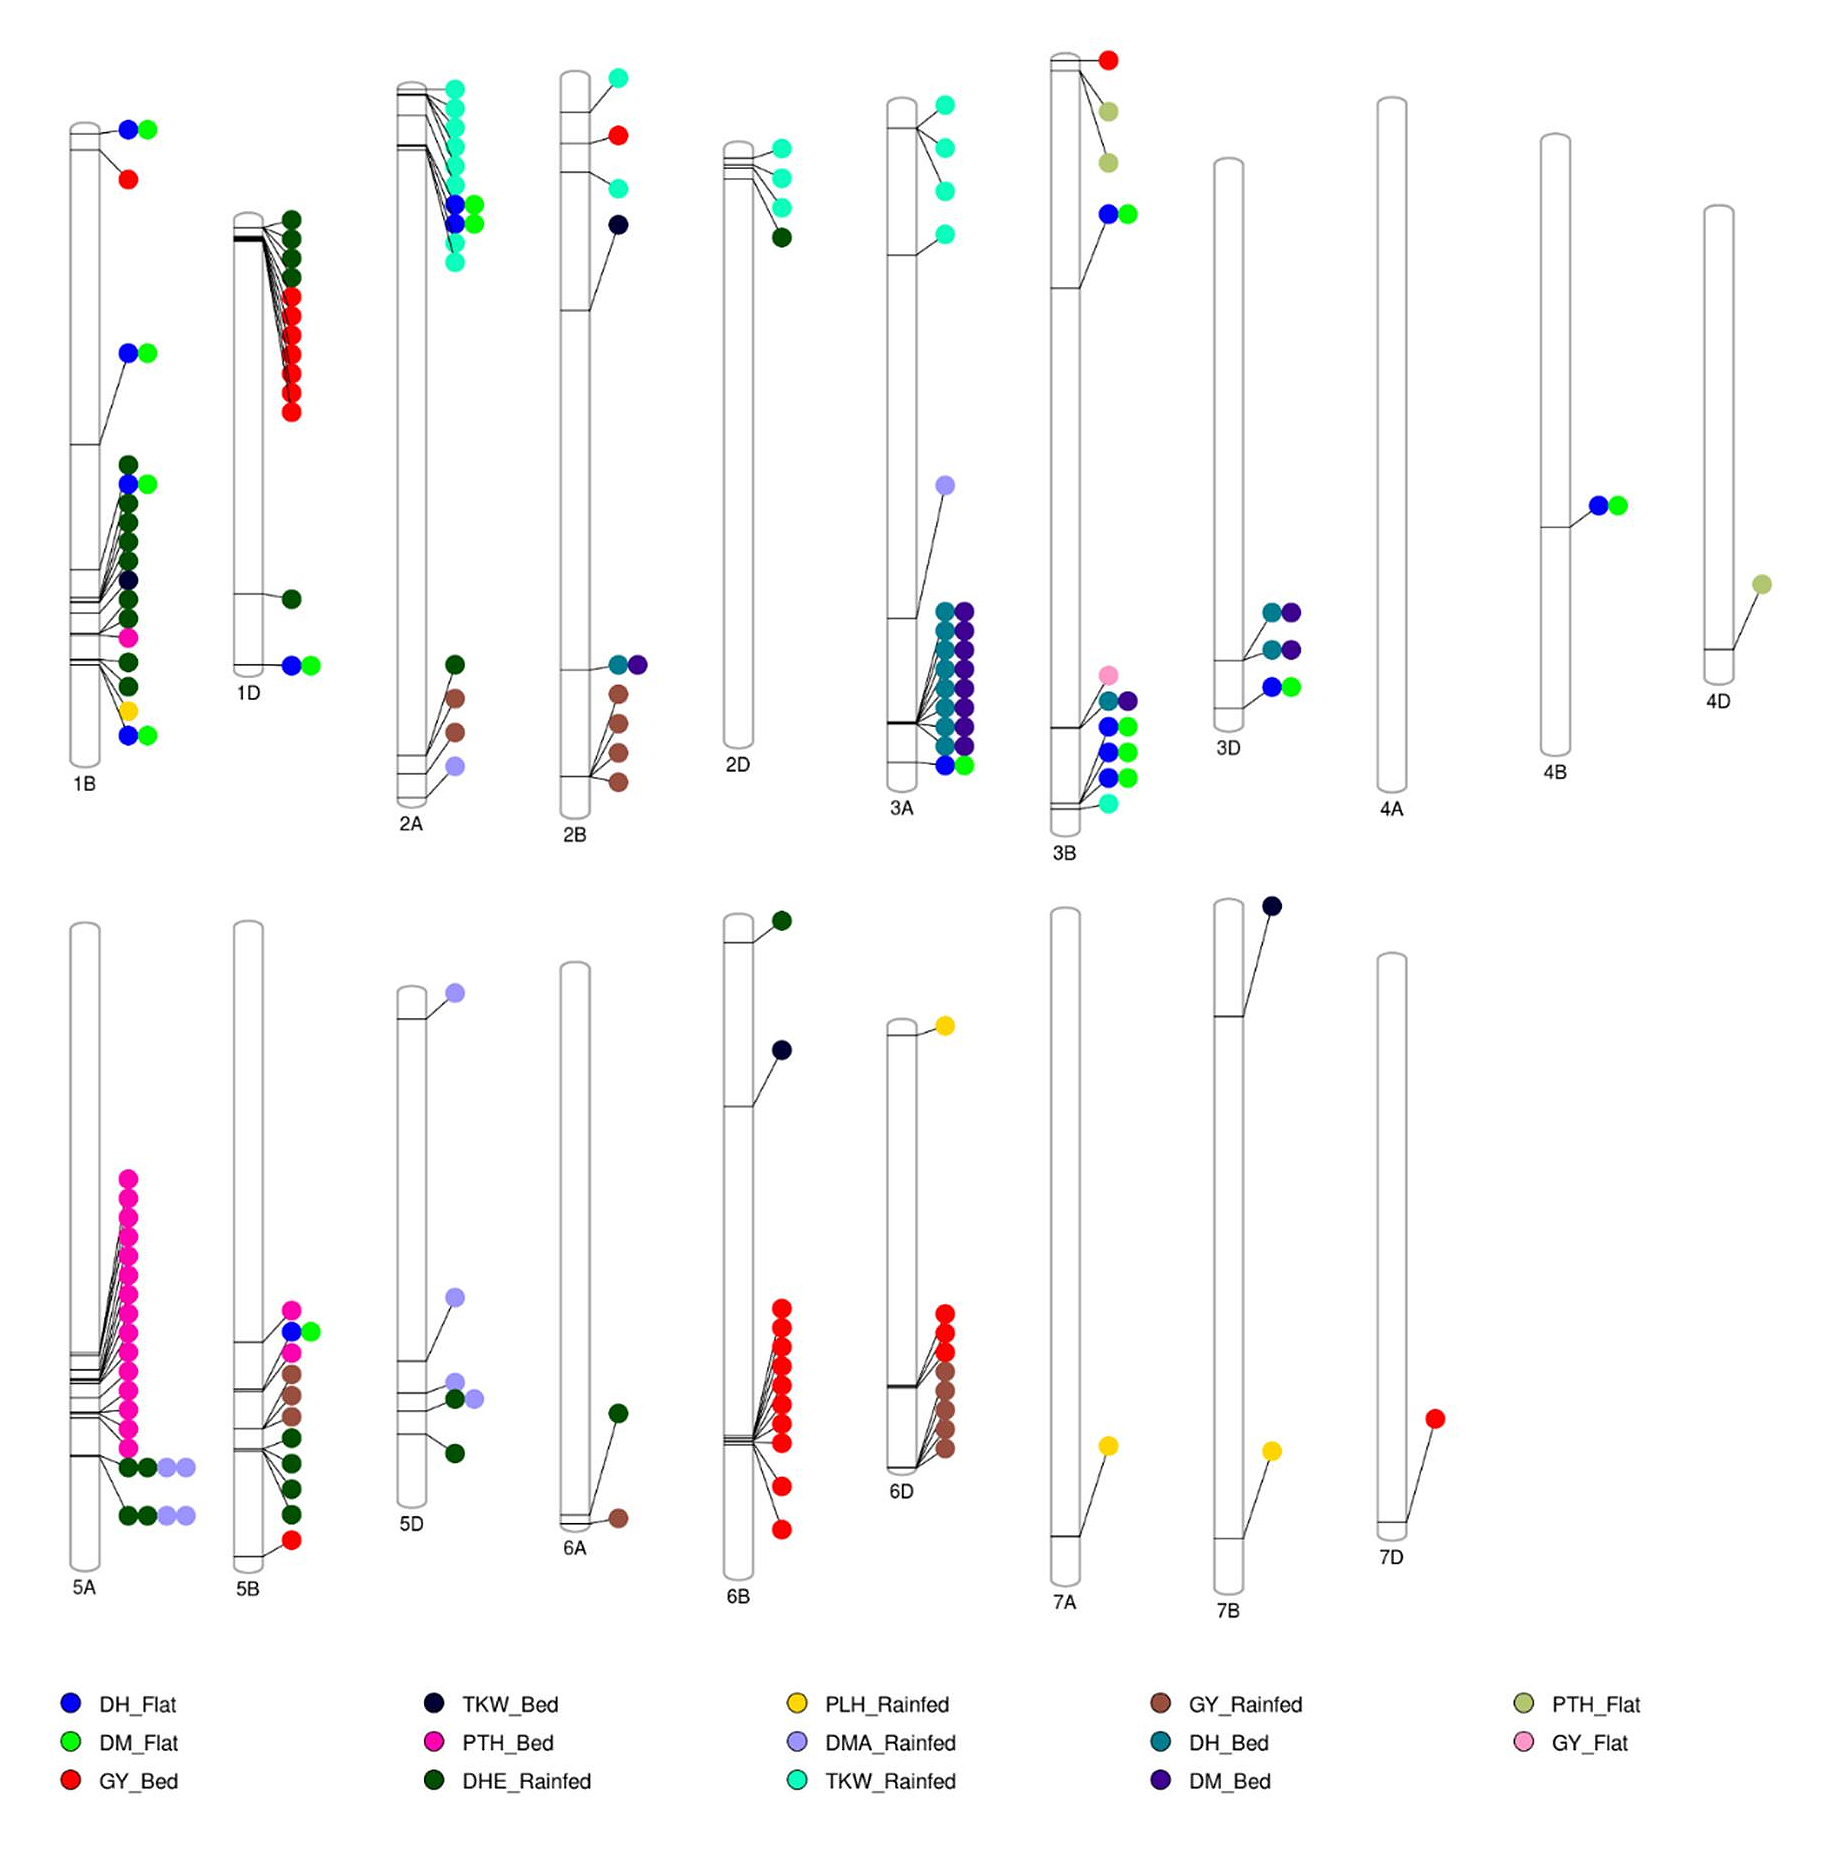 Figure 7. A total of 276 significant MTAs were identified for five agronomic traits—grain yield (GY), days to heading (DHE), days to maturity (DMA), plant height (PLH), and thousand kernel weight (TKW)—across raised bed, flat, and rainfed conditions, with the highest number observed under raised bed conditions.
Figure 8 illustrates the synergistic epistasis among significant MTAs. The marker “BS00067627_51” exhibited the highest synergy with marker “Kukri_rep_c110911_477”, with a multiplicative interaction effect strength of 57.06. This was followed by the interaction between markers “AX-158529536” and “Kukri_rep_c110911_477”, which had a strength of 55.47. The lowest synergy was observed between markers “wsnp_Ku_c11870_19296142” and “AX-94929534”, with an interaction effect strength of 0.0016. Whereas, the highest antagonistic SNP epistasis was recorded between markers “Kukri_c10377_112” and “Kukri_rep_c110911_477”, with a multiplicative interaction effect strength of −30.62.
Table 4 showcases the putative genes linked to some significant MTAs under bed and flat conditions. A total of 28 candidate genes were recorded as being associated with significant MTAs under the bed and flat conditions as well as under rainfed conditions, where 11 genes were recorded for bed conditions, 7 genes were recorded under flat conditions, and 10 putative genes were recorded under rainfed conditions. The gene “TraesCS3D02G437100” located on chromosome 3D, encodes for protein kinase domain-containing protein, which is involved in protein kinase activity and protein phosphorylation. The gene “TraesCS4D02G321900” located on chromosome 4D, encodes for AAA+ ATPase domain-containing protein, which is involved in ATP hydrolysis activity.
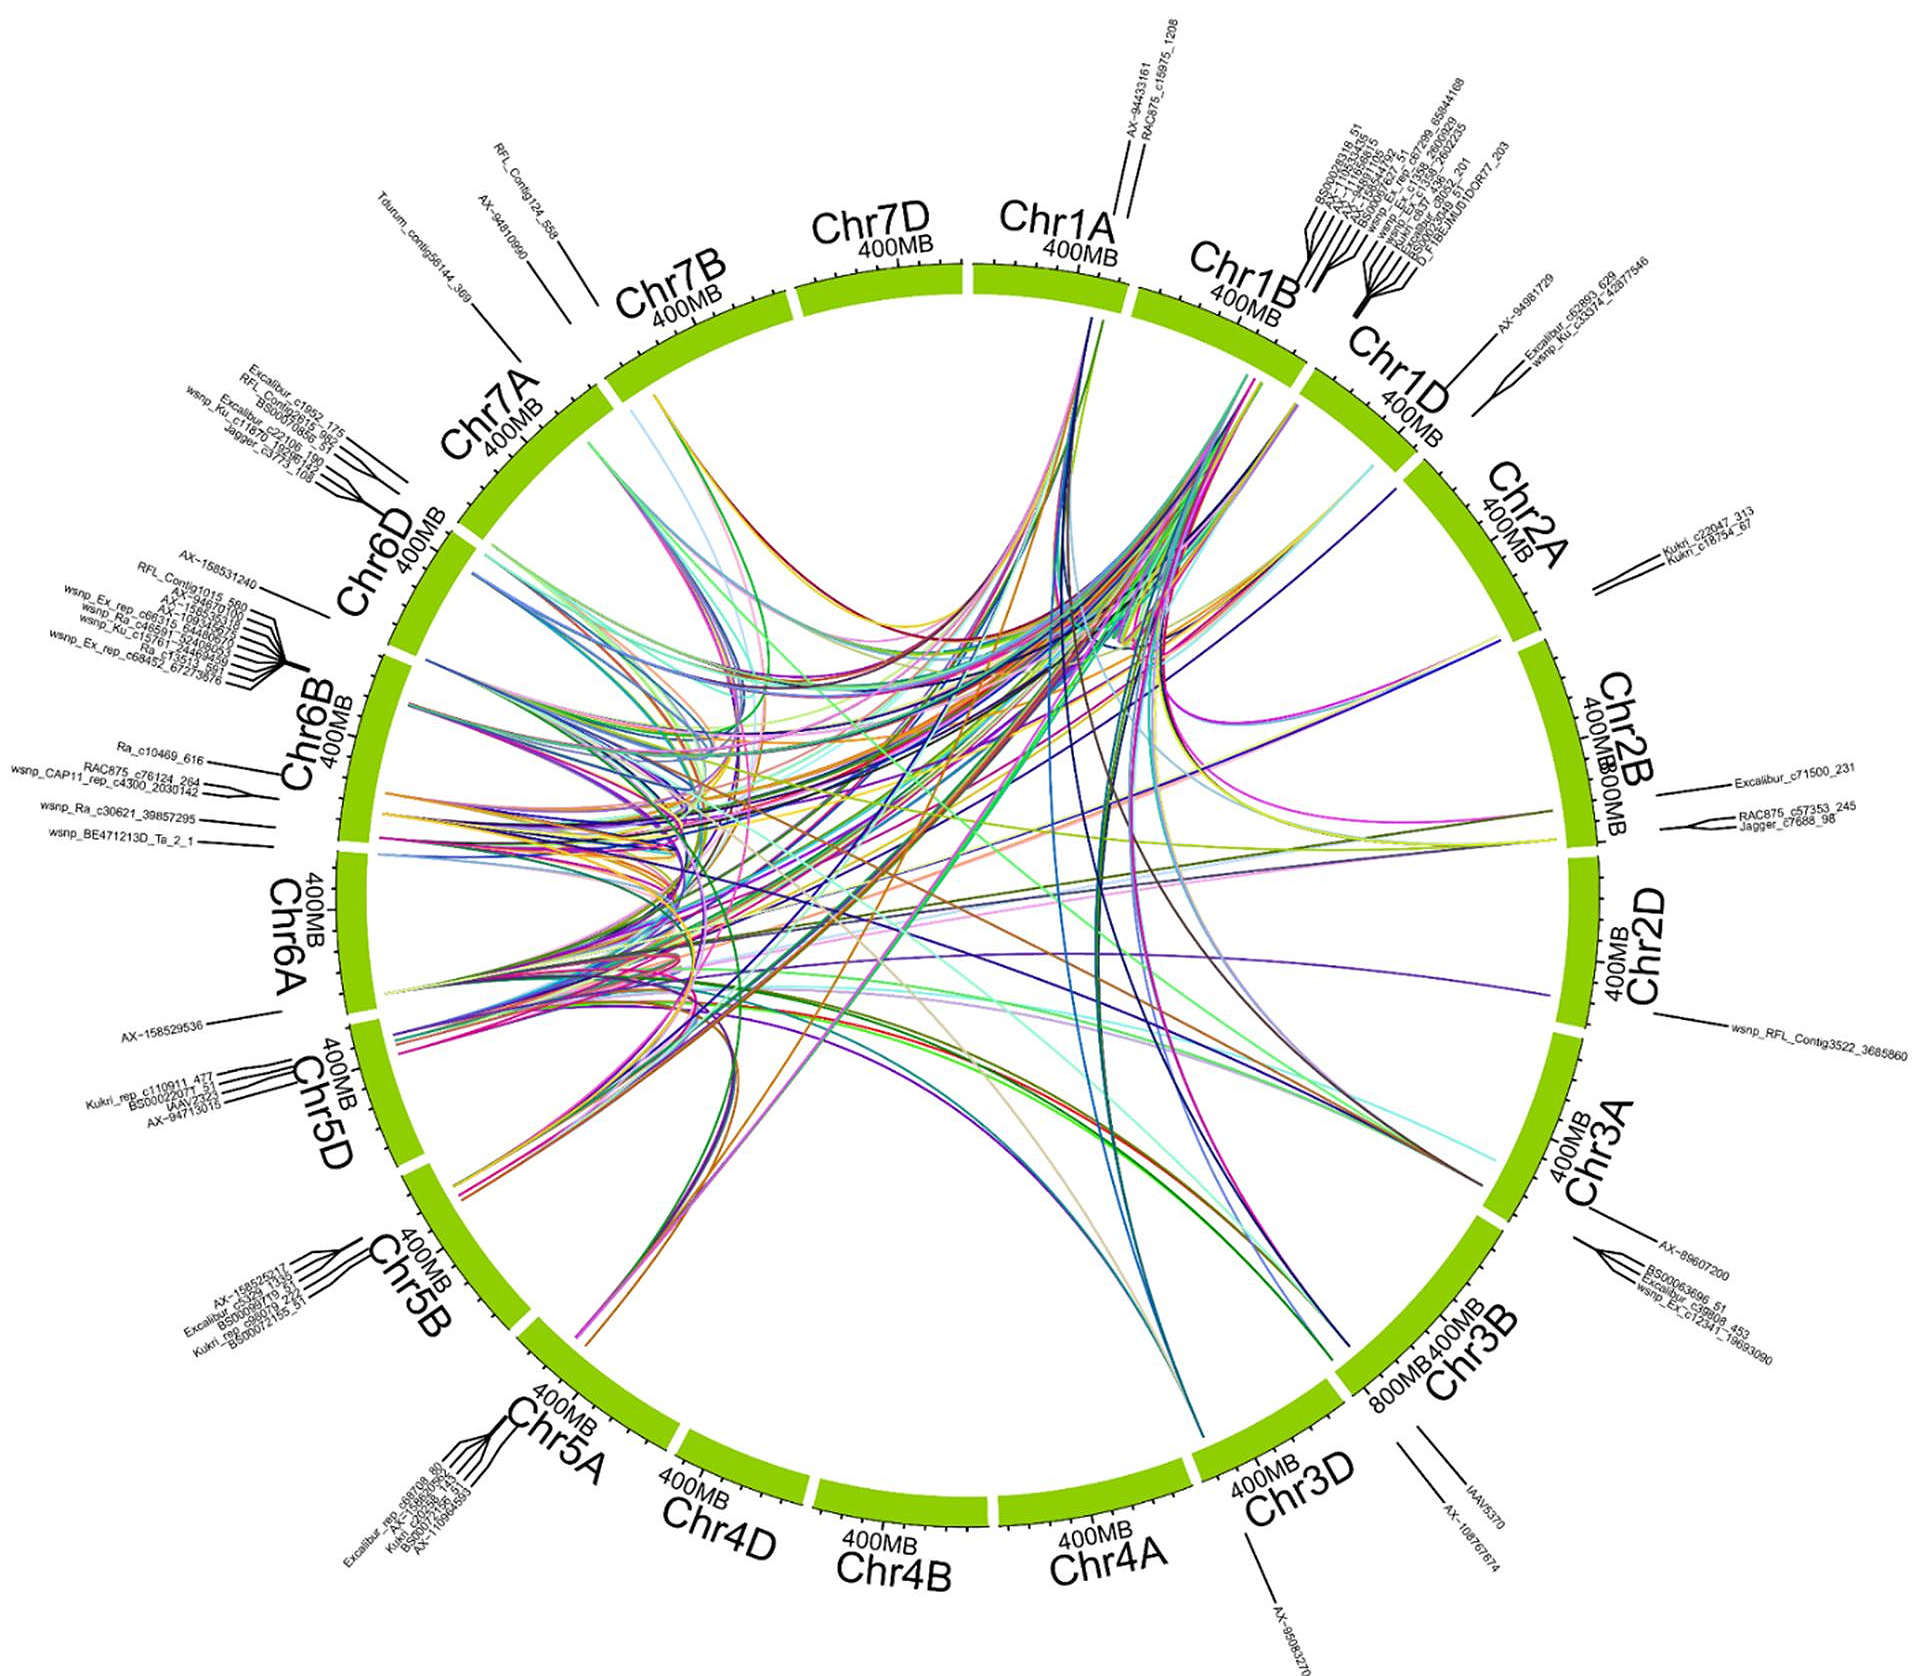 Figure 8. Epistatic interactions among significant markers were identified in the GWAS analysis. Colored lines indicate significant pairwise epistatic interactions between markers. Colors were used arbitrarily to differentiate interacting marker pairs visually and do not represent biological significance. Marker pairs were connected based on calculated interaction strength, considering only those with strong synergistic effects.
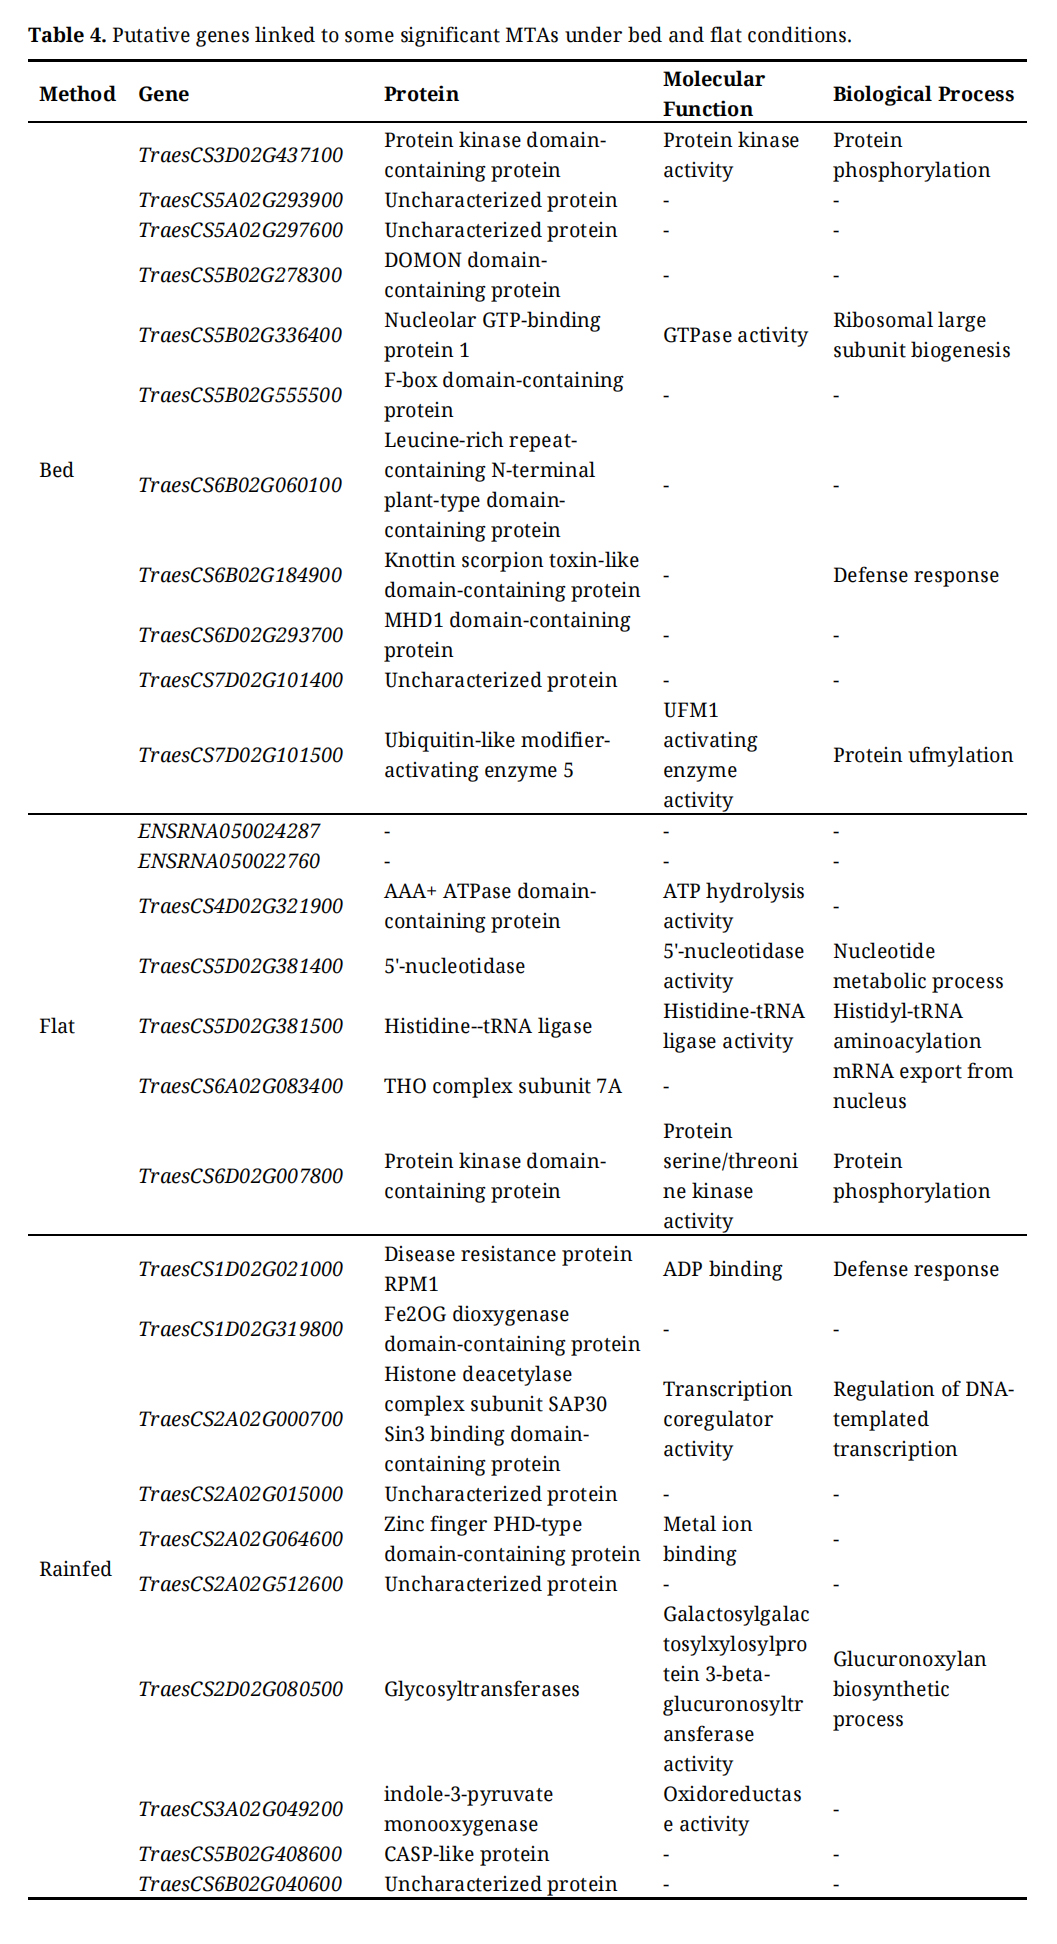 Table 4. Putative genes linked to some significant MTAs under bed and flat conditions.
The choice of planting method plays a critical role in determining wheat productivity, with significant implications for optimizing grain yield. In this study, the raised bed planting method demonstrated a notable positive impact on wheat grain yield compared to the flat planting method. The results revealed that bed planting consistently outperformed flat planting, yielding an increase of approximately +1 ton per hectare. This yield advantage underscores the efficiency of bed planting in improving resource utilization, such as water and nutrients, likely contributing to enhanced plant growth and development. Additionally, agronomic traits such as Days to Heading (DH) and Days to Maturity (DM) exhibited extended durations under bed planting conditions compared to flat planting. The increase in DH and DM under bed conditions suggests that the microenvironment created by the raised beds may have contributed to prolonged vegetative and reproductive growth phases, potentially supporting higher photosynthetic activity and grain-filling periods. This aligns with previous studies indicating that planting configurations influencing soil aeration, water retention, and root development can lead to improved phenological performance and overall productivity [20,21]. Furthermore, according to some reports [8], the adoption of mechanized raised bed (MRB) technology has resulted in increasing yield levels by 15%–25%; lowering seed cost by 50%, saving of irrigation water by 25% and lowering of labor costs. The findings highlight the potential of adopting bed planting as an effective agronomic practice for enhancing wheat yield in various production environments. Future research could further explore the physiological mechanisms underlying these yield differences and assess the long-term sustainability of bed planting under diverse climatic and soil conditions [22].
In Figure 2, the observed negative relationship between plant height (PLH) and thousand kernel weight (TKW) under raised bed conditions (panel A) suggests possible resource allocation trade-offs, where increased vegetative growth may limit grain-filling capacity. Conversely, the positive relationship observed under flat conditions (panel B) might indicate conditions favoring taller plants that could more effectively utilize available resources for grain filling, thus improving TKW. These contrasting results highlight the complex interactions between agronomic traits and environmental conditions.
Genome-wide association studies (GWAS) are powerful and widely used tools for identifying relationships between phenotypes and causal genetic variants within target populations. The versatility of GWAS allows for a broad range of applications, with the choice of models and interpretation of results largely driven by the specific objectives of each study [15,23]. In this study, our primary goal was to characterize marker-trait associations (MTAs) that could be applied to wheat breeding programs, particularly for enhancing grain yield and yield-related traits. By identifying these associations, we aim to facilitate the selection of high-yielding genotypes, ultimately contributing to the development of more productive and resilient wheat varieties.
Grain yield (GY) is highly influenced by environmental factors, making it challenging to select high-yielding lines in smaller plots during the early stages of breeding programs. Numerous studies have previously reported genes and loci associated with GY. In this study, GY associations were analyzed using a high-density physical map of wheat. As a complex quantitative trait, GY is significantly affected by environmental conditions [24]. The genetic architecture of GY is distributed across all 21 chromosomes of the wheat genome [25,26]. In our study, we found 27 significant markers associated with GY. These markers are located in chromosomes 1A, 1D, 2B, 3B, 5B, 6B, 6D and 7D, which are different from previous reports [27–29]. Accordingly, these MTAs could be potentially novel markers associated with GY, but need further validation.
In addition, to identify markers with broad adaptability, we compared grain yield-associated markers identified across raised bed, flat, and rainfed conditions. Our analysis did not reveal markers consistently significant across all three conditions, suggesting strong environmental specificity for grain yield. Importantly, we identified 15 markers uniquely associated with grain yield specifically under rainfed conditions: IACX8202, RFL_Contig2615_982, AX-109853614, AX-109300290, AX-94841369, BS00070856_51, BS00011047_51, AX-109917993, Kukri_c22047_313, wsnp_BE471213D_Ta_2_1, Jagger_c7688_98, AX-89763114, BS00068710_51, RAC875_c57353_245, and Kukri_c18754_67. These rainfed-specific markers are particularly relevant as they potentially indicate genomic regions related to drought tolerance mechanisms, representing valuable targets for breeding wheat varieties adapted to drought-prone environments.
In this study, we evaluated 159 bread wheat genotypes under two planting methods—bed, flat and rainfed—to identify markers linked to agronomic traits under each condition. The results revealed that bed planting had a significantly greater impact on yield and agronomic performance compared to flat planting and rainfed conditions. A total of 181 significant MTAs were identified under raised bed, flat and rainfed conditions, leading to the discovery of 28 putative genes. The highest-yielding genotypes were distributed across North Africa, West and Central Asia, and Sub-Saharan Africa. These genotypes could be released as new varieties following country-specific adaptation trials and also can be used as parents in future crossing programs to enhance wheat breeding efforts. The significant markers identified in this study will play a crucial role in marker-assisted selection (MAS), facilitating the development of new, high-performing wheat genotypes suited to diverse environments and production systems.
The following supplementary materials are available online at https://doi.org/10.20900/cbgg20250005, Supplementary Table S1: Significant markers associated with 5 agronomic traits under bed and flat planting methods as well as under rainfed conditions.
The dataset of the study is available from the authors upon reasonable request.
Conceptualization, RG and WT; Methodology, RG and WT; Software, ZEG and KES; Validation, WT, SEl, SEd and ST; Formal Analysis, ZEG; Investigation, RG; Resources, WT; Data Curation, ZEG; Writing—Original Draft Preparation, RG; Writing—Review & Editing, WT and ZEG; Visualization, ZK; Supervision, WT. All authors have read and agreed to the published version of the manuscript.
The authors declare that they have no conflict of interest.
We would like to thank the International Center for Agricultural Research in the Dry Areas (ICARDA) for funding and supporting this study.
1.
2.
3.
4.
5.
6.
7.
8.
9.
10.
11.
12.
13.
14.
15.
16.
17.
18.
19.
20.
21.
22.
23.
24.
25.
26.
27.
28.
29.
Gamal R, El Gataa Z, Thabet S, Khele Z, El-Shamaa K, Eltaher S, et al. Genetic Variation and Association Mapping Studies in Elite Spring Bread Wheat Genotypes for Yield and Other Agronomic Traits under Irrigated and Rainfed Environments. Crop Breed Genet Genom. 2025;7(2):e250005. https://doi.org/10.20900/cbgg20250005.

Copyright © Hapres Co., Ltd. Privacy Policy | Terms and Conditions