Location: Home >> Detail
Crop Breed Genet Genom. 2025;7(2):e250006. https://doi.org/10.20900/cbgg20250006
 ,
Gina Brown-Guedira 2 ,
Maggie Gillum 1 ,
Krista Jacobsen 3 ,
Tim Phillips 1 ,
David Van Sanford 1,*
,
Gina Brown-Guedira 2 ,
Maggie Gillum 1 ,
Krista Jacobsen 3 ,
Tim Phillips 1 ,
David Van Sanford 1,*
1 Department of Plant and Soil Sciences, University of Kentucky, Lexington, KY 40504, USA
2 USDA-ARS, Department of Crop and Soil Sciences, University of North Carolina, Raleigh, NC 27695, USA
3 Department of Horticulture, University of Kentucky, Lexington, KY 40504, USA
* Correspondence: David Van Sanford.
Fusarium Head Blight (FHB) is an economically devastating disease of wheat (Triticum aestivum L.) causing low yields and poor quality. FHB, caused by Fusarium graminearum, disrupts the grain filling phase and results in bleached spikes and shriveled seeds. Deoxynivalenol (DON) is a mycotoxin produced by the fungal pathogen when it infects the plant; DON is harmful when consumed by humans and causes feed rejection in livestock. Using FHB resistant varieties and timely applications of fungicides is the optimum strategy for management of this disease. However, there has been little research focusing on the impact of FHB resistance genes on wheat yield, flavor, and baking quality. This study involved two populations, both created from a three-way cross between parents containing either FHB resistance genes, desirable characteristics (strong gluten, high yield, etc.), or both. From each of these populations, 120 lines were derived and have been evaluated for presence of FHB resistance genes. Using two years of agronomic data, genotyping calls, quality measurements and flavor assessment, we found that various combinations of resistance genes have a strong effect on important agronomic and quality traits. Significantly (p < 0.05) reduced DON levels were observed in lines with three resistance genes. An intermediate heritability estimate (h2 = 0.43) indicates breeding for flavor intensity is possible, highly influenced by combinations of resistance genes and moderately correlated (r = 0.48; p < 0.05) with positive flavor preferences. These findings will improve breeding efforts for FHB resistance breeding of wheat while maintaining acceptable yield and flavor.
1A_N, 1A Neuse; 1B_J, 1B Jamestown; 3B_M, 3B Massey, 4A_N, 4A Neuse; ANOVA, Analysis of Variance; DON, Deoxynivalenol; FHB, Fusarium Head Blight; GLM, General Linear Model; h2, broad sense heritability; KASP, Kompetitive Allele Specific Polymerase chain reaction; NIR, Near Infrared; PCR, Polymerase Chain Reaction; QTL, Quantitative Trait Loci; RF, Random Forest; SDS, Sodium Dodecyl Sulfate; SNP, Single Nucleotide Polymorphism; SRW, Soft Red Winter
Wheat (Triticum aestivum L.), the most widely consumed crop across the globe, is susceptible to Fusarium graminearum, a fungus that is the primary cause of Fusarium Head Blight (FHB), also known as scab. FHB is an economically devastating disease of grain crops causing low yields and poor quality. Scab infection results in bleached spikes and shriveled seeds caused by a disruption during the grain filling stage of wheat. The grains resulting from this disruption are light and discolored and are referred to as tombstone seeds. Infected grain can contain deoxynivalenol (DON), a mycotoxin produced by F. graminearum that causes vomiting, nausea, headaches, and fatigue when consumed by humans [1]. When consumed by animals, DON consumption causes feed rejection resulting in weight loss [2]. Additionally, infected grain has low test weight which, along with possible DON contamination, makes the grain far less valuable to the farmer than healthy grain.
Kentucky provides optimal environmental conditions for Fusarium to thrive since the weather is warm, wet, and humid [3]. Further, most Kentucky wheat is planted directly into corn (Zea mays L.) residue with little or no tillage; corn harbors the sexual stage of F. graminearum and thus the Kentucky wheat crop is always at risk for FHB [4]. Although Kentucky weather conditions are generally conducive to FHB infection, we used an artificially inoculated, mist-irrigated scab nursery to maximize the likelihood of an FHB epidemic. The grower’s most effective FHB management strategy is to use a combination of timely fungicide application and FHB resistant varieties [5–7]. However, there has been little research focused on the effects of FHB resistance genes on wheat yield, quality, and flavor. The effects of common FHB resistance genes are important to consider when breeding for FHB resistance as there could be adverse effects on agronomic and baking performance. The genes we studied are commonly used in soft red winter (SRW) wheat breeding programs: Fhb1, 1A Neuse, 4A Neuse, 1B Jamestown, and 3B Massey. Several studies show the effectiveness of these specific resistance genes on FHB symptoms [8–13]. However, not much is known about their effects on wheat productivity and end-use characteristics.
Varieties with Fhb1 have been shown to produce similar yields when compared with lines that did not have Fhb1 [10,14–18]. Salameh et al. (2010) found that there was no significant effect of FHB resistance QTL on agronomic or quality traits but that the genes did confer resistance in the presence of the pathogen. When pyramided with Fhb4 and Fhb5, Fhb1 has no impact on yield compared to parent lines that had those genes [19]. Clark et al. (2016) found that there was little difference between Fhb1 lines and non-Fhb1 lines and that Fhb1 lines performed slightly better than check cultivars for some milling and baking qualities. Fhb1 was shown to be more effective than Fhb2 and Fhb5 in single floret inoculation but when pyramided, the combination of these genes was the most effective [8]. Peterson et al. (2016) mapped 1A Neuse and found that it was effective in multiple locations for reducing FHB incidence, severity, FDK, and DON. The same group also mapped 4A Neuse and found that it decreased FDK in multiple environments and showed correlation with DON resistance. The SRW cultivar Jamestown [9] was studied by Wright et al. (2014) who discovered a scab resistant QTL termed 1B Jamestown that was associated with lower severity and lower DON accumulation. Similarly, the QTL termed 3B Massey was identified and showed lower FHB severity [11]. Like Fhb1, these other resistance genes are associated with Type II resistance. However, the molecular mechanisms underpinning the effects of these QTL are not clear and epistatic interactions between these QTL are not known.
The effects of Fhb1 on yield and baking quality have suggested that Fhb1 is an excellent gene to incorporate into wheat breeding programs since it has no proven yield drag or negative impact on baking quality traits [10,14,20]. However, it is unknown how the other previously mentioned FHB resistance genes and different combinations of them affect agronomic fitness and end use quality. The answer to this would inform breeders as to which combinations of FHB resistance genes could be deployed without adversely affecting important agronomic and end-use traits. This information could be used with genomic predictions to select the best lines with optimal FHB resistance combinations.
The objectives of this study were to: (1) identify the scab resistance genes present in the experimental material, (2) quantify the effects of these genes on agronomic traits, baking quality and flavor, (3) determine the most ideal to least ideal combinations of resistance genes, (4) estimate heritability of the traits of interest in the two populations.
The two populations in this study will be referred to as the yield population and the quality population. Table 1 shows the parents and QTL or traits associated with them. The yield population was created by crossing ‘Pembroke 2021’ [21], with X11-0039-1-2-5, University of Kentucky (UK) breeding line. A top-cross was then made with KY06C-1178-16-10-3-34, another UK breeding line. The parents for the yield population were chosen because they are high yielding lines that have several scab resistance genes. Pembroke 2021 has 1A and 4A Neuse, 1B Jamestown, and 3B Massey. X11-0039-1-2-5 has 1A and 4A Neuse and 3B Massey, while KY06C-1178-16-10-3-34 has Fhb1. The resulting F2 should contain these resistance genes, assuming no genetic drift due to sample size. The quality population was created by crossing Pembroke 2021 with ‘Pembroke 2014’ [22], both are released cultivars from the UK breeding program. A top-cross was then made with SRW wheat ‘Catawba’ (not formally registered at this time). The parents for this population were chosen based on baking quality and scab resistance genes. Pembroke 2021 has 5+10 high molecular weight glutenin subunits, 1A and 4A Neuse, 1B Jamestown, and 3B Massey. Pembroke 2014 has Fhb1 and strong gluten characteristics, based on previous unpublished research. Catawba has been shown to have excellent flavor (Dr. David Marshall, personal communication, 2018), but little, if any scab resistance.
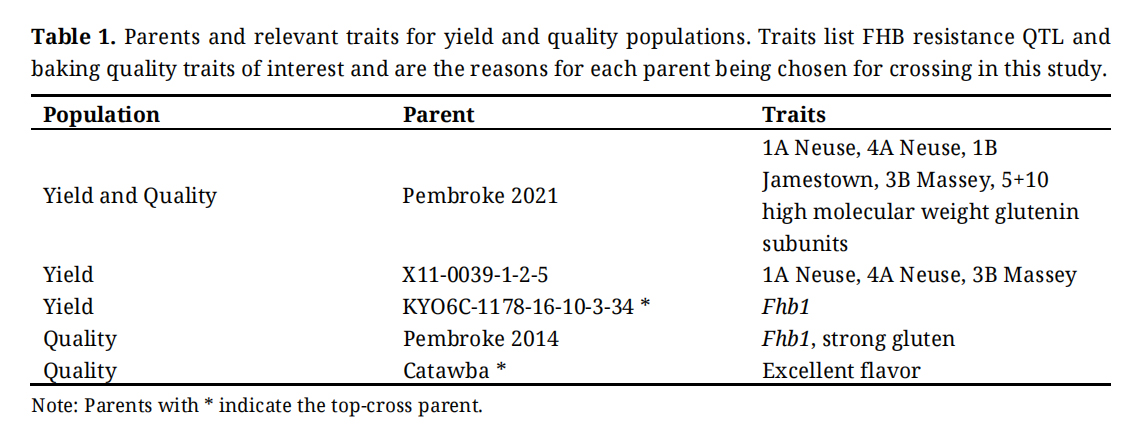 Table 1. Parents and relevant traits for yield and quality populations. Traits list FHB resistance QTL and baking quality traits of interest and are the reasons for each parent being chosen for crossing in this study.
Kompetitive Allele Specific Polymerase Chain Reaction (KASP) assay is a PCR based genotyping technique. KASP assays were used in the present study to determine the genotype of each F2:4 sample for the Single Nucleotide Polymorphisms (SNPs) corresponding to the following genes: 1A Neuse, 1B Jamestown, 3B Massey, 4A Neuse, and Fhb1. Prior to KASP, DNA for each line was extracted using Qiagen DNeasy Plant Mini Kit protocol and equipment. KASP was executed using mastermix, assay mix, and extracted DNA. Mastermix is the solution that contains everything needed to run a PCR while the assay mix is a primer mixture including the forward, reverse, and common primer for the gene of interest. The mastermix and assay mix are mixed to create the genotyping mix. The genotyping mix and DNA are added to a 96 well plate at a 1:1 ratio and placed into the Lightcycler 96 PCR machine where up to 60 rounds of PCR are executed and a data point is obtained for each sample per cycle. The final output of KASP is a graph showing up to 3 clusters to determine the genotype of each sample for the primer that was run. For each assay, a parent known to have the gene of interest and another that is known to lack it are used to help verify the cluster designations. Samples that cluster with the parent containing the gene are called homozygous positive, meaning that they are homozygous for the resistance alleles at the QTL, while those that cluster with the parent not containing those alleles are called homozygous negative. Any samples that cluster distinctively between the groups are called heterozygous.
Planting Sequence and MethodsFall 2021: The bulk F2 populations were planted in October 2021 at Spindletop Farm (Lexington, KY38°08.03', −84°29.64'; Maury silt loam—fine, mixed, active, mesic Typic Paleudalf) using space planting that was achieved by mixing dead, autoclaved barley (Hordeum vulgare L.) seeds with the F2 seeds for individual wheat plants to be easily identified. In normal solid-seeded wheat plantings it can be impossible to determine separate plants from tillers on the same plant.
Summer 2022: A sample of 150 plants was randomly selected from each of the F2 populations. These plants were pulled from the soil and separated to ensure only seed was harvested from individual plants. Heads were harvested from individual plants and placed into single envelopes so that all progeny rows could be traced back to single plants.
Fall 2022: The heads harvested from individual plants were threshed using a headrow thresher; seeds from six heads from each individual plant were used to plant mini-plots (six rows 15 cm apart and 1.2 m long) at Spindletop Farm. An augmented design was created by alternating planting of two of the parents from the initial three-way cross every five mini-plots, these parents serving as replicated checks. The checks used for the yield population were KY06C-1178-16-10-3-34 and Pembroke 2021, while the checks used for the quality population were Pembroke 2014 and Pembroke 2021.
Summer 2023: Mini-plots for the yield and quality populations were combine-harvested and bulked by mini-plot.
Fall 2023: A selection of 120 F2:3 lines from each population was planted in a two-location randomized complete block design with two replications. The two locations were Spindletop Farm and the University of Kentucky Research and Education Center (Princeton, KY; 37°05.89', −87°51.62'; Crider silt loam—fine-silty, mixed, mesic Typic Paleudalf).
These 120 lines were selected for each population on the basis of having sufficient seed for four replications; the same checks that were used for planting in 2022 per population were used in the 2023 planting. In addition, a smaller set of lines from the yield population was selected by taking the highest ten and lowest ten lines based on genomic prediction values
of DON obtained from genotyping by sequencing carried out on DNA
from F2:3 plants at the USDA-ARS Eastern Regional Small Grains Genotyping Laboratory in Raleigh, North Carolina (https://www.ars.usda.gov/southeast-area/raleigh-nc/plant-science-research/docs/small-grains-genotyping-laboratory/main/; verified 01 May 2025). The predictions of specific QTL [30] were achieved using the methods of Winn et al. (2022). This DON study was planted in a two-replication randomized complete block design at both Lexington and Princeton. The main study involving 120 lines was also planted in a two replications randomized complete block design in the scab nursery.
Summer 2024: All plots in Lexington were combine-harvested and grain was saved. The DON study in Princeton was combine-harvested and grain was saved. The larger studies at Princeton were combined only for data with no grain saved. For the remainder of the experimental material in the scab nursery, a large handful of heads was hand-sickled and threshed.
Scab NurseryFHB epidemic conditions are met by planting wheat in an overhead misted environment and introducing Fusarium by corn kernel inoculum. The misting was set to run for 15 minutes intervals from time of heading to maturity four times a day (0130, 0330, 0500, and 1630). In 2024, the scab nursery was artificially inoculated with infected corn which was inoculated with Fusarium graminearum collected from infected tissue across Kentucky. About 24 strains of F. graminearum were used to inoculate the corn [23].
Seven days before inoculating corn, potato dextrose agar (PDA) plates were made and spores of eight different Fusarium graminearum strains were distributed on individual plates, each of the eight strains were spread individually onto five plates for a total of 40 plates. These plates were left to grow for seven days. Four days later, corn was set to imbibe water by distributing about 75 kg of feed corn into metal tubs. These tubs were then filled with water, left to soak for a few hours, and then filled with additional water as needed. The following morning, water was drained from each tub, aluminum foil was wrapped over the top of the tub, and the tub of imbibed corn was autoclaved on a 90-minute fluid cycle and left to cool for the rest of the day. The following day, corn was inoculated with the PDA plate containing Fusarium isolates that had been growing in the growth chamber for seven days. A streptomycin stock solution (5 g of streptomycin powder in 100 mL of distilled water) was used to prevent bacterial growth. For each of the eight tubs, five ml of the streptomycin stock solution was added with 45 mL of autoclaved distilled water and mixed into the tub, five PDA plates (each plate contains different Fusarium strains) were cut into pieces with a sterilized blade and mixed into the tub and left to sit for two weeks. After two weeks, the tubs were taken to the farm to dry the inoculated corn. The corn was removed from the tubs and spread in a thin layer on a plastic tarp with dehumidifiers running. These dehumidifiers were emptied every day for seven days and the corn was mixed and spread back into an even layer two or three times within the seven days. After seven days, the corn was dry and put into bags to store in a freezer until needed in the field. This whole process was done two more times.
About 7–14 days before heading, the inoculated corn was spread between rows in the scab nursery at a rate of 11.86 g/m2a second application of inoculated corn was applied a week after the first application. Nitrogen fertilizer and herbicide were applied in accordance with Kentucky management recommendations [24].
Traits measured in the scab nursery include heading date, FHB visual rating, and DON content. Heading date was recorded when more than half of the heads in a row were visible. FHB visual rating was recorded three weeks after the heading date. The rating was on a 0–9 scale where 0 is the most resistant and 9 is the most susceptible. The rating was determined by the visual appearance of scab on most of the heads in the row. DON contamination was measured by threshing the material from the scab nursery on a setting where tombstones would not be removed; this was followed by cleaning on a low air setting to avoid losing tombstones. A 15 g sample was taken of each line and ground on an extra fine setting with a coffee grinder to send to the University of Minnesota DON testing lab for gas chromatograph/mass spectrophotometer (GC/MS) quantification of DON. Because experimental material was only planted in the scab nursery in 2024, DON was only measured in 2024, thus the only DON values presented are those recorded in 2024.
Trait EvaluationAgronomic Trait Evaluation: Heading date, head type, height, and plot length were measured in both 2023 and 2024 by plot before harvesting. FHB ratings (0 (resistant)–9 (susceptible)) were taken by plot in 2024. FHB ratings were also taken in the scab nursery by plot in 2023 and by row in 2024. After harvesting 2023 and 2024, yield data was obtained after cleaning and weighing the grain from each plot. Test weights and moisture were obtained using a Dickey-John GAC 2100b instrument.
Quality Data: Gluten quality was predicted for each line by completing a sedimentation test [25]. This sedimentation test uses wheat meal, Sodium Dodecyl Sulfate (SDS) solution, and lactic acid reflux to get a measurement of flour suspension [26]. Sedimentation volume is an important trait in wheat breeding programs as it is a repeatable, fast, and accurate measure for determining gluten strength. Protein content for each line was evaluated by using near infrared (NIR) analysis.
Flavor Evaluation: Roti is a suitable choice for evaluating flavor since it contains four ingredients: whole wheat flour, water, canola oil, and salt. Whole wheat flour makes up the largest proportion of the ingredients, which allows for the flavor to be evaluated without convoluting factors. It also did not need to be refrigerated or frozen after baking so long as tasters evaluated within two to three days. Roti dough can be made, rolled out, and baked rapidly; therefore, it was an efficient method for flavor evaluation.
Ingredients●
●
●
●
1)
2)
3)
4)
5)
6)
Out of the 240 lines in this study, only 60 were used for roti flavor evaluation. These were the entirety of the DON study, the five most related and least related lines for both the yield and the quality populations, and the highest five and lowest five lines for protein content for both the yield and the quality populations. Each week, five lines were used to bake roti and Pembroke 2021 was used as a recurrent check. Pembroke 2021 was given a unique code each week so tasters would not know which entry was the check. This was done to identify consistency of each taster’s evaluation. After baking, roti samples were individually placed into plastic bags with unique identification numbers written on them. Ten tasters were chosen for the study based on willingness to participate. After baking roti, tasters were given roti samples of the six lines that were baked. They were to complete the tasting within two to three days after baking and complete a survey for each sample. This survey was made up of many questions including opinions about the flavor, texture, intensity, aroma, and specific flavor descriptions (https://docs.google.com/forms/d/e/1FAIpQLSeXoSYADew7--BgNiRT-V1uwJwrWzh3YcsN05VgZIjOtZRvpA/viewform; verified 07 Feb 2025).
Statistical AnalysisCombination codes refer to all combinations of resistance genes that were identified using KASP assays. Table 2 shows all combination codes that were generated, the genes present in each, and the nature of the presence or absence of genes. 1A Neuse, 4A Neuse, 1B Jamestown, and 3B Massey were present only in the heterozygous or homozygous negative state. Fhb1 was identified in the heterozygous and homozygous positive and negative state. These combination codes were used as effects in ANOVAs and further downstream analysis to determine the effects of FHB resistance genes on various agronomic and quality traits.
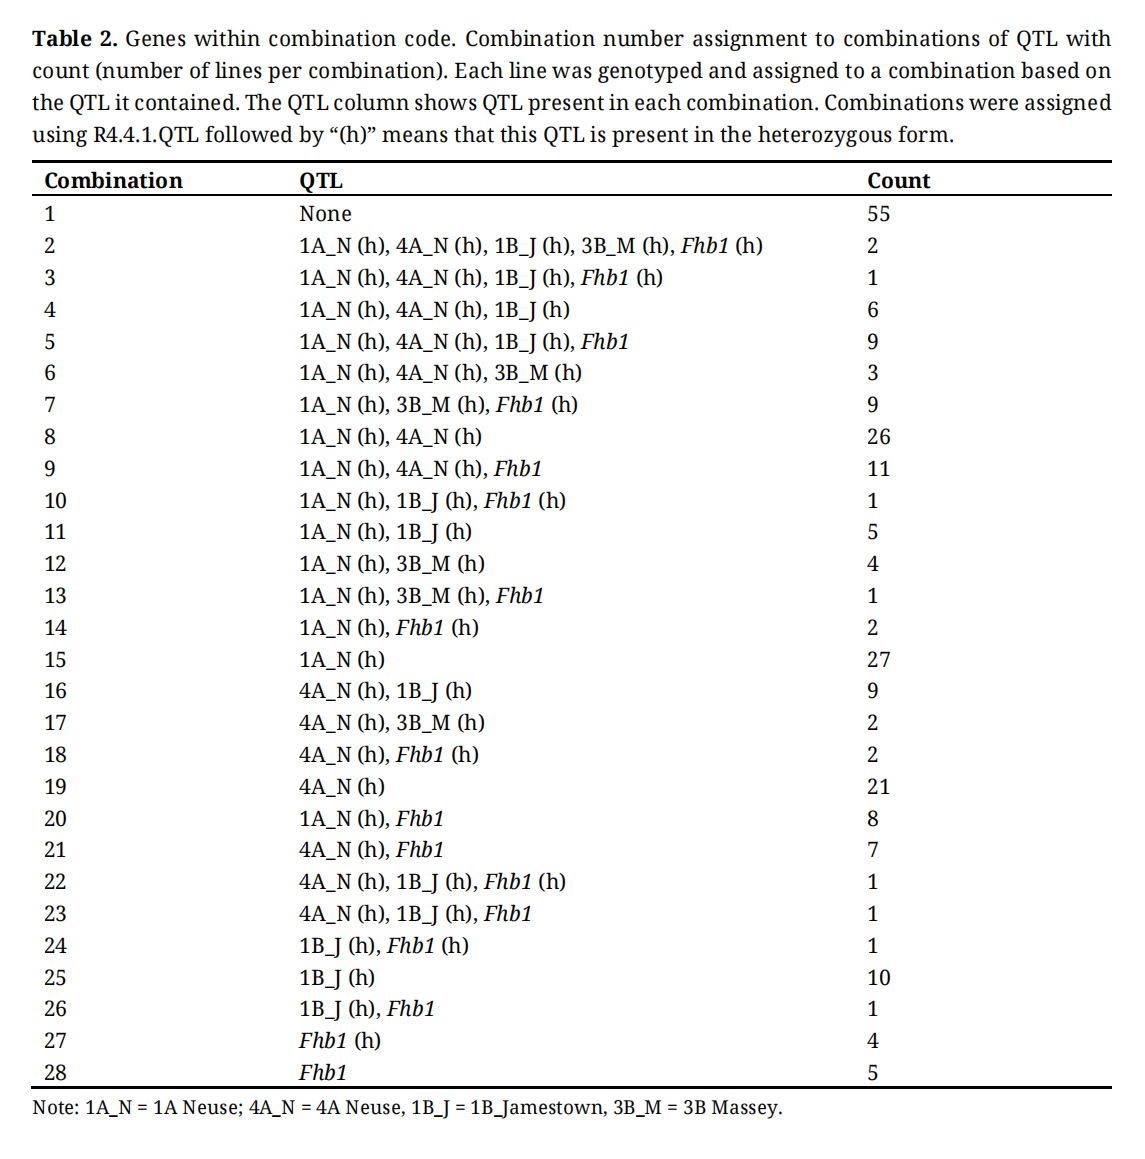 Table 2. Genes within combination code. Combination number assignment to combinations of QTL with count (number of lines per combination). Each line was genotyped and assigned to a combination based on the QTL it contained. The QTL column shows QTL present in each combination. Combinations were assigned using R4.4.1.QTL followed by “(h)” means that this QTL is present in the heterozygous form.
Agronomic and quality traits were analyzed using Analysis of Variance (ANOVA) in JMP Pro 16 with a General Linear Model (GLM) to determine differences in combination codes and estimate heritability:
Where Yijk is the observed trait in the ith environment with the jth combination code of the kth line, u is the general mean for the observed trait, ai is the effect of the ith environment, cj is the effect of the jth combination code, lc(k:j) is the effect of the kth line within the jth combination code, and eijk is the residual error.
Roti evaluation traits were analyzed with this model:
Where Yijk is the observed trait in the ith replication with the jth combination code of the kth line, u is the general mean for the observed trait, ai is the effect of the ith replication, cj is the effect of the jth combination code, lc(k:j) is the effect of the kth line within the jth combination code, and eijk is the residual error. Roti evaluators served as replications in this case.
Heritability (Equation 3) and 90% confidence intervals (Equations 4 and 5) were calculated [27] using the Mean Squares (MS) obtained from the ANOVA.
To obtain a list of most ideal to least ideal combinations of resistance genes, a weighted composite score was calculated for each line using standardized trait values and trait weights. Weights were assigned specifically based on available data, study data, and importance to the farmer. Traits used for this calculation include yield, test weight, protein, and DON. Weights were assigned 0.4, 0.4, 0.1, −0.3, respectively. The weighted composite score was calculated using this equation:
Where i is the combination, j is the assigned weight to the traits, and ij is the standardized value for traits for combination. These weighted composite scores were applied to each combination in this study and were categorized as follows: combinations that have a composite score above zero would be selected in the breeding program. Combinations with composite scores below zero would not be selected.
A random forest model was trained to identify the most important effects on all measured phenotypes. Effects used include combination code, 1A Neuse, 4 Neuse, 1B Jamestown, 3B Massey, and Fhb1. Yield and test weight included environment in addition to the genotype effects. This model was chosen to evaluate the order of importance for each effect on the measured phenotypes. In cases of quality parameters, explanation of variance was low (8.92%, for protein content, 21.16% for sedimentation volume, and 27.11% for DON). Yield and test weight had high variance explanation, 66.38% and 61.5% respectively. We still chose to use results from the order of importance for each, despite the low explained variance because we were not using the random forests for actual predictions but to explore relative orders of importance for each effect on agronomic and quality traits [28].
Least squares (LS) means of all measured traits for gene combinations and probability values for ANOVA effects are shown in Tables 3, S4, and S6. Table 3 shows that yield and test weight were highly significantly impacted by environment (year, location) and resistance gene combination. Significant differences (p ≤ 0.001) among gene combinations and among lines within gene combination were observed for test weight, sedimentation volume, protein percentage, and DON. Sedimentation volume and protein content were highly significantly impacted (p ≤ 0.001) by combination. Sedimentation and protein content were not analyzed with environmental effect because they were measured in only 2023 samples. DON was measured in 2024 scab nursery grain samples and was highly significantly impacted by resistance gene combination (Table 3 p ≤ 0.001).
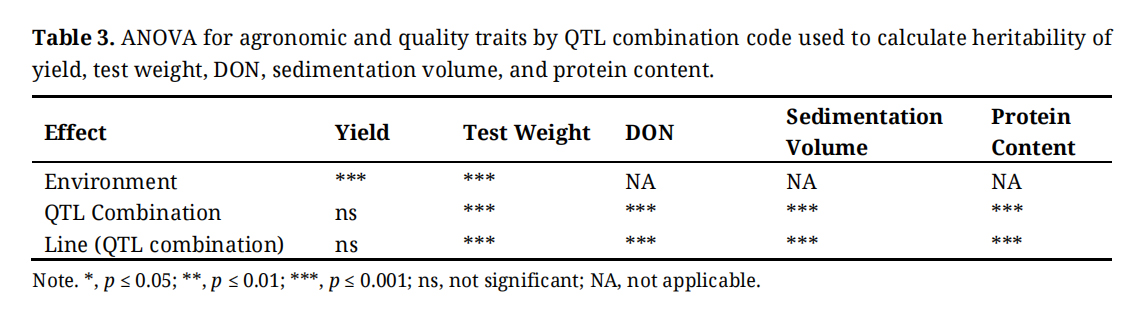 Table 3. ANOVA for agronomic and quality traits by QTL combination code used to calculate heritability of yield, test weight, DON, sedimentation volume, and protein content.
A separate ANOVA analysis shows significant differences (p < 0.05–0.001) associated with resistance genes for all phenotypes except for yield (Table 4). 1A Neuse had a significant impact on test weight and a large effect on DON. 4A Neuse had large effects on sedimentation volume, protein content, and DON. 1B Jamestown had a large effect on DON. 3B Massey and Fhb1 had a significant effect on DON and a large effect on test weight, sedimentation volume, and protein content.
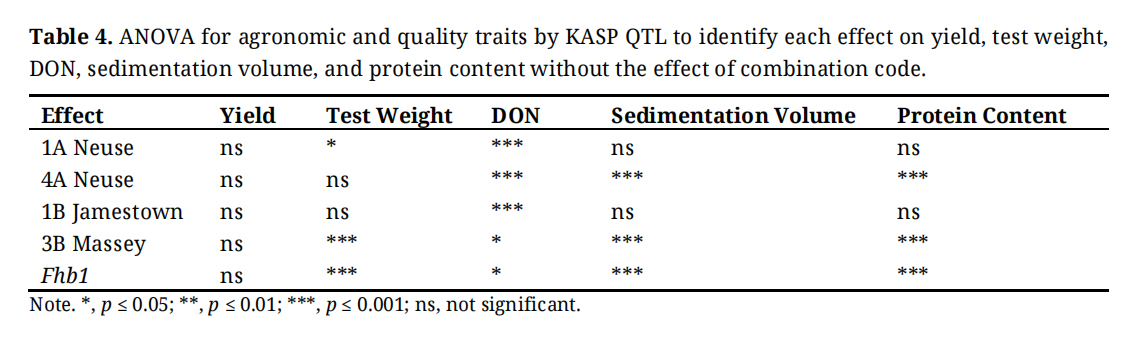 Table 4. ANOVA for agronomic and quality traits by KASP QTL to identify each effect on yield, test weight, DON, sedimentation volume, and protein content without the effect of combination code.
Resistance QTL combination had significant impacts on nutty and earthy flavor notes as well as flavor intensity (p < 0.05–0.001). 1A Neuse and 1B Jamestown individually had significant effects on sweet flavor notes (p < 0.05). For 1A Neuse, heterozygotes had a higher sweet flavor rating than for homozygous negative genotypes. The opposite was true for 1B Jamestown. Fhb1 had a significant effect on earthy flavor and flavor intensity and in the homozygous positive and heterozygous state had a higher earthy and intensity rating than the homozygous negative state Table 5.
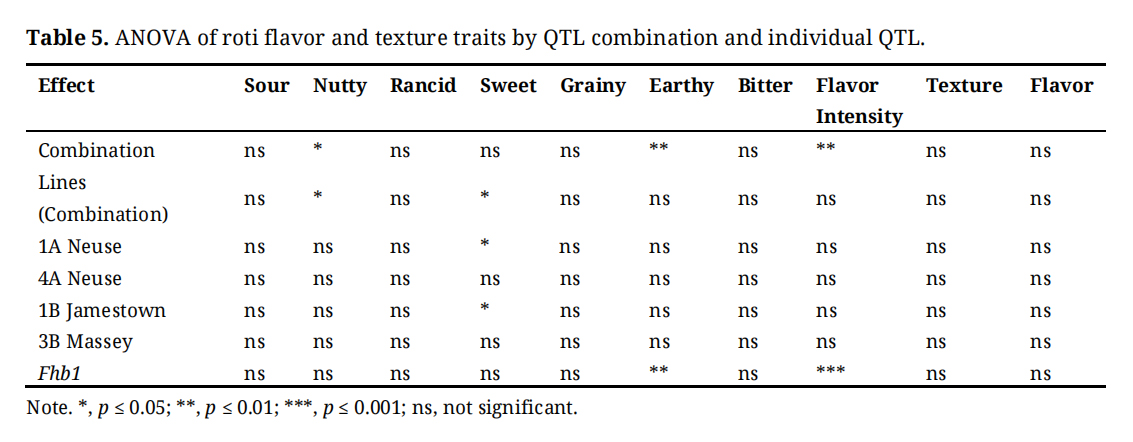 Table 5. ANOVA of roti flavor and texture traits by QTL combination and individual QTL.
The heat map (Figure 1) shows statistically significant correlations between agronomic and quality traits. Yield was correlated with sour and earthy flavor notes (0.33, 0.19). Test weight was correlated with sedimentation and sweet flavor notes (0.37). Protein, flavor intensity, texture preference, flavor preference, and earthy flavor notes were correlated with sedimentation (0.27–0.68). Texture preference, flavor preference, and sweet flavor notes were correlated with protein (0.22–0.34) while bitter flavor notes were negatively correlated with protein (−0.23). Texture preference, flavor preference, sour, nutty, sweet, grainy, and earthy flavor notes were correlated with flavor intensity (0.23–0.54). Texture preference is highly correlated with flavor preference (0.7) and sweet flavor notes (0.47). Nutty and sweet flavor notes are correlated with flavor preferences (0.23 and 0.6) while rancid flavor notes are negatively correlated with flavor preferences (−0.4). DON is correlated with grainy and earthy flavor notes (0.24).
QTL combination had a significant effect on flavor intensity (Table 5). Combination 5(1A_N, 4A_N, 1B_J, and Fhb1) and combination 8 (1A Neuse and 4A Neuse) had the lowest LS mean rating for flavor intensity. Combination 3 (1A Neuse, 4A Neuse, 1B Jamestown, and Fhb1) is the highest for flavor intensity (Table S3). This matches the expected results from a separate ANOVA analyzing the effects of KASP QTL which showed that Fhb1 is the only resistance gene associated with a difference in flavor intensity (Table 5). The presence of the resistance allele at Fhb1 was associated with a higher flavor intensity than Fhb1 homozygous for susceptibility alleles. QTL combination had a significant effect on nutty and earthy flavor notes (Table S5). Combination 12 (1A Neuse and 3B Massey) had the highest rating for nutty flavors. Interestingly, QTL combinations 2 (1A_N, 4A_N, 1B_J, 3B_M, and Fhb1) and 11(1A_N and 1B_J) had the lowest LS means rating for nutty flavors and both have 1A Neuse and 1B Jamestown. Combination 7 (1A_N, 3B_M, and Fhb1), 12 (1A_N and 3B_M), and 20(1A_N and Fhb1) have the highest rating for earthy flavor. Combinations 1 (no resistance QTL), 5(1A_N, 4A_N, 1B_J, and Fhb1), 8 (1A_N and 4A_N), and 15 (1A_N) have the lowest LS mean rating for earthy flavors (Table S3). Fhb1 has a significant effect on earthy flavors (Table 5). Fhb1 heterozygous and homozygous positive have a higher rating than homozygous negative (Table S5). Combinations 1, 8, and 15 do not have Fhb1 while combination 3 has it in the heterozygous state (Table 2). Combination 5 has Fhb1 in the homozygous positive state and does not follow the findings of the ANOVA since Fhb1 should have a positive effect on earthy flavors and combination 5 was ranked one of the lowest for earthy flavors, but this shows that the effect of Fhb1 could be confounded by the presence of other KASP QTL.
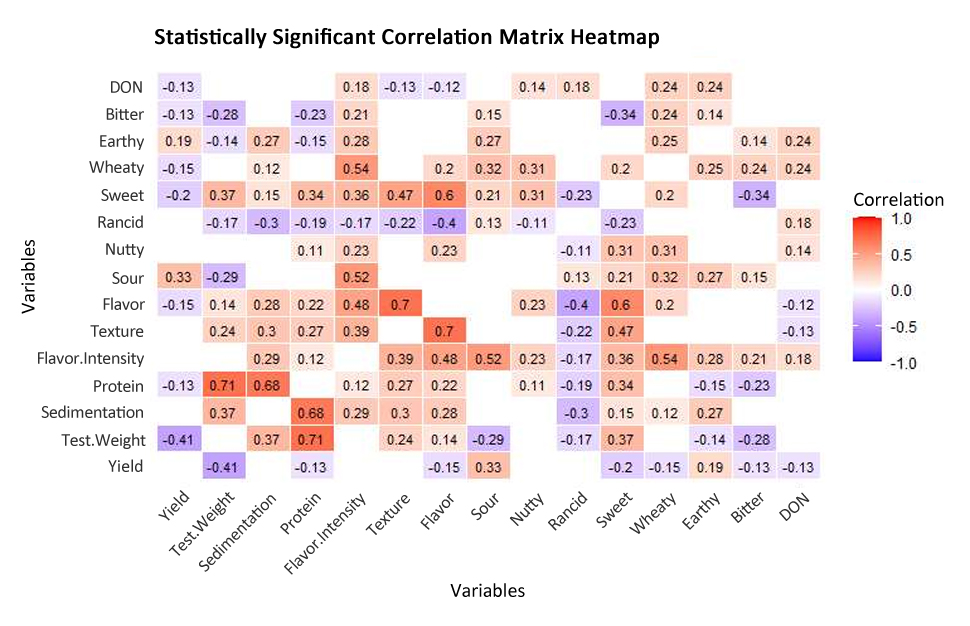 Figure 1. Heatmap of statistically significant correlations (p < 0.05) for all traits. Significant correlations generated using R4.4.1. Dark red indicates positive correlations on a gradient where dark blue indicates negative correlations. Blank spaces mean that the correlation was not significant at p < 0.05.
Figure 2 shows heritability estimates with 90% confidence intervals, where yield is presented by year because the experimental units in 2023 and 2024 were different. High heritability estimates (h2 = from 0.58 to 0.99) were calculated for DON, test weight in 2023, and sedimentation volume. Moderate heritability estimates (h2 = from 0.42 to 0.54) were calculated for protein content, test weight in 2024, yield in 2023, nutty and earthy flavor notes, and flavor intensity. Low heritability estimates (h2 = from 0.1 to 0.35) were calculated for yield in 2024, flavor preferences, and texture preferences.
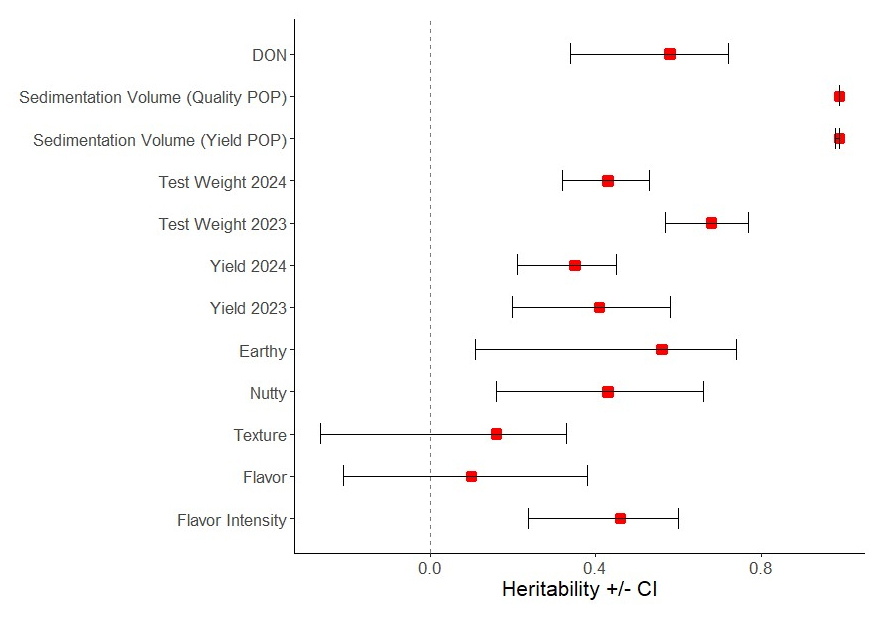 Figure 2. Heritability estimates with 90% confidence intervals were calculated using the mean squares derived from their respective ANOVAs. The dashed line at 0 marks the 0% heritable line. Red squares mark the broad sense heritability estimate (h2) while the error bars show the 90% confidence intervals for each heritability estimate.
QTL combination had a highly significant effect on a few flavor note traits. On average, lines that have no resistance genes present (Combination 1) was ranked 29th out of the 30 combinations for yield, 15th for test weight, 12th for DON, 25th for sedimentation, and 19th for protein content (Tables 6–9, S2). Combination 2 included lines with all the resistance genes in heterozygous form and on average was ranked 4th for yield, 6th for test weight, 3rd for DON, 15th for sedimentation, and 7th for protein content (Table S4). The best five combinations for yield all included Fhb1 in either the homozygous positive or heterozygous condition. The same is true for four out of five highest sedimentation ratings and three out of five for protein content ratings. Combination 3 comprises lines with all the resistance genes except 3B Massey and is in the top 5 rankings for yield, sedimentation, and protein content. For many years we have used an older SRW cultivar, Pioneer Brand 2555 as the susceptible check, or negative control. The mean DON value of this cultivar in the 2024 scab nursery, based on 17 observations, was 11.9 ppm.
Statistical comparisons of least squares means for yield, test weight, DON and protein are shown in Tables 6–9, respectively. Not all 28 QTL combinations are presented, only those with least squares means based on at least 5 observations. An important caveat about all of these comparisons is that the populations from which these breeding lines came were segregating for many genes in addition to the FHB resistance genes we have focused on, and that many other factors affect performance, even for FHB traits like DON. Note that while the lines which lack any of these resistance QTL (combination 1) are the lowest yielding group, their DON level is right in the middle of the group intermediate to the high DON lines with 1A_N, 4A_N, and 1B_J and the lowest DON lines which have these same three genes plus Fhb1 (Table 8). It is important to note though, that the high and the low group means are based on a small number of observations.
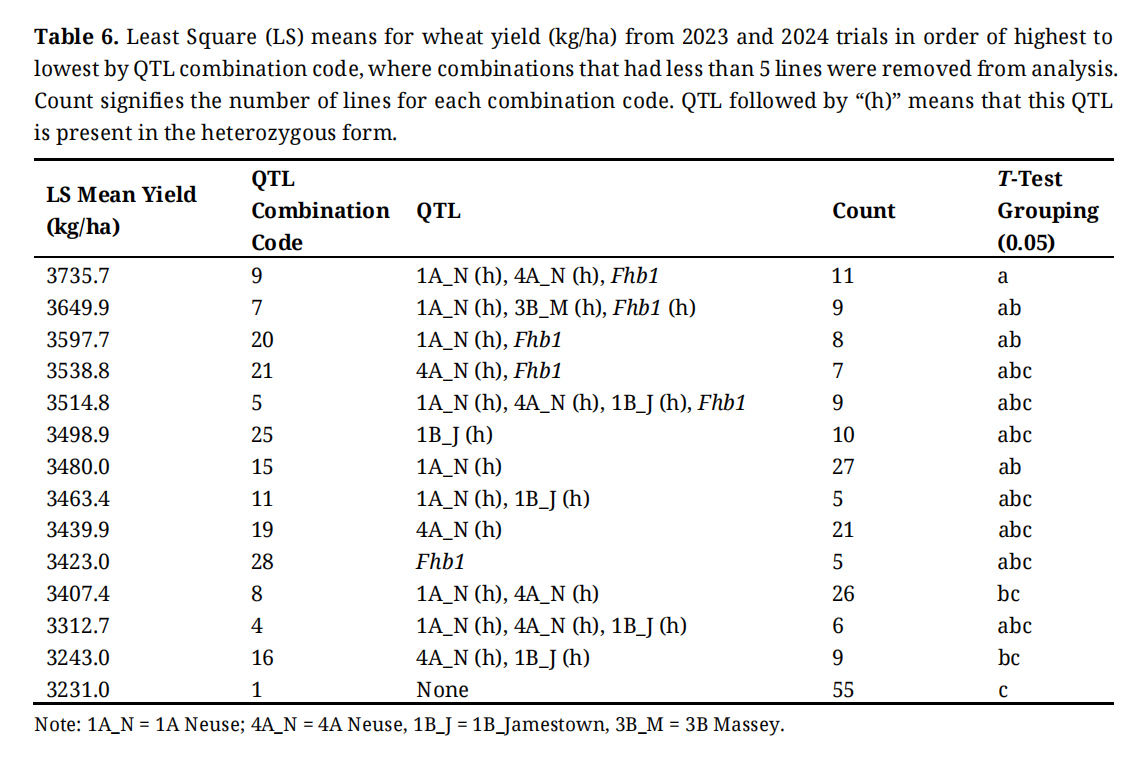 Table 6. Least Square (LS) means for wheat yield (kg/ha) from 2023 and 2024 trials in order of highest to lowest by QTL combination code, where combinations that had less than 5 lines were removed from analysis. Count signifies the number of lines for each combination code. QTL followed by “(h)” means that this QTL is present in the heterozygous form.
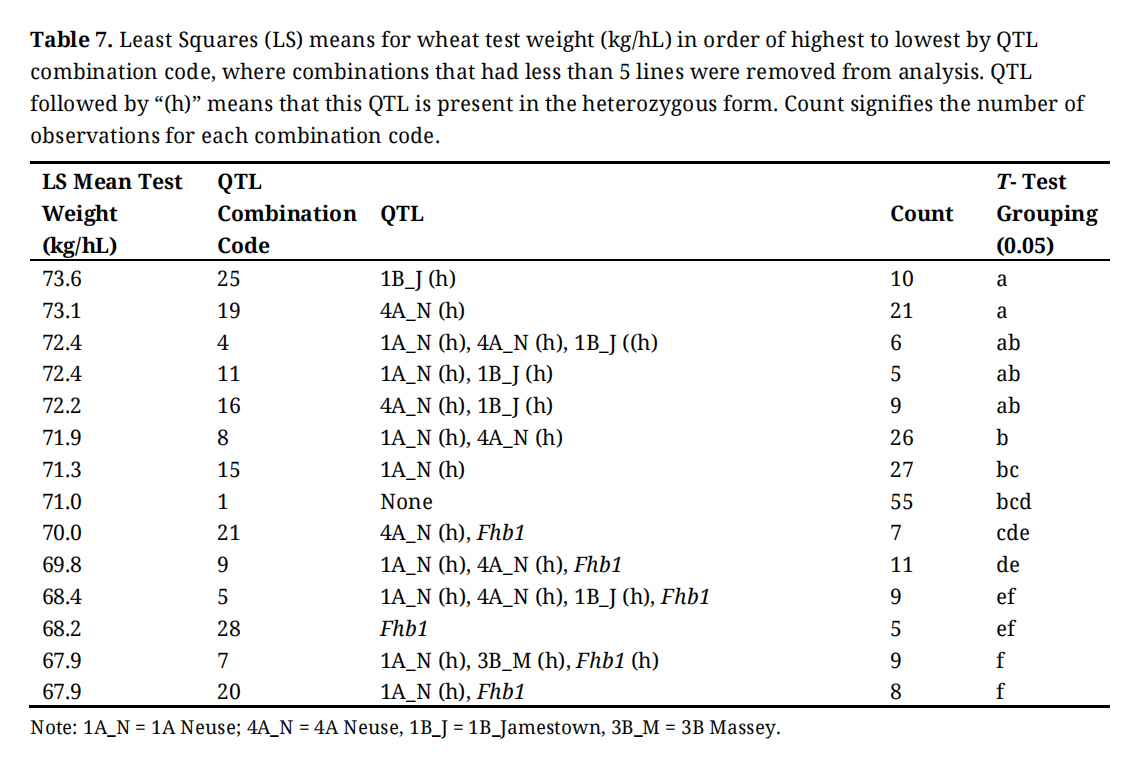 Table 7. Least Squares (LS) means for wheat test weight (kg/hL) in order of highest to lowest by QTL combination code, where combinations that had less than 5 lines were removed from analysis. QTL followed by “(h)” means that this QTL is present in the heterozygous form. Count signifies the number of observations for each combination code.
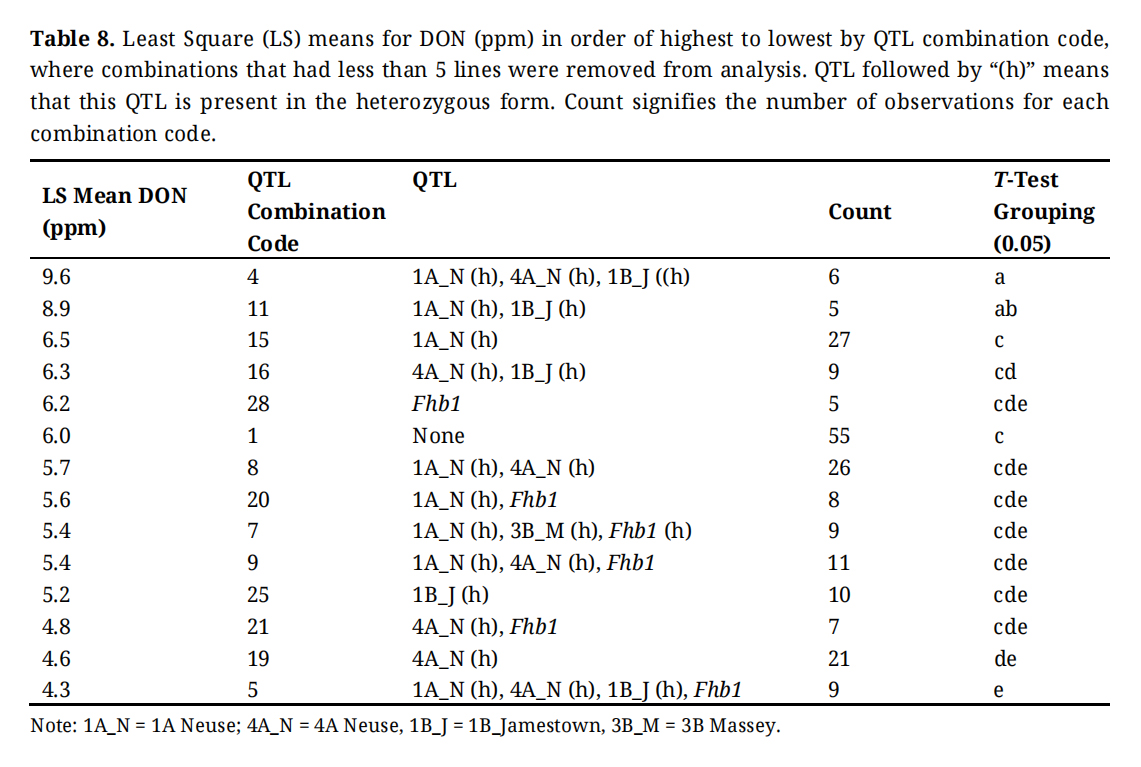 Table 8. Least Square (LS) means for DON (ppm) in order of highest to lowest by QTL combination code, where combinations that had less than 5 lines were removed from analysis. QTL followed by “(h)” means that this QTL is present in the heterozygous form. Count signifies the number of observations for each combination code.
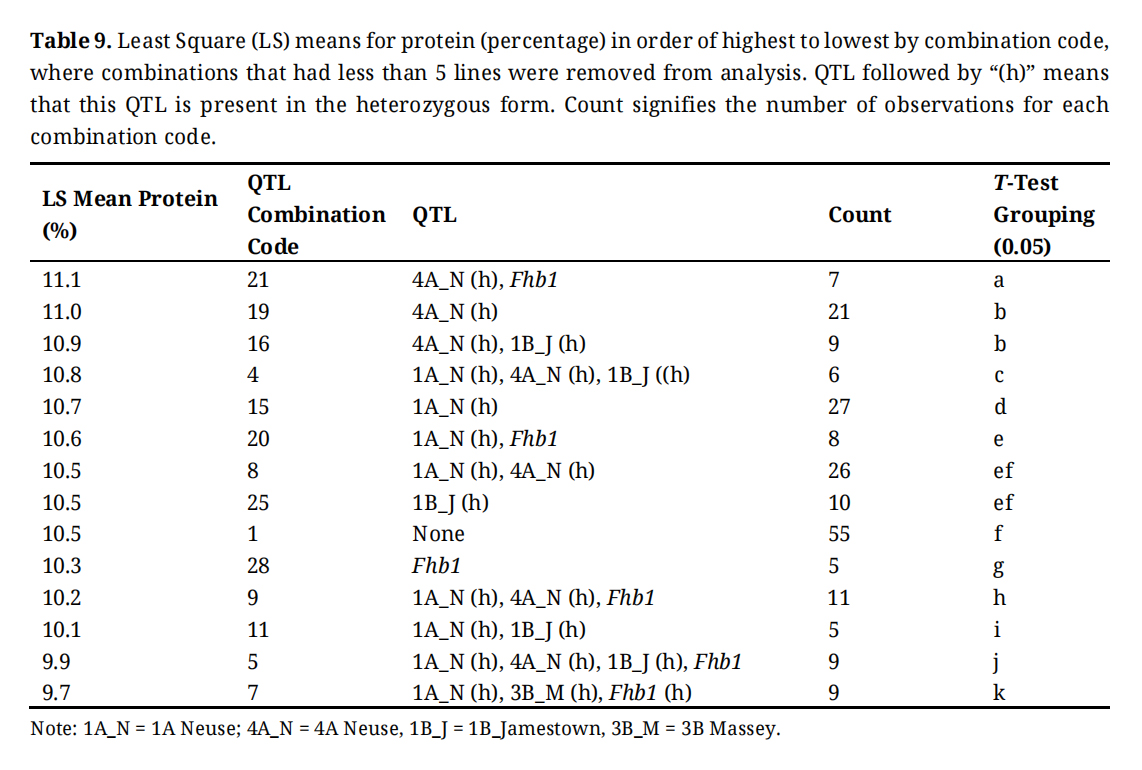 Table 9. Least Square (LS) means for protein (percentage) in order of highest to lowest by combination code, where combinations that had less than 5 lines were removed from analysis. QTL followed by “(h)” means that this QTL is present in the heterozygous form. Count signifies the number of observations for each combination code.
Contrasts between QTL combination groups are hampered by the small sample size of some groups (e.g. combination 9 with only 11 observations, Table 6) which reduces the power of test. Thus we evaluated contrasts between groups of lines that were positive, versus negative for resistance alleles at an individual QTL. In Table S1 we show average DON values for these positive versus negative contrasts at the following loci: 1A_N, 4A_N, 1B_J, and Fhb1. In the case of Fhb1, for example, the presence of the resistance allele resulted in a small (0.6 ppm) difference, but the difference was significant at p < 0.05 and the power of the test was >90%.
Weighted Composite Scores by Combination CodeComposite scores were generated by applying weights to each trait used, similar to the procedure used in a selection index. Yield and test weight were set at 0.4, protein was set at 0.1, and DON was set at −0.3 to ensure combinations that have the best performance for yield and test weight, while having a low DON score, provide a comprehensive representation of the value of a QTL combination.
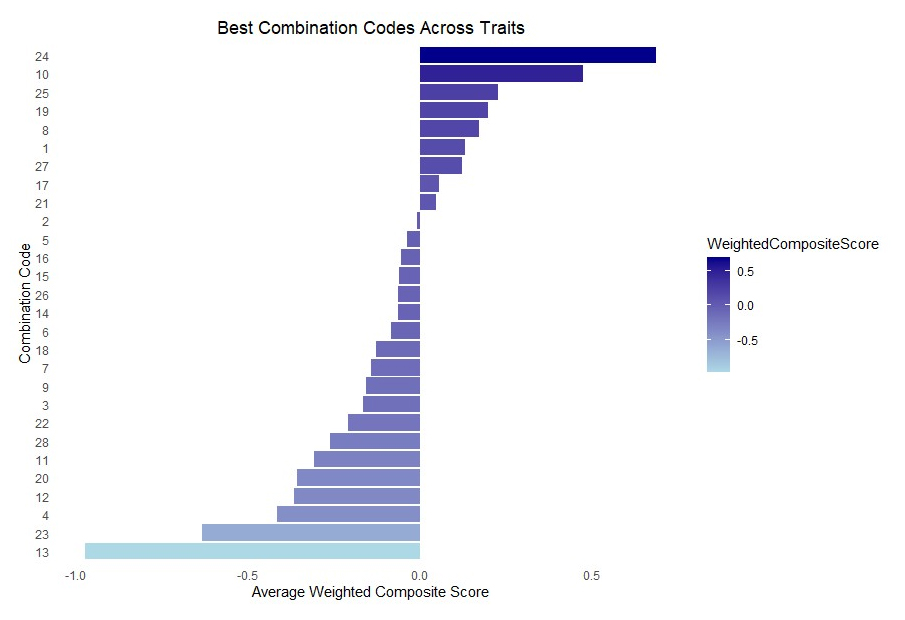 Figure 3. Combination code by weighted composite score. Combinations that have a composite score greater than zero are used for selection. Dark blue to light blue gradient where dark blue is a higher composite score, and light blue is a lower composite score. This would change if weight assignments were changed.
There were more combinations that had negative composite scores than positive scores. Combination 24 is the most ideal combination represented in this study and contains 1B Jamestown and Fhb1 in the heterozygous state. Combination 13 had the lowest composite score and contains 1A Neuse and 3B Massey and Fhb1 in the homozygous positive state. Combination 1 has no identified resistance genes and has a composite score higher than 0 while combinations 2 and 5 contain all the KASP resistance genes with either heterozygous or homozygous positive state for Fhb1 and are close to zero for composite scores.
Effects That Explain the Most Variation in Measured TraitsRandom forests models show most variation being attributed to differences in environment for yield and test weight followed by combination code (Table 10). QTL combination code has the largest effect for DON, sedimentation volume, and protein content. 4A Neuse is the next greatest contributor to variation in all traits followed by Fhb1 for all traits except for DON where 1B Jamestown is the third largest contributor. Yield, test weight, and protein content were least affected by 1B Jamestown, while DON was the least affected by 3B Massey. Sedimentation volume is the least affected by 1A Neuse. For each trait, QTL combination was the most important factor followed by 4A Neuse, and Fhb1 in four out of five traits.
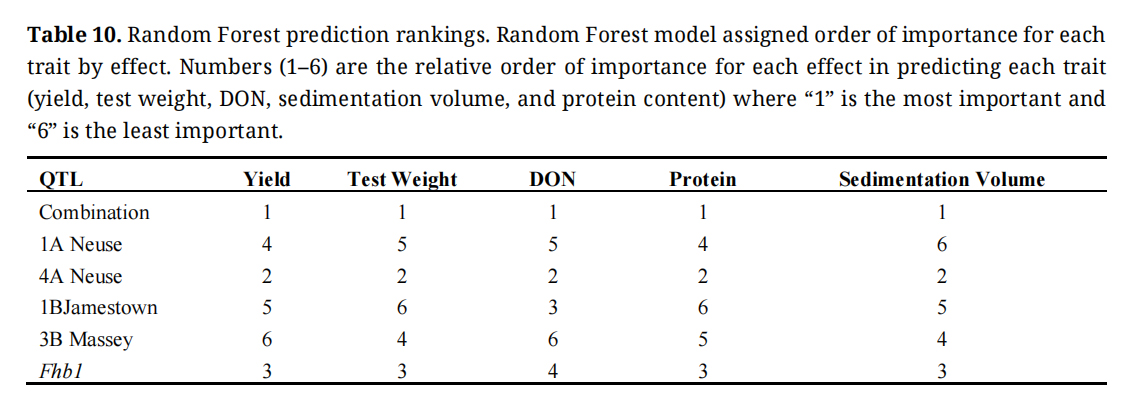 Table 10. Random Forest prediction rankings. Random Forest model assigned order of importance for each trait by effect. Numbers (1–6) are the relative order of importance for each effect in predicting each trait (yield, test weight, DON, sedimentation volume, and protein content) where “1” is the most important and “6” is the least important.
FHB resistance genes have been well studied, and many have been shown to provide significant resistance to FHB. However, little is known about their effects on agronomic, quality and sensory traits. In this study we show that there is a highly significant effect on all traits for combinations of five FHB resistance genes. This information is important to wheat breeders who should consider the effects of combinations of resistance genes on yield, test weight, DON accumulation, sedimentation volume, protein content, and flavor intensity. Here, we have shown the rankings of 28 combinations of five resistance genes for each trait impacted by QTL combination.
As expected, yield and test weight were highly influenced by the environment (p < 0.001; Table 3). We also found that yield was not affected by individual QTL (Table 4). Yield and test weight are complex traits, and one would not expect individual resistance genes or combinations of resistance genes to impact yield in the absence of scab. Test weight was highly impacted by gene combination, and further, there was significant variation among lines within the combination of 3B Massey, and Fhb1 (Table 7). This indicates that lines with 3B Massey and Fhb1 may have a positive effect on test weight but there are many other factors to consider since test weight is also highly influenced by the environment as well as other non-resistance genes. Every QTL had a significant impact on DON; however, not all were beneficial. 1A Neuse and 1B Jamestown increase DON while 4A Neuse, 3B Massey, and Fhb1 decrease DON. This indicates that 1A Neuse and 1B Jamestown should be used cautiously during breeding decisions since DON is a highly important FHB related trait.
In Table 8, four of the five QTL (1A_N, Fhb1 (positive and heterozygous), 1B_J, and 4A_N) are the single resistance gene represented in four groups of lines: these are combination codes 15, 28, 27, 25, and 19. Using the mean DON associated with these lines reinforces our assessment of the likely value of these genes in these two populations: 6.5, 6.2, 4.9, 5.2 and 4.3 ppm, respectively. However, there are apparent interactions involving these genes. For example, combination 10 contains 1A Neuse, 1B Jamestown, and Fhb1, had the lowest DON concentration in the study (2.0 ppm), while combination 11 (1A_N, 1B_J) is in the top 5 for highest DON content. Some low DON lines have either 1A Neuse or 1B Jamestown, or both (combinations 24, 6, and 5 respectively). Fhb1, 3B Massey, and 4A Neuse have a significant effect on lowering DON. This study shows that out of the five resistance genes presented, 4A Neuse is the most beneficial FHB resistance gene for managing DON in these populations (Tables 4 and 10). While the lines from each population share a common genetic background their genotypes differ at many loci, some of which likely have incremental impacts on FHB traits like DON concentration.
The resistance QTL 4A Neuse, 3B Massey, and Fhb1 appear to affect sedimentation volume (Table S2) and protein (Table 9). Differences in all agronomic and quality traits can be associated with combination of resistance genes. In the ANOVA QTL combination and lines within combination had a significant effect on all traits, except yield (Table 3). This shows that although there are other influencing factors, resistance genes and combinations of resistance genes should be considered and applied in accordance with breeding program goals. Using a weighted composite score, breeders can identify the optimal combinations of these resistance genes.
Flavor is very under-studied in the wheat literature, but these are important traits to quantify, particularly for the growing artisan baking and distilling markets. In this study we found significant differences among the resistance genes and gene combinations for several flavor traits (Table 5). However, there may be more differences that are present and not identifiable due to the subjective nature of flavor evaluation. Differences in nutty flavor notes were impacted by combination of resistance genes. While individual QTL did not have an effect on nutty flavor, 1A Neuse and 3B Massey combined to have a positive impact on nutty flavors. Earthy flavor notes and flavor intensity were influenced by QTL combination and Fhb1 (Table 5). The presence of all five resistance genes in the heterozygous stage increased the earthy flavors detected (Table S3). Earthy flavors were not significantly correlated with flavor preference but were correlated with flavor intensity (0.28), while nutty flavors were significantly correlated with both flavor preference (0.23) and flavor intensity (0.23) (Figure 1). Because flavor intensity was moderately correlated with flavor preferences (0.48), it’s possible that Fhb1 not only affects flavor intensity but also affects flavor preferences in a positive way. Although the ANOVA does not support this conclusion, flavor is a subjective trait that can be difficult to interpret. Further, because earthy and nutty flavors are heritable traits (Figure 2) and significantly correlated with flavor intensity and in the case of nutty flavors, correlated with flavor preference (Figure 1); it is possible that these flavor notes could be used to breed for wheat flavor qualities and preference.
Heritability estimates showed that flavor preferences and texture preferences were not heritable, at least in the populations used in this study (Figure 2). A previous study done in our lab shows that flavor is heritable (0.40) in a population of advanced trial lines [26]. However, flavor intensity was moderately heritable at 0.46 and moderately correlated with flavor preference (0.48) which is highly correlated with texture preferences (0.7). Thus, it is possible that flavor intensity can be used as an indirect selection criterion for flavor and texture preferences. Nutty and earthy flavor notes were moderately heritable (0.43, 0.56) and therefore possible to breed for. Sedimentation volume was highly heritable at approximately 0.98 which agrees with [29] and [25]. The implication from this result, is that lines with high sedimentation volumes that also have desirable flavor attributes based on roti tasting might be candidates for leavened bread for the artisan baking market, given the strong correlation of sedimentation and loaf volume [26]. Yield, DON, and test weight were also highly heritable in these populations (Figure 2). Having a large dataset evaluating many traits in a closely related population gives the advantage of finding more nuanced relationships and breeding strategies.
Because resistance gene combinations were significantly associated with all agronomic and quality traits, it was important to evaluate the highest to lowest rankings for each combination by trait. Interestingly, QTL combination 1 which contains no resistance genes, is ranked the lowest for yield, very low for protein and sedimentation volume, and in the middle for test weight and DON (Tables 6, 9, S2, and 7, respectively). In these two populations, these FHB resistance genes generally had a positive impact on most traits and therefore, breeding programs benefit from deploying these resistance genes in their populations. Combination 2, in contrast with combination 1, includes all the resistance genes in the heterozygous state and is ranked highly for all traits except sedimentation where it is ranked in the middle. In terms of DON this combination ranks below combination 1 which lacks resistance genes. The problem with this comparison is that mean values for combination 2 are based only on two observations, vs 55 for combination 1. A caveat about this data is that these are not near isogenic lines so we cannot say unequivocally that the presence of any given resistance allele is the cause of increased or decreased DON because these lines are still segregating at an unknown number of loci. Combinations that include Fhb1 have high yield, sedimentation, and protein, though Fhb1 pyramided with other resistance genes does not influence agronomic or quality traits. The weighted composite analysis was used to identify optimal QTL combinations based on specific goals. Breeders struggle to find high yield and low DON lines. Three QTL combinations are notable in this context: 10, 17 and 21. All three had medium to very low DON (Table 8), and they ran the gamut from well above average yield (combination 17) to average (combination 21) to below average (combination 10). Depending on breeding program goals, the composite scores could be calculated differently to more accurately reflect end user targets. Weights may vary, but high yield and low DON will always be “must-have” traits. In this case, the breeder would use the few lines that have a composite score that is greater than zero (Figure 3). This provides valuable information as to which combinations of genes are the most useful for our goals.
Table 10 shows that combination of genes is a more important predictor of trait value than any individual QTL. 4A Neuse was the second most important factor for prediction in every case, followed by Fhb1 in four out of five traits. This can be of use to wheat breeding programs by evaluating early lines by combination of resistance genes and predicting which will perform the best for target traits. Table S1 shows a more powerful approach is to contrast lines with the resistance alleles with those lines that lack them on a per locus basis. Although the increased sample size improves the power of the test, the lines still differ for many genes and characteristics beyond these resistance loci, and the effects of these differences on traits like DON are unknown.
In this study all agronomic and quality traits, excluding yield, were highly affected by combinations of five commonly used FHB resistance genes. The data reveals a novel approach to elucidating the effects of resistance genes and combinations of resistance genes on flavor notes and flavor intensity. Some of the individual FHB resistance genes and many combinations of genes are associated with measurable effects on traits. Heritability estimates showed that nutty and earthy flavors and flavor intensity can be used in breeding programs and possibly in genomic predictions. Perhaps the most interesting correlation is between flavor intensity and flavor preference at 0.48. This indicates that there is a possibility for using flavor intensity to breed for flavor preference. This will be even more useful once we have enough sensory evaluations to use genomic predictions for flavor intensity and flavor notes without subjective scales.
With respect to DON, where we would expect the impact of FHB resistance QTL combinations, the ability to describe trends is constrained by the small number of observations that constitute the various gene combinations (Table 8). Consider Fhb1, the most important resistance gene. The least squares mean of 6.2 ppm is based on only 5 observations. The Neuse QTL are similarly constrained. But the power of contrasts is increased significantly when we compare lines that have the resistance gene with those that lack it, instead of focusing on specific gene combinations. These more powerful contrasts are presented in Table S1. In this case the power of the tests hover around 90% except for 1B_Jamestown, and thus the probability of a Type II error is low.
It is clear from this study that combinations of resistance genes are more useful to consider in a breeding program than whether the lines have or do not have individual genes since these genes are acting together to affect phenotypes. However, it is also clear that the population size must be quite large to be able to make statistically meaningful contrasts. Weighted composite scores can be adjusted to find the best combinations of these resistance genes according to specific breeding program goals. The Random Forest model provides a list of relative importance for the abilities of resistance genes to predict agronomic and quality traits. This information can be incorporated into genomic prediction models to enhance prediction power.
The following supplementary materials are available online at: https://doi.org/10.20900/cbgg20250006, Table S1: DON levels for lines with resistance alleles present and absent with respect to four QTL, probability of Type I and Type II errors and the power of a test contrasting two sample means., Table S2: Least Square (LS) means for sedimentation volume (cm3) in order of highest to lowest by combination code, where combinations that had less than 5 lines were removed from analysis. QTL refers to the QTL that comprise each combination code. QTL followed by “(h)” means that this QTL is present in the heterozygous form. Count signifies the number of observations for each combination code., Table S3: Least Square (LS) means and Standard Error (SE) for heritable flavor traits by combination of resistance genes., Table S4: Least Square (LS) means and Standard Error (SE) for agronomic and quality traits by combination of resistance genes., Table S5: Gene state impacts on flavor traits by significant QTL (P<0.05)., Table S6: LS Means for agronomic and quality traits by QTL combination code for yield, test weight, DON, sedimentation volume, and protein content. QTL followed by “(h)” means that this QTL is present in the heterozygous form., Table S7: KASP primers used to identify presence or absence of FHB resistance QTL.
The dataset of the study is available from the authors upon reasonable request.
Conceptualization, DVS and JM; Methodology, DVS and JM; Software, JM, GBG; Validation, GBG, JM and DVS; Formal Analysis, JM and DVS; Investigation, JM and MG; Resources, GBG and KJ; Data Curation, JM; Writing—Original Draft Preparation, JM and DVS; Writing—Review & Editing, DVS, GBG, TP, KJ; Visualization, JM; Supervision, DVS; Project Administration, DVS; Funding Acquisition, DVS and KJ.
Authors declare no conflicts of interest.
This research was funded by the US Wheat and Barley Scab Initiative under agreement No. 59-0206-9-054.
The authors thank Jared Smith and Emily Conley for their help on KASP assays.
1.
2.
3.
4.
5.
6.
7.
8.
9.
10.
11.
12.
13.
14.
15.
16.
17.
18.
19.
20.
21.
22.
23.
24.
25.
26.
27.
28.
29.
30.
Morris J, Brown-Guedira G, Gillum M, Jakobsen K, Phillips T, Van Sanford D. Combinations of FHB resistance genes impact agronomic, quality, and flavor traits in soft red winter wheat. Crop Breed Genet Genom. 2025;7(2):e250006. https://doi.org/10.20900/cbgg20250006

Copyright © Hapres Co., Ltd. Privacy Policy | Terms and Conditions