Location: Home >> Detail
Crop Breed Genet Genom. 2025;7(3):e250008. https://doi.org/10.20900/cbgg20250008
 ,
Jyothi Bhoga 1 ,
Nagesh Kumar Mallela Venkata 2 ,
Bhadru Dharavath 2 ,
Vinodhana Kumari 3 ,
Rajashekhar Mahantaswami Kachhapur 4 ,
Sravani Dinasarapu 5 ,
Ramesh Kumar Phagna 6 ,
Dhandapani Appavoo 7
,
Jyothi Bhoga 1 ,
Nagesh Kumar Mallela Venkata 2 ,
Bhadru Dharavath 2 ,
Vinodhana Kumari 3 ,
Rajashekhar Mahantaswami Kachhapur 4 ,
Sravani Dinasarapu 5 ,
Ramesh Kumar Phagna 6 ,
Dhandapani Appavoo 7
1 Winter Nursery Centre, Indian Council of Agricultural Research (ICAR), Indian Institute of Maize Research, Rajendranagar, Hyderabad 500030, India
2 Maize Research Centre, Professor Jayashankar Telangana State Agricultural University, Hyderabad 500030, India
3 Centre for Plant Breeding & Genetics, Department of Millets, Tamil Nadu Agricultural University, Coimbatore 641003, India
4 All India Coordinated Research Project on Maize, University of Agricultural Sciences, Dharwad 580005, India
5 All India Coordinated Research Project on Maize, Agricultural Research Station, Karimnagar 505002, India
6 Indian Council of Agricultural Research (ICAR), Indian Institute of Maize Research, Ludhiana 141004, India
7 Indian Council of Agricultural Research (ICAR), National Academy of Agricultural Research Management, Hyderabad 500030, India
* Correspondence: Sunil Neelam
Development of high-yielding maize (Zea mays L.) hybrids, along with being well-adapted to many environments, is the most important goal of the National Maize Research Program in India. genotype × environment interaction (GEI) continues to be a major challenging issue to plant breeders and production agronomists. The present research investigates the (GEI), specifically examining hybrid stability and yield performance across distinct environmental conditions. A total of 62 maize hybrids were evaluated using both parametric and non-parametric methodologies across the four environments (Coimbatore, Dharwad, Hyderabad, Karimnagar) during Kharif 2021. Combined analysis of variance (ANOVA) and the Additive Main Effects and Multiplicative Interaction (AMMI) model are widely employed in multi-environment trials (MET) to evaluate genotype performance and stability. The AMMI model integrates ANOVA for assessing additive main effects with principal component analysis (PCA) to explore GEI, offering a comprehensive understanding of hybrid responses across environments. Moreover, PCA and correlation analysis were utilized to elucidate the relationships between parametric and non-parametric metrics, facilitating a comprehensive understanding of hybrid performance dynamics. The findings underscored the necessity of simultaneously considering yield and stability to harness GEI effects, thereby refining the maize cultivar selection process. The stability parameters, such as S(6), NP(2), NP(3), NP(4), KR, and CVi, were identified as effective statistics for screening desirable hybrids as they had a significant positive correlation with mean yield. Furthermore, according to the static and dynamic concepts of stability, the results revealed that stability statistics clustered into five groups. The overall stability analysis following different stability methods concluded that G51, G26, G30, G31, G12, G2, G27, G20, G47, and G56, identified as high yielding and stable across the four tested environmental conditions. Through the integration of yield and stability considerations and the utilization of analytical tools like PCA, consisting of both parametric and non-parametric statistics and cluster analysis, this study contributes to identifying resilient maize cultivars capable of confronting the challenges posed by climate change.
Maize, as a fundamental crop in agriculture, plays a crucial role in the worldwide food supply chain, serving a wide range of farmers and stakeholders. Maize is India’s third most significant cereal crop, next to rice and wheat in acreage and production. Global maize production reached 1.16 billion tonnes in 2022, cultivated over 203 million hectares, and increased to 1.22 billion tonnes in 2023 [1]. In India, maize was grown on 11.24 million hectares, yielding 37.66 million tonnes in 2023–24, highlighting its growing demand and significance in the agricultural sector [2]. Although its cultivation area in India is smaller compared to crops like rice and wheat, [3], corn holds significant importance due to its versatile applications [4]. It serves as a primary raw material for secondary industries such as poultry and starch production. However, a notable portion of corn cultivation in the country relies on rainfed conditions, which presents challenges in maintaining a consistent supply due to unpredictable weather patterns. Sometimes, these fluctuations lead to the need for imports to meet domestic demands, emphasizing the necessity for increased resilience within the corn farming sector. Essential to addressing these challenges is understanding the complex relationship between the hybrid and the environment, which greatly influences crop performance. Maize hybrids show high heterosis, but variable performance across environments highlights genotype × environment interaction, emphasizing the need to define adaptation zones and match cultivars to regional conditions for stable yield [5]. GEI emerges as a critical factor, impacting the behaviour of corn hybrids across various environmental conditions. This interaction can complicate the selection of superior hybrids, highlighting the need for robust methodologies to assess hybrid adaptability and stability.
The process of choosing the best hybrids for a range of environmental circumstances depends heavily on MET. According to [6], MET typically entails assessing a variety of hybrids over several locations and years. Plant breeders strive for high-yield performance combined with stability, and their goal is to create new commercial hybrids that can flourish in a variety of environments. However, substantial GEI interactions frequently make it difficult to interpret hybrid performance [7]. The association between genotypic and phenotypic values is impeded by this interaction, which makes hybrid selection difficult [8].
Maize, as a prominent cereal, is expected to play a vital role in meeting future global food demand. Crop production is driven by genotype, environment, and their interaction (GEI), with quantitative traits like yield influenced by both genetic effects and GEI [9]. It is essential to comprehend GEI interaction in METs to evaluate hybrid stability across various environments [10,11]. To examine hybrid adaptation and GEI interaction under variable growth conditions, a number of stability techniques have been put forth [7]. Identifying high-yielding and stable genotypes across diverse environments remains a key challenge due to GEI. To address this, hybrids must be evaluated under both favorable and unfavorable conditions across multiple environments [12]. [13], distinguished between two main methods for examining GEI interaction and adaptation: the non-parametric method, which takes environments and phenotypes into account in relation to biotic and abiotic factors, and the parametric method, which is based on distributional assumptions. Combining the two methods enables a thorough analysis and interpretation of GE interaction [10,14].
Combining parametric and non-parametric approaches is becoming more and more common in breeding programs, despite the pros and cons of both methods [10,15]. Cultivating hybrids with strong environmental adaptation is one way to improve maize yields. When it comes to producing grains under varying circumstances, the optimal hybrid should exhibit both stability and adaptation. The comparison between parametric and nonparametric statistics has been explored in various crops by different researchers. For instance, [16], investigated this in chickpea, [11] in barley, [17] in barley as well, [18] in durum wheat, [19] in maize, and [20] in rapeseed. Despite these studies, there remains a paucity of research specifically focusing on maize. Thus, the objectives of this research were to: (1) determine the effects of hybrid by environment interaction on grain yield for 62 maize hybrids in 4 test environments; (2) find hybrids that exhibit stable performance and high yield; and (3) investigate the associations, similarities, and distinctions between parametric and nonparametric stability methods.
A study was conducted to evaluate the stability performance of 62 single-cross maize hybrids regarding yield. The materials used for the study are listed in Table 1, along with their hybrid names, codes and source. The hybrids used in the present study comprised all the public and private sector hybrids that were tested in the AICRP (All India Coordinated Research Project). The experiment followed an alpha lattice design with three replications, including four standard checks-NK 6240, CMH 08-287, CMH 08-282, and BIO 9682 (Table 1). It was executed across four diverse environments: Coimbatore (Tamil Nadu) with latitude 11.0168° N and longitude 76.9558° E, Dharwad (Karnataka) with latitude 15.4589° N and longitude 75.0078° E, Hyderabad (Telangana) with latitude 17.4065° N and longitude 78.4772° E, and Karimnagar (Telangana) with latitude 18.4386° N and longitude 79.1288° E during the Kharif season of 2021, with detailed climatic conditions outlined in (Supplementary Materials Table S1). In each environment, 58 single-cross hybrids alongside the four checks were evaluated. The experiment was laid out with rows 4 meters long, maintaining 60 cm inter-row and 20 cm intra-row spacing. Each hybrid was sown in two rows. At all test locations, crop management followed recommended practices suited to the respective agro-ecological conditions. Harvesting was done at physiological maturity, marked by the black layer formation in the kernel. Grain yield for each hybrid was recorded on a plot basis and converted to kg ha−1.
Various parametric and non-parametric methods were employed in the present study to assess hybrid stability and adaptability. Parametric methods included regression coefficient (bi), deviation from regression (s2di), Wricke’s ecovalence (Wi2), Shukla’s stability variance (σ2i), and Francis and Kannenberg’s Coefficient of Variability (CVi). Furthermore, non-parametric methods such as Nassar and Huehn’s statistics (S(1), S(2), S(3), S(6)), Thennarasu's statistics (NP(1), NP(2), NP(3), NP(4)) and Kang's rank-sum (KR).
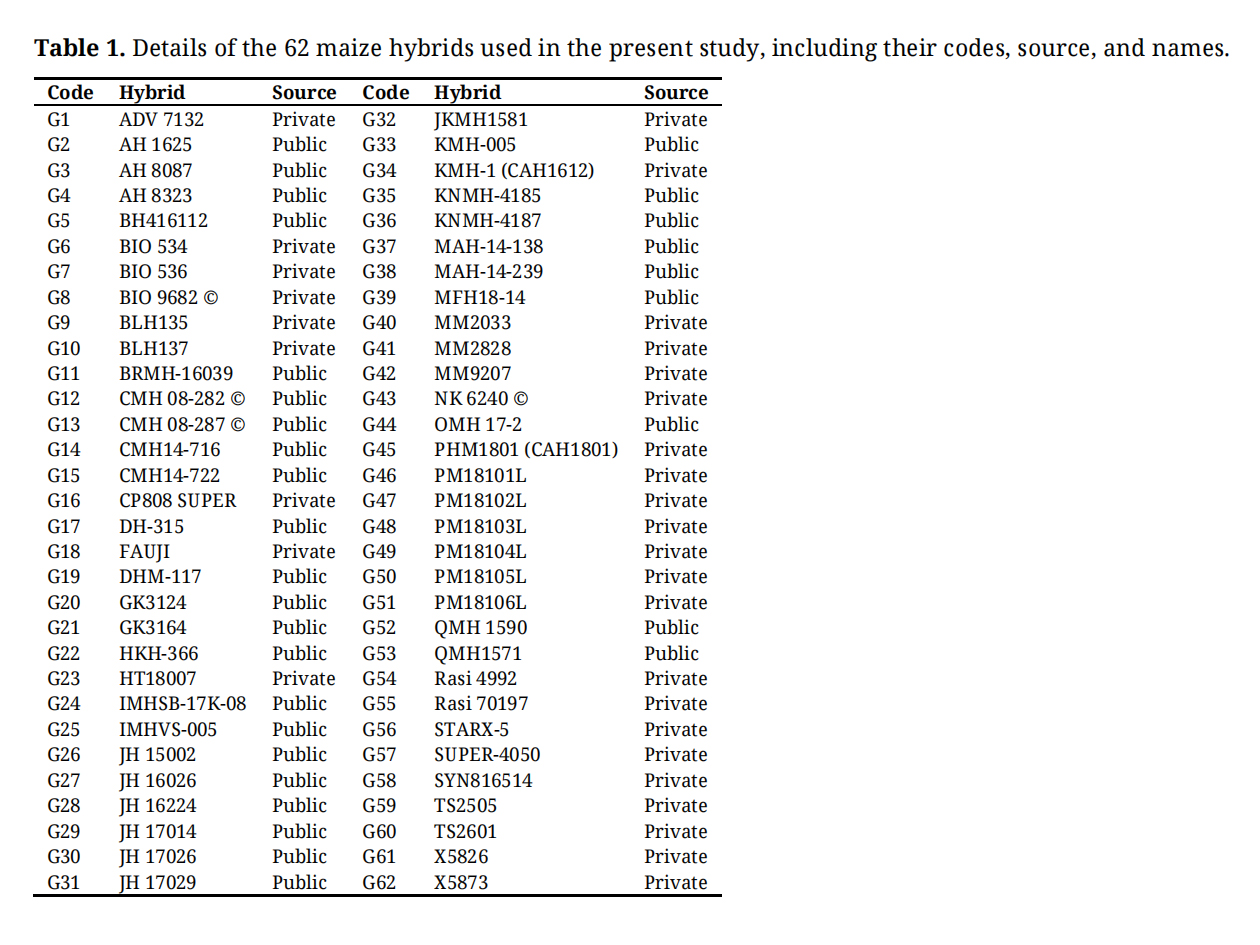 Table 1. Details of the 62 maize hybrids used in the present study, including their codes, source, and names.
A combined analysis was conducted using AMMI to assess the impacts of Hybrid (G), Environment (E), and their interaction (GE) employing Windostat version 9.30 software (Indosat services, Hyderabad, India). Various stability metrics, both parametric and non-parametric, were computed, including regression coefficient (bi), deviation from regression (s2di), Wricks’s ecovalance (Wi2), Shukla’s stability variance (σ2i), Francis and Kannenberg’s Coefficient of Variability (CVi), and Nassar and Huehn’s (S(i)), Kang’s rank-sum (KR), and Thennarasu (NP(i)), detailed information of stability parametres are given in Supplementary Materials Table S2)
These metrics were derived from established formulas proposed by [13,21–27], respectively, utilizing the Stability Soft software. Spearman’s rank correlation was employed to examine the associations among these metrics using Windostat version 9.30 software. To further comprehend the interrelations among the stability metrics, a PCA based on the ranks of stability parameters was executed using XL Stat 2023 (Addinsoft, a French company). For line clustering, a hierarchical cluster analysis was performed based on mean yield and stability measures. The Ward’s clustering method [28], utilizing Euclidean distance as the dissimilarity measure, was adopted, and the discriminant analysis test was employed to ascertain the optimal number of clusters.
The combined ANOVA analysis revealed significant disparities among different hybrids (G) in grain yield, suggesting considerable diversity across the hybrids. Similarly, there were notable differences observed among environmental conditions (E). The interaction between hybrid and environment (G + GE) was highly significant, indicating varied responses of hybrids to different environmental conditions, influenced by both linear and non-linear components affecting grain yield. AMMI analysis showed that environmental factors (E) contributed the most (69.24%) to the total variation, followed by hybrid effects (G) at 16.55%, and G + GE interaction at 9.84%. The significant influence of the non-linear component within the GE interaction underscores its importance in selecting stable hybrids. The large contribution of GE interaction was mainly due to a non-linear component, which is crucial for identifying stable hybrids. Further analysis of this interaction into two principal component axes (PCAs) revealed that PCA I explained 52.27% of interaction variation, while PCA II explained 29.38% (Table 2).
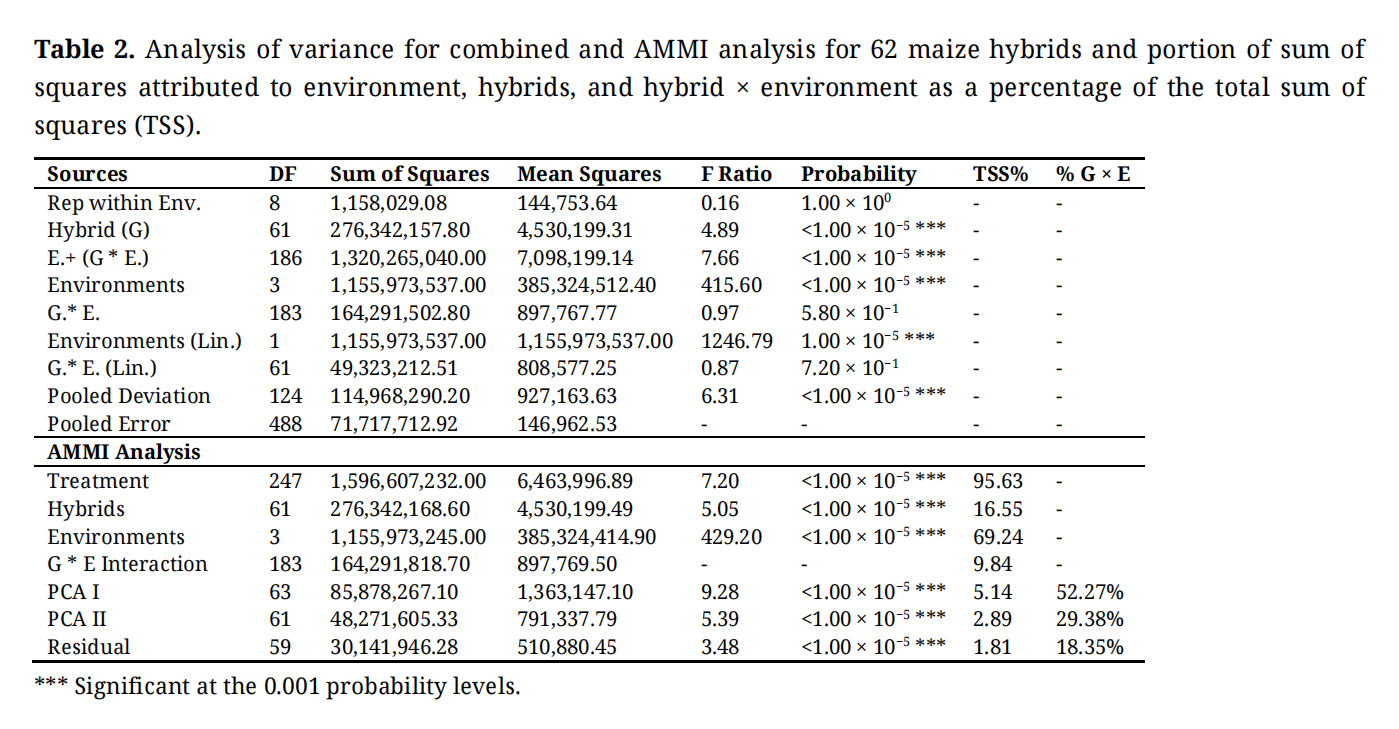 Table 2. Analysis of variance for combined and AMMI analysis for 62 maize hybrids and portion of sum of squares attributed to environment, hybrids, and hybrid × environment as a percentage of the total sum of squares (TSS).
The parametric statistics of stability for grain yield among 62 maize hybrids, as regression coefficient (bi), deviation from regression (s2di), Wricks’s ecovalance (Wi2), Shukla’s stability variance (σ2i), Francis and Kannenberg’s Coefficient of Variability (CVi) outlined are detailed in Tables 3 and 4. In terms of parametric measures, considering the significant main effect of hybrids on grain yield, mean yield was prioritized as the primary parameter for evaluating the hybrids. Among the hybrids tested across four environments, G46, G48, G54, G10, and G49 exhibited the highest mean yields, whereas G22, G38, G11, G53, and G17 showed the lowest. Hybrids with regression coefficients (bi) greater than 1, such as G46, G49, G6, G32, G2, G61, G4, G8, and G7, demonstrated above-average yield performance and adaptation to favourable environments. Conversely, hybrids with bi less than 1, including G22, G11, G17, G52, G37, G42, G24, G19, G15, G34, G16, G56, G3, G5, and G18, exhibited poor adaptation to the environments, possibly favouring harsh conditions. Notably, G26, G30, G2, and G20 among these hybrids showed relatively better yield performance, with bi values close to 1 and low s2di, suggesting suitability even in adverse conditions [29]. Using Wricke’s ecovalance (Wi2) and Shukla’s stability variation (σ2i), G2, G52, G29, G31, G26, and G56 were identified as the most stable hybrids, given their lowest values in these parameters. Additionally, based on the Coefficient of Variation stability statistic (CVi), hybrids G5, G54, G36, and G39 were considered desirable and stable due to their low values.
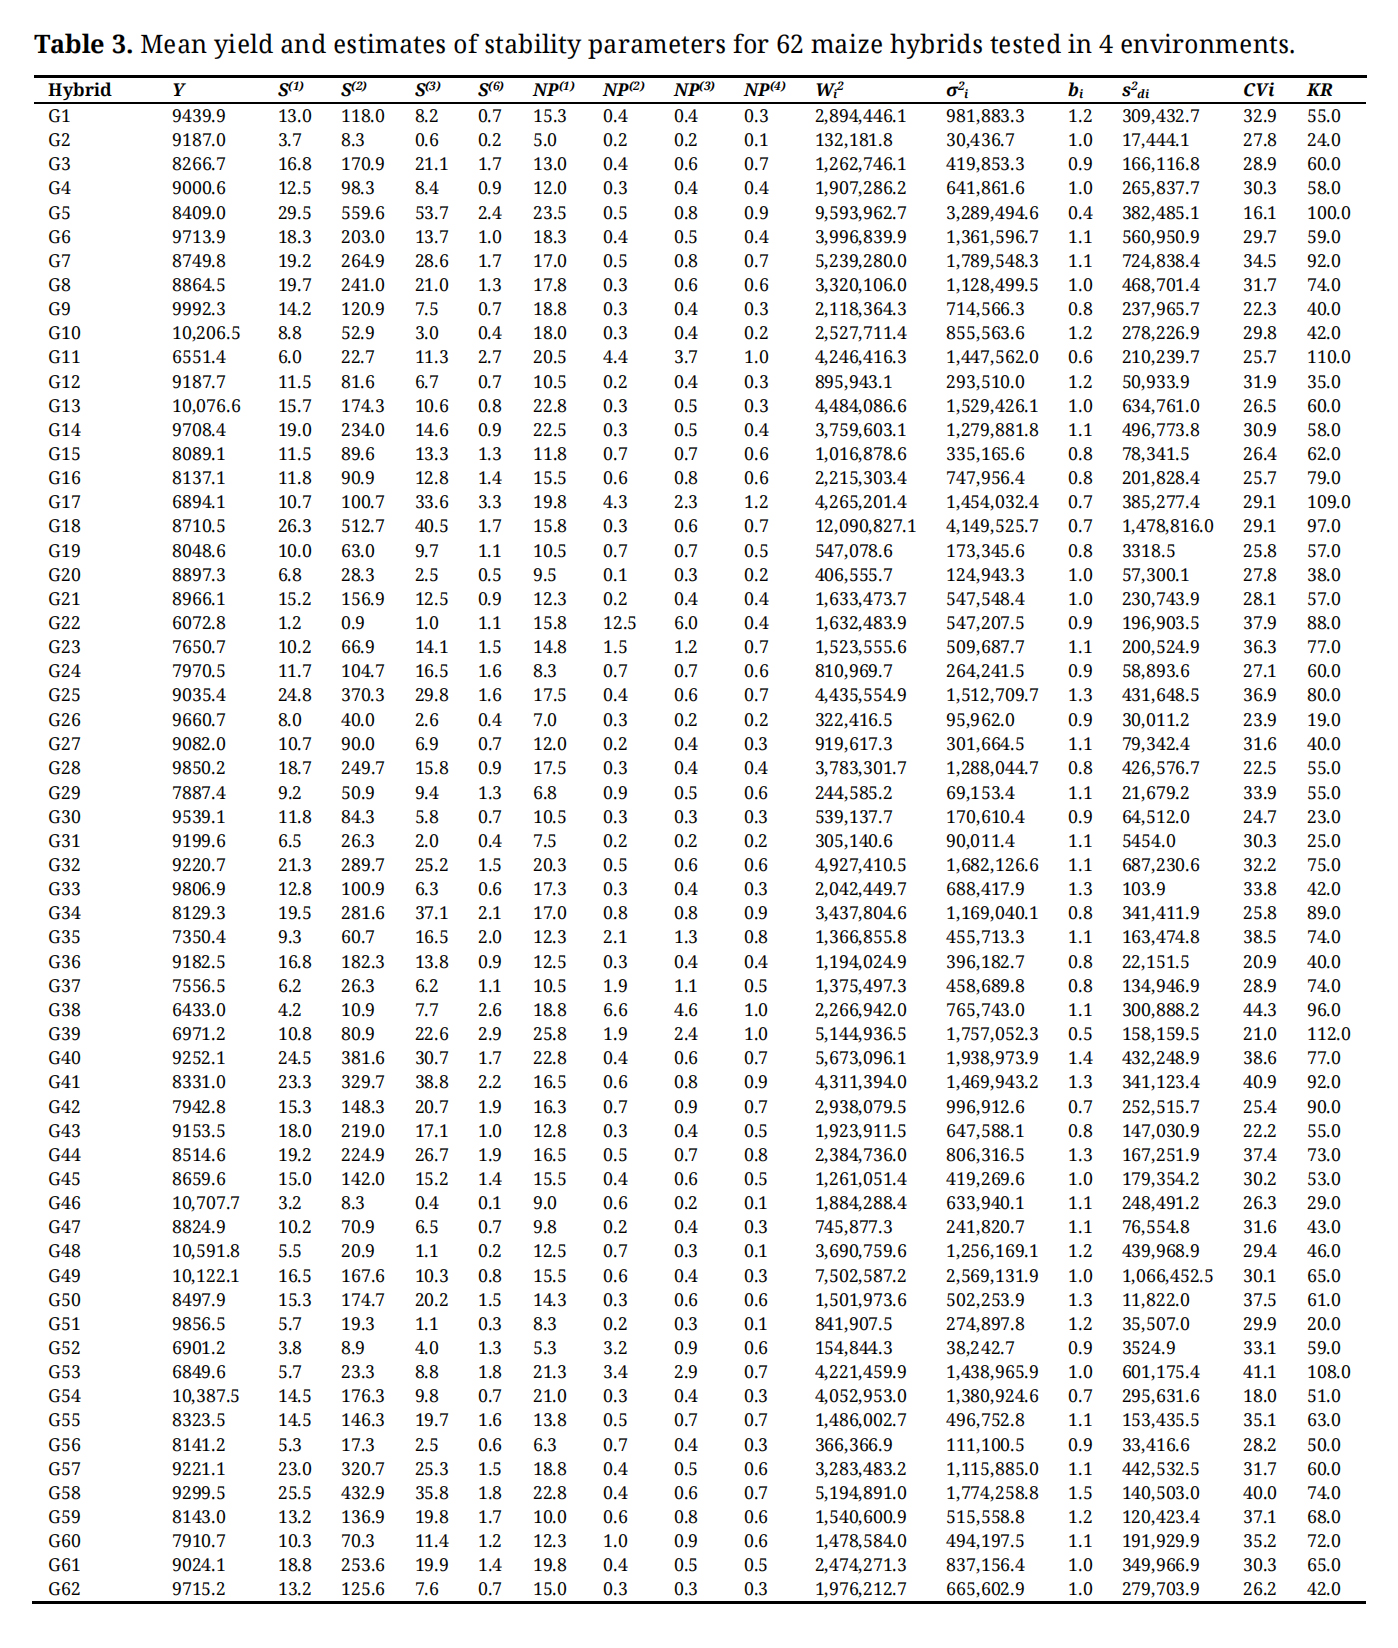 Table 3. Mean yield and estimates of stability parameters for 62 maize hybrids tested in 4 environments.
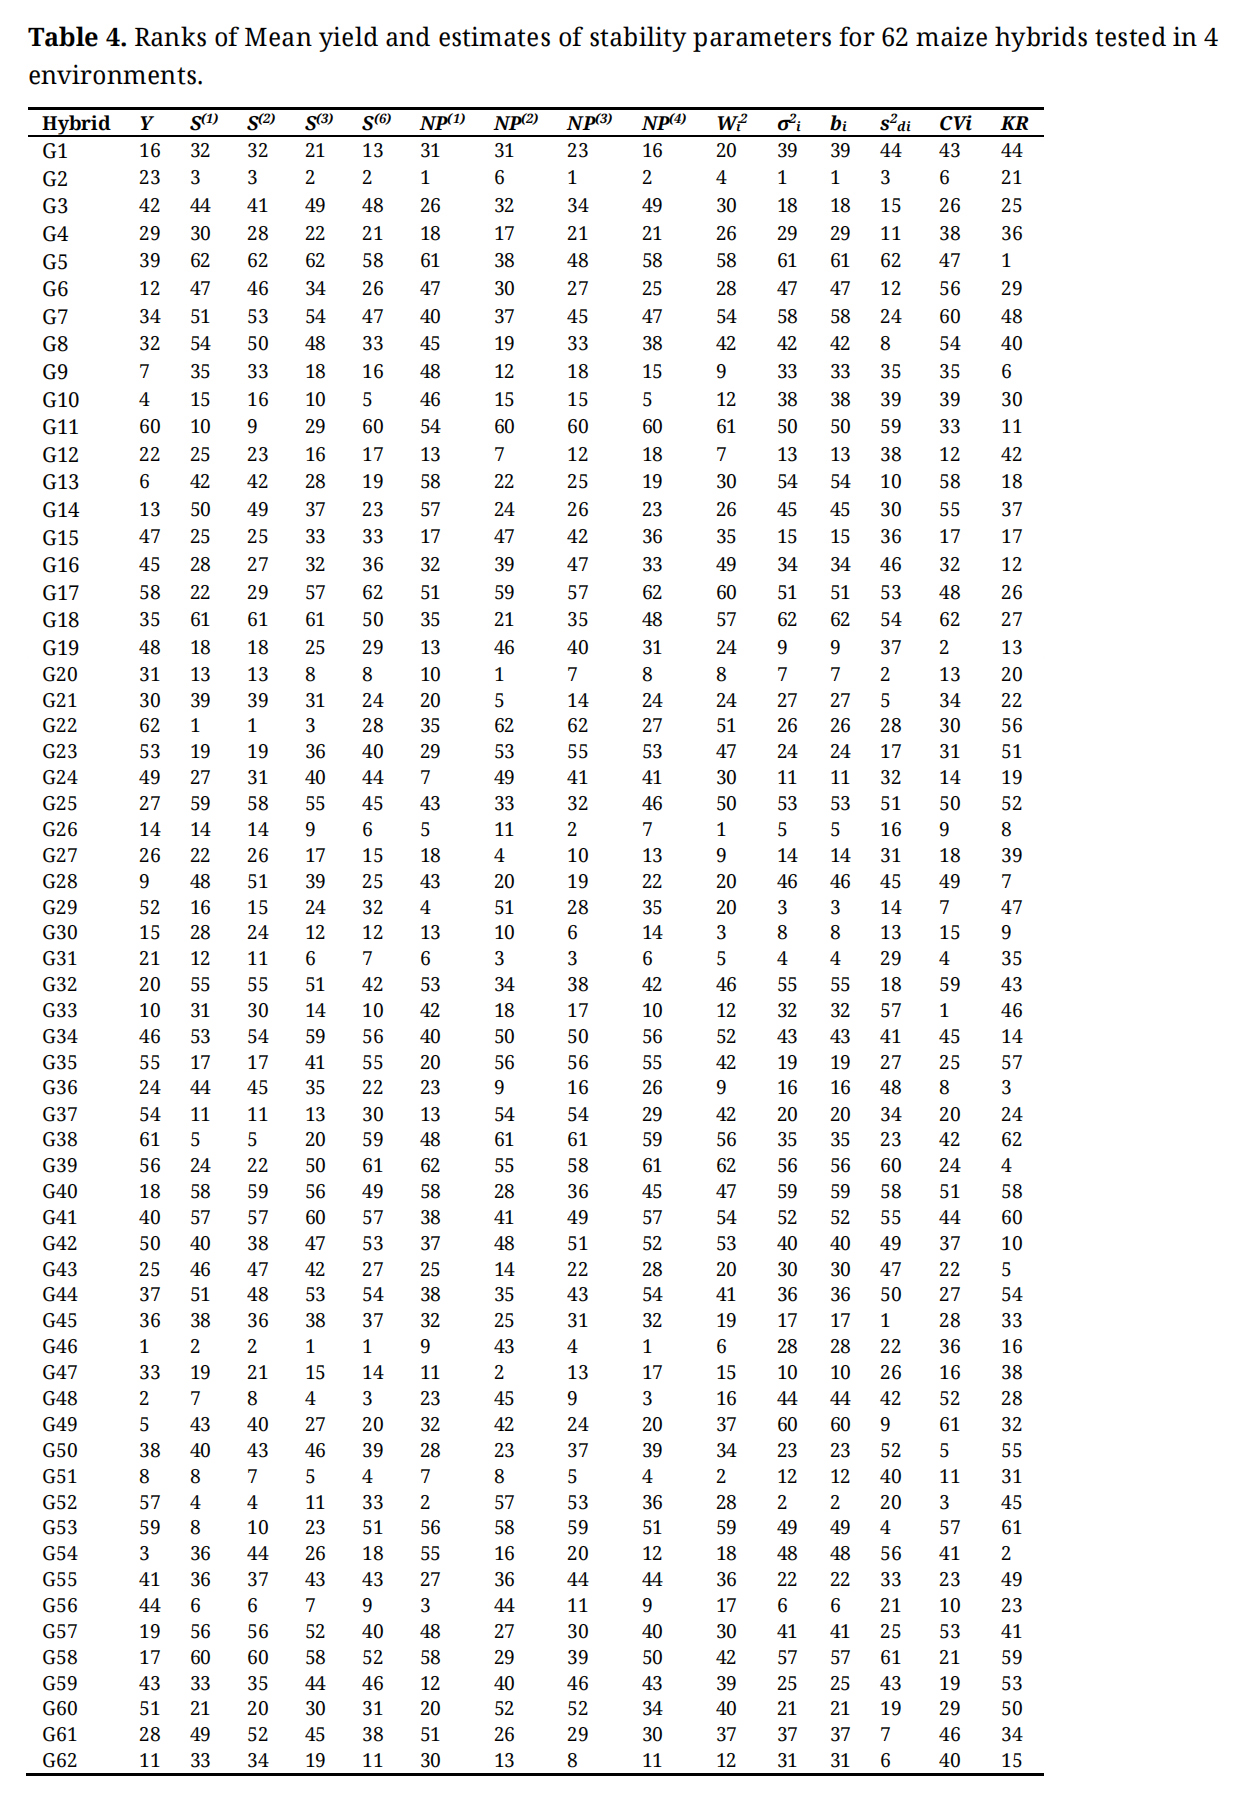 Table 4. Ranks of Mean yield and estimates of stability parameters for 62 maize hybrids tested in 4 environments.
The non-parametric statistics of stability for grain yield among 62 maize hybrids, as outlined by Nassar and Huehn (S(1), S(2), S(3), S(6)), Thennarasu (NP(1), NP(2), NP(3), NP(4)) and Kang (KR), are detailed in Tables 3 and 4. Among these hybrids, G22, G46, G2, G52, and G38 exhibited the lowest values in S(1) and S(2), designating them as desirable, whereas G5, G18, G58, G25, and G40 displayed the highest values, rendering them unstable. Moreover, in S(3), G46, G2, G22, G48, and G51 were found to have the most stable characteristics due to their lowest values, contrasting with the less stable nature observed in G5, G18, G41, G34, and G58. Furthermore, in S(6), G46, G2, G48, G51, and G10 were identified as stable, while G17, G39, G11, G38, and G5 exhibited the highest values, indicating their instability. Lower values in stability statistics signify greater stability. Comparatively, in NP(1), G2 was identified as the most stable, followed by G52, G56, G29, and G26, while G39, G5, G58, and G40 were labelled as unstable due to their higher values. For NP (2), G20 had the lowest values, followed by G47, G31, G27, and G21, suggesting greater stability, whereas G22, G38, G11, G17, and G53 were deemed less stable. Similarly, in NP (3), G22, G38, G11, G53, and G39 exhibited the lowest values, indicating stability, while G6, G18, G10, G12, and G3 were less stable with higher values. NP (4), highlighted G46, G2, G48, G51, and G10 as the most stable, in contrast to G17, G39, G11, and G38, which showed relatively higher values indicating lower stability [30], rank-sum stability measure identified G26, G51, G30, G2, and G31 as stable, whereas G39, G11, G17, G53, and G5 were labelled as unstable based on higher value.
Interrelationship among Parametric and Non-Parametric MethodsThe study investigates the relationship between mean yield and a variety of stability metrics, categorized into parametric (Wi2, σ2i, bi, s2di, CVi) and non-parametric indicators (S(1), S(2), S(3), S(6), NP(1), NP (2), NP(3), NP(4), KR), as outlined in (Table 5). Our analysis reveals a significant positive correlation between mean yield and several stability measures (S(6), NP(2), NP(3), NP(4), KR) at a stringent significance level of p < 0.01. Additionally, a noteworthy positive association was found between S(3) and CVi at p < 0.05. Conversely, we observed a pronounced, significant negative relationship with S(1), S(2) at p < 0.01, and with Wi2, σ2i, s2di at p < 0.05. Similar findings have been reported by [17] in barley, [31] in durum wheat, and [11], who observed a positive and significant association between mean yield and stability metrics such as S(3), S(6), NP (2), NP(3) and NP(4). Likewise, [32], in their study on grass pea, reported a significant negative correlation between mean yield and S(1) and S(2)
Intriguingly, S(1) and S(2) not only exhibit a significant positive inter-correlation but also maintain a positive linkage with other stability metrics (S(3), S(6), NP (1), NP(4), KR, Wi2, σ2i, bi, s2di), notwithstanding their significant negative correlation with mean yield (Y) and CVi. S(3), emerges as positively correlated with mean yield and all other stability metrics, except for CVi. Moreover, S(6), NP(4), and KR stand out for their significant positive correlation with both mean yield and the entire spectrum of stability metrics under evaluation. NP(2) is distinctively characterized by its negative correlation with S(1) and S(2), while it upholds a positive relationship with the rest of the metrics. NP(3), conversely, aligns positively with all other metrics, except for S(1) and S(2), with which it shows no significant correlation.
From a parametric standpoint, Wricke’s ecovalence (Wi2), Shukla’s stability variance (σ2i), and deviation from regression (s2di) are all positively interrelated and also share positive correlations with most stability measures, except CVi, with which they are negatively correlated relative to mean yield. The regression coefficient (bi) demonstrates a significant positive correlation across all non-parametric and parametric metrics. The coefficient of variation (CVi) uniquely correlates significantly with mean yield, S(6), NP (2), NP(3), and KR, underscoring its relevance in the context of yield stability analysis.
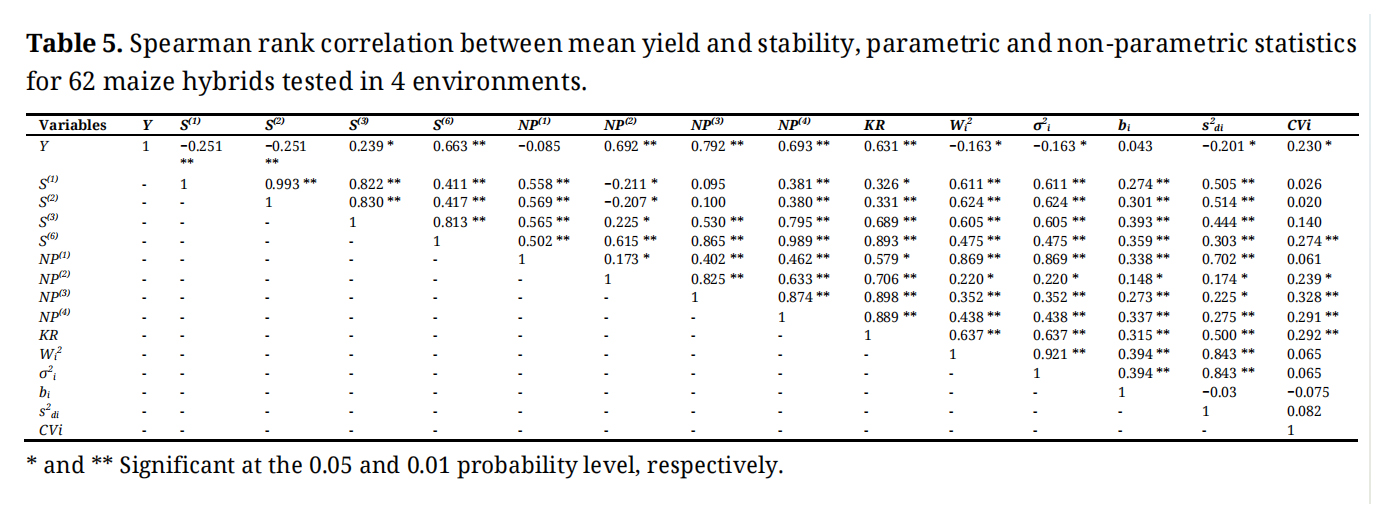 Table 5. Spearman rank correlation between mean yield and stability, parametric and non-parametric statistics for 62 maize hybrids tested in 4 environments.
To explore the connections, distinctions, and parallels between parametric and non-parametric statistics, we conducted PCA utilizing the rank correlation matrix. The initial two principal components elucidated 49.43% and 24.11% of the total variation concerning the ranks of mean grain yield and stability parameters, respectively. The PC1 versus PC2 was used to produce the biplot illustrated in Figure 1. The resulting biplot, depicted in Figure 1, showcases the positioning of variables in the PC1 versus PC2 space. Group I includes mean yield, S(6), NP (2), NP(3), S(6), KR, and CVi, suggesting a preference for selection based on these parameters. This group aligns with the dynamic concept of stability and is associated with genotypic mean yield. In agreement with this finding, [11] observed in their study on barley that the average yield, Kang’s rank-sum, two statistics proposed by Nassar and Huehn (S(3) and S(6)), along with three of Thennarasu's statistics (NP (2), NP(3), and NP(4)), clustered together on the biplot. These parameters were categorized as group III, indicating their joint influence by both mean yield and stability. This group aligns with the dynamic concept of stability and is associated with genotypic mean yield. Group II, positioned between Groups I and III, comprises S(3) and bi. Notably, S(3) exhibits a significant correlation with mean yield, while bi lacks any discernible relation to mean yield. Group III encompasses the statistics of NP1, Wi2, σ2i, and s2di, offering insights into stability within the static concept. Significantly, this group demonstrates a notable negative correlation with genotypic mean yield. Similar vein, [29] observed the enduring stability of the NP1 Wi2, σ2i, s2di parameters in durum wheat MET.
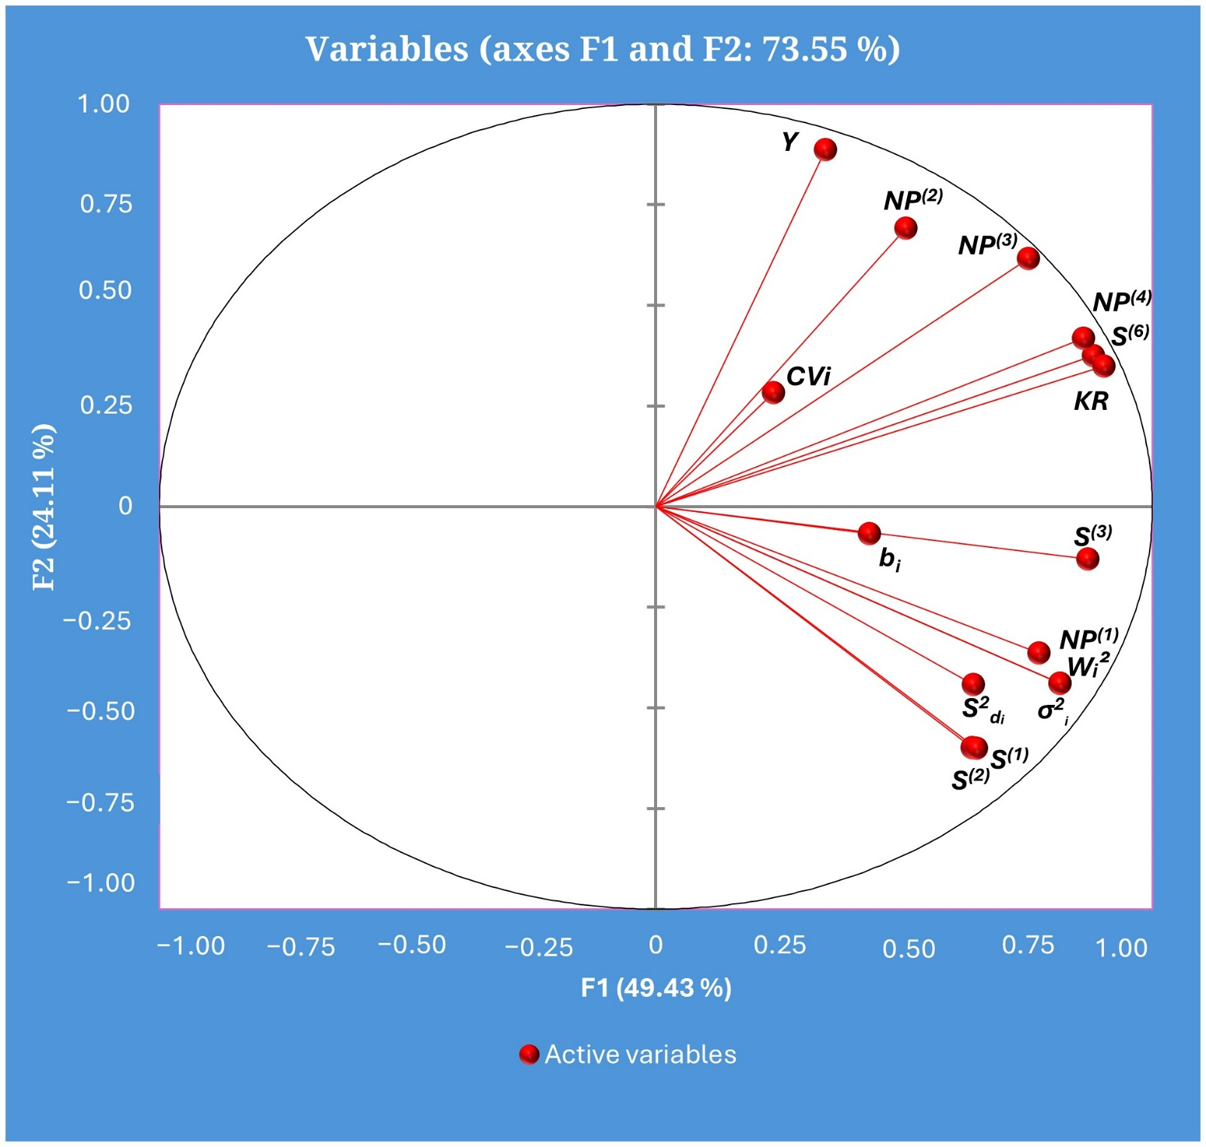 Figure 1. Biplot of PCA1 versus PCA2 for different parametric and non-parametric measures of stability. GY; Wi2; σ2i; bi; CVi; s2di; S(1), S(2), S(3), S(6); NP(1), NP (2), NP(3), NP(4) ; KR: Mean Grain Yield; Wricks’s ecovalance; Shukla’s stability variance; regression coefficient of Eberhart and Russell; Francis and Kannenberg’s Coefficient of Variability; deviation from regression (Eberhart and Russell); Nassar and Huehn’s nonparametric stability statistics; Thennarasu’s Non-Parametric stability statistics and Kang’s rank-sum respectively.
The methods employed in our investigation to assess stability did not offer a comprehensive insight into how individual hybrids respond to varying environmental conditions. Certain hybrids exhibited stability according to certain parameters while showing instability according to others. This issue aligns with findings from prior studies on hybrid-environment interaction [17,33]. A novel strategy to address the inherent variability in hybrid responses was the categorization of hybrids into distinct, qualitatively similar stability groups via cluster analysis, a method supported by [15,33]. This approach facilitated a more structured understanding of hybrid performance across varying conditions. In this vein, the analysis successfully classified 62 maize hybrids into five distinct clusters as shown in (Figure 2, Supplementary Material Table S3). Significantly, Cluster I emerged as a group of high-yielding hybrids, characterized by moderately stable performance across environments (with stability parameter sum ranks between 200 and 444). This suggests a potential for specific environmental adaptations among these hybrids. Notably, hybrids G46, G48, and G10, which are among the top performers in terms of grain yield (ranked 1, 2, and 4, respectively), were grouped within this cluster, indicating their robustness in certain conditions.
Conversely, Cluster V encapsulated high-yielding hybrids G49, G13, and G28 (ranked 5, 6, and 9, respectively, in mean yield) but with a propensity towards instability, as indicated by higher values in both parametric and non-parametric stability statistics (sum ranks spanning 443 to 710). This suggests these hybrids are less consistent across different environmental conditions. Clusters III and IV consisted of lower-yielding hybrids, yet they exhibited higher stability statistic values (with sum ranks of 351–654 for Cluster III and 526–778 for Cluster IV), suggesting a complex relationship between yield performance and stability across environments.
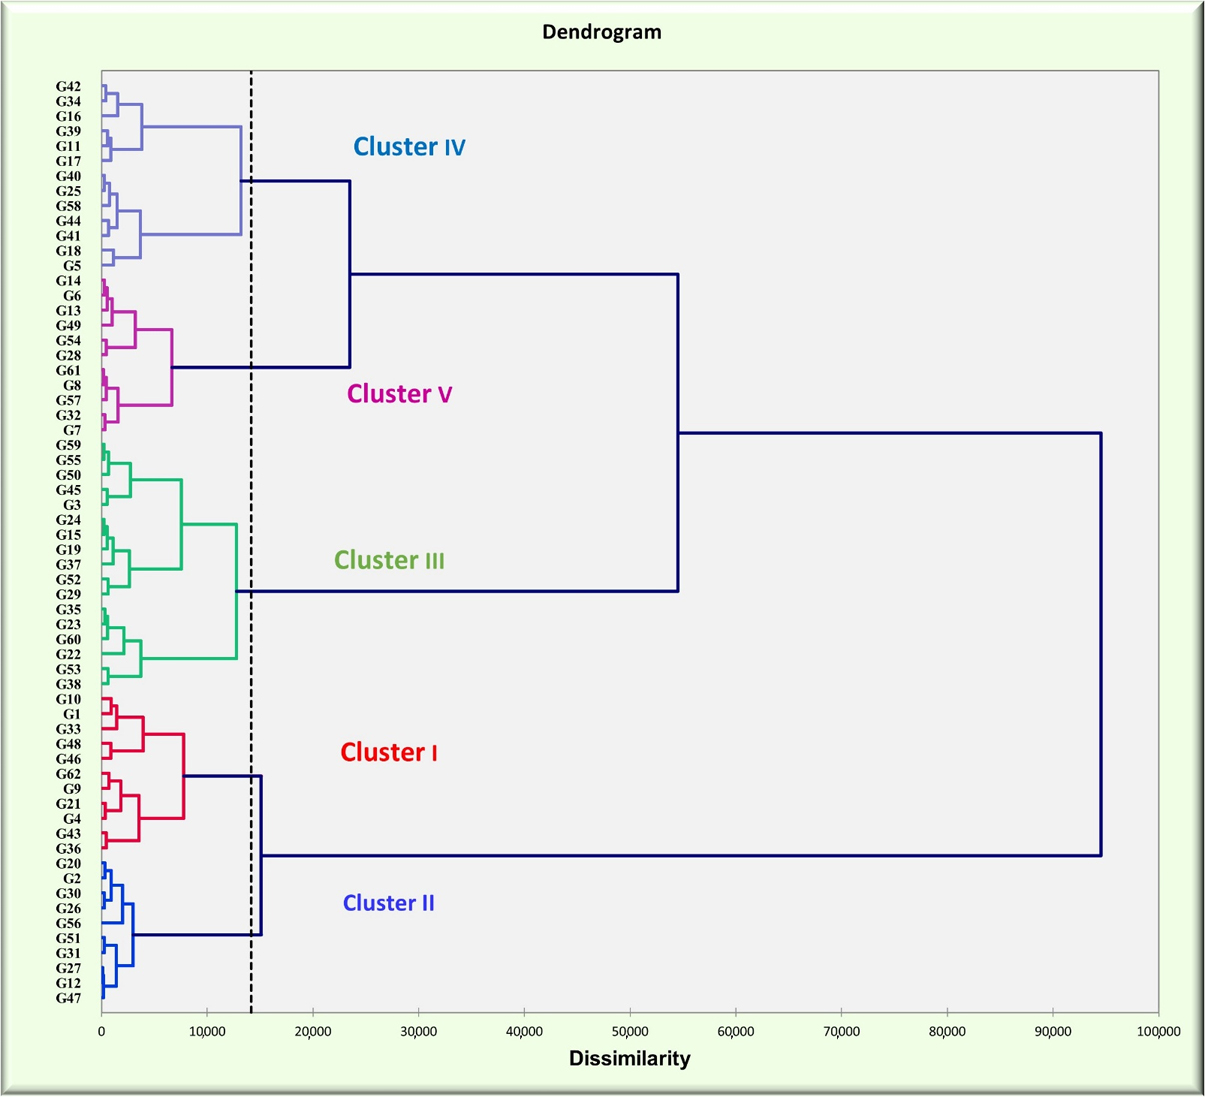 Figure 2. Dendrogram showing hierarchical classification of 62 maize hybrids based on ranks of mean yields and parametric and non-parametric statistics.
Cluster II distinguished itself by assembling a selection of hybrids that span intermediate to high yield potentials (G51, G26, G30, G31, G12, G2, G27, G20, G47, and G56), which are ranked 8, 14, 15, 21, 22, 23, 26, 31, 33 and 44 respectively in terms of mean yield. Despite this rank, they also exhibited lower stability statistic values (sum ranks between 79 and 362), signalling a robust level of stability across varied environments. This trait earmarks these hybrids as invaluable resources for bolstering adaptability within maize breeding endeavours, highlighting their potential to contribute significantly to the development of more resilient and versatile maize varieties.
Our investigation elucidates the intricate relationship between parametric and non-parametric statistics in maize cultivation, employing PCA and cluster analysis. Our findings underscore the critical role of parameters, such as mean yield, NP (2), NP(3), NP(4), S(6), KR, and CVi, in hybrid selection due to their association with dynamic stability and mean yield. Notably, hybrids G51, G26, G30, G31, G12, G2, G27, G20, G47, and G56, characterized by their high yield potential and low stability statistic values, are indicative of consistent stability across various environmental conditions.
The following supplementary materials are available online, Table S1: Agro-climatic characteristics of environments in yields stability experiments for 62 maize hybrids. Table S2: Details of Parametric and non-parametric methods. Table S3: Sum Ranks of Stability parameters, Rank of Grain yield, Genotypic Code according to dendogram of 62 maize hybrids.
All data generated from the study are available in the manuscript or supplementary files.
Conceptualization, SN and JB; methodology, JB; software, JB; validation, SN and JB; formal analysis, DA and JB; investigation, SN, JB, NKMV, BD, VK, RMK, SD and RKP; resources, SN; data curation, SN and JB; writing—original draft preparation, JB and SN; writing—review and editing, SN, JB, NKMV, BD, VK, RMK, SD and RKP; visualization, SN, JB; supervision, SN; project administration, SN; funding acquisition, SN. All authors have read and agreed to the published version of the manuscript
The authors declare that they have no conflicts of interest.
This research was funded by Director of ICAR-IIMR (Indian Council of Agricultural Research-Indian Institute of Maize Research), Ludhiana.
The authors are thankful to the Director, ICAR-IIMR, Ludhiana, and Project Coordinator AICRP on Maize for providing the necessary facilities and support for carrying out the above work. The authors also acknowledge the material used in the present study, comprising both the private and public sectors.
1.
2.
3.
4.
5.
6.
7.
8.
9.
10.
11.
12.
13.
14.
15.
16.
17.
18.
19.
20.
21.
22.
23.
24.
25.
26.
27.
28.
29.
30.
31.
32.
33.
Neelam S, Bhoga J, Mallela Venkata NK, Dharavath B, Kumari V, Kachhapur RM, et al. Navigating hybrid-environment interaction in maize evaluation: Parametric and non-parametric insights. Crop Breed Genet Genom. 2025;7(3):e250008. https://doi.org/10.20900/cbgg20250008.

Copyright © Hapres Co., Ltd. Privacy Policy | Terms and Conditions