Location: Home >> Detail
Crop Breed Genet Genom. 2025;7(4):e250016. https://doi.org/10.20900/cbgg20250016
 ,
Shruthi H. Belliappa 1 ,
Naresh Bomma 1 ,
Mahesh Pujar 1 ,
Anilkumar Vemula 1 ,
Sunil S. Gangurde 1 ,
Manish K. Pandey 1 ,
Victor O. Adetimirin 2,3 ,
Prakash I. Gangashetty 1,*
,
Shruthi H. Belliappa 1 ,
Naresh Bomma 1 ,
Mahesh Pujar 1 ,
Anilkumar Vemula 1 ,
Sunil S. Gangurde 1 ,
Manish K. Pandey 1 ,
Victor O. Adetimirin 2,3 ,
Prakash I. Gangashetty 1,*
1 International Crops Research Institute for the Semi-Arid Tropics, Hyderabad 502324, Telangana, India
2 Pan African University Life and Earth Sciences Institute (PAULESI), University of Ibadan, Ibadan 200001, Nigeria
3 Department of Crop and Horticultural Sciences, University of Ibadan, Ibadan 200001, Nigeria
* Correspondence: Prakash I. Gangashetty
Pigeonpea is an important legume cultivated in more than 25 tropical and sub-tropical countries, either as sole or as inter crop with finger millet, sorghum, pearl millet, maize or even with short duration legumes. It offers a rich source of variability in the form of wild species and germplasm, which could be used for brining favorable alleles for disease resistance and good agronomic traits. Pigeonpea [Cajanus cajan (L.) Millsp.] 248 reference set accessions were evaluated in an augmented design for assessing genetic variability and diversity for important agronomic attributes at ICRISAT, Patancheru. The morphological characterization revealed significant genetic variability among the accessions for traits studied, as shown by the significant (p < 0.0001) mean squares for the six traits through the analysis of variance (ANOVA). High heritability estimates (>70%) for all the six traits indicated that the selection can be highly responsive. Principal component analysis (PCA) identified key traits contributing to variability, with the first three components explaining 84.30% of the total variance. Cluster analysis based on morphological traits delineated six distinct groups, highlighting the diversity within the germplasm. Molecular characterization using 52,863 high-quality SNPs provided further insights into genetic diversity. The SNP analysis revealed moderate levels of polymorphism (average PIC = 0.36) and genetic diversity (mean He = 0.37). Population structure analysis suggested the presence of four main sub-populations (K = 4) with varying degrees of admixture. Analysis of Molecular Variance (AMOVA) indicated that the majority of genetic variation (87.01%) was found within populations, with moderate genetic differentiation (FST = 0.13) between the populations. The study identified several genetically distinct accessions that could serve as valuable resources for broadening the genetic base in pigeonpea breeding programs. These findings provide crucial insights for germplasm conservation, targeted breeding efforts, and the exploration of genetic diversity in pigeonpea, potentially leading to the development of more resilient and productive varieties.
Pigeonpea [Cajanus cajan (L.) Millsp.] is an important leguminous crop cultivated for its nutritional value and for its vital role in sustainable agriculture due to its nitrogen-fixing ability that improves soil fertility [1,2]. As a versatile crop, pigeonpea plays a crucial role in food security, especially in semi-arid and tropical regions [3]. Additionally, pigeonpea provides economic benefits to smallholder farmers through grain, fodder, and fuelwood production. Despite its importance, the crop faces challenges such as yield plateau [4], susceptibility to pests like pod borers, and prone for abiotic stress like waterlogging, terminal drought due to less exploration of genetic diversity. To counter this, researchers focused on revealing hidden variations within germplasm reservoirs or generating new alleles and haplotypes absent in existing crop gene pools, as highlighted by [5]. Addressing this issue and promoting conservation efforts, along with ensuring the availability of high-quality parental lines to enhance its utilization, underscores the urgent need for additional research on pigeonpea diversity. The genetic diversity present within pigeonpea germplasm holds immense potential for crop improvement and enhanced utilization [6]. Morphological and molecular characterization of pigeonpea genotypes is essential for understanding the genetic variability, trait inheritance, and breeding potential within the crop species. Such characterization enables breeders and researchers to identify superior genotypes, assess trait heritability, and develop improved varieties with desirable agronomic traits.
Advancements in molecular biology have transformed the characterization of crop plants, including pigeonpea. SNPs are ubiquitous and useful markers for measuring genetic variation in crops. Array-based SNP genotyping and genotyping-by-sequencing (GBS) allow for high-throughput, inexpensive genome-wide diversity study. By using high-density SNP data, these methods enable accurate assessment of the genetic connections between accessions [7]. SNP markers are useful for locating genetic clusters, subgroups, and population structure in germplasm collections [8]. In the end, SNP-based diversity analysis aids in the selection of genetically different parental lines for hybridization, resulting in the development of improved pigeonpea varieties with increased yield, disease resistance, and stress tolerance.
Several studies have been conducted to assess the genetic diversity among pigeonpea genotypes, aiming to identify superior genotypes for improving agronomic traits or adaptability. These studies focused on mini-core collections [9] germplasm [10], landraces [11], and breeding lines [12]. However, the present study includes diverse pigeonpea accessions from pigeonpea reference set sourced from the ICRISAT gene bank. This set represents global collection capturing genetic variation for morpho-physiological traits. This paper provides a comprehensive morphological and molecular characterization of pigeonpea genotypes, aiming to enhance their utilization in breeding programs. Through a combination of phenotypic and genotypic analyses, we aim to elucidate the genetic diversity and population structure within the pigeonpea germplasm.
The experimental material comprised 248 pigeonpea accessions forming a reference set, sourced from the Rajendra Singh Paroda Gene Bank at ICRISAT, Hyderabad, India. This reference set was designed to capture the global genetic diversity of the crop. The panel originated from 28 different countries, and its composition is detailed in Supplementary Table S1.
Field TrialThe field trial was conducted during rainy 2022–2023, at the International Crops Research Institute for the Semi-Arid Tropics (ICRISAT), located at 17.51°N, 78.27°E, 545 meters above sea level in India. The average rainfall was 165 mm and the average minimum and maximum temperatures during the rainy crop season were 31 °C and 19 °C, respectively. The experimental setup employed an augmented randomized complete block design comprising 26 blocks, with every block having entries alongside repetitive checks. The checks included high-yielding, disease-resistant varieties such as ICPL87119 (Asha) and TS3R, which are resistant to fusarium wilt and sterility mosaic disease. Each accession was sown in a 1.5 m single row spaced 0.75 m by side. Thiram-coated seeds were used to ensure effective control of seedborne and soilborne diseases. Six hills per accession were sown with two seeds each and subsequently thinned to a single plant per hill two weeks after emergence. All cultural practices adhered to the standards set by ICRISAT. A basal dose of 3.65 kg of diammonium phosphate (18% N and 46% P) was applied at the time of field preparation, and 1.82 kg of urea (46% N) was applied as top dressing within 7 days after thinning.
The entries were harvested at maturity, and the pods were sun-dried to reach optimum moisture before subjecting them to threshing, thus recovering seeds per pod for every trial entry. The observations were recorded on five representative plants in each plot for traits like days to 50% flowering (DF), days to maturity (DM), plant height (PH) (cm), number of primary branches per plant (PB), 100-seed weight (100 SW) (g), and seed yield (SY) (kg/ha) following IBPGR-ICRISAT (1993) descriptors recommendation.
Molecular Characterization DNA ExtractionA total of 248 elite pigeonpea accessions were initially selected from the ICRISAT gene bank to study both molecular and morphological diversity. For molecular characterization, a subset of 185 accessions was selected from this reference set based on the availability of high-quality genetic data at the ICRISAT Genomic Lab. Young leaves from these accessions were collected for DNA extraction, which was carried out using the NucleoSpin Plant II kit (Macherey-Nagel) according to the manufacturer’s protocol. The quality and integrity of the extracted DNA were assessed through 0.8% agarose gel electrophoresis, while the DNA quantification was performed using a Qubit 2.0 Fluorometer (Life Technologies Thermo Fisher Scientific Corp. Waltham, Massachusetts, USA)
SNP Marker AnalysisGenotyping was conducted using the Axiom Cajanus SNP array, developed from the resequencing data of 104 pigeonpea lines. This SNP array, consisting of 56,512 sequence variations (56,127 SNPs and 385 InDels), was selected through a rigorous filtering process employing the Axiom GTv1 algorithm (http://www.affymetrix.com/estore/partners programs/programs/developer/tools/powertools. Accessed on 6 Feb 2025). High-quality DNA samples (20 μL of 10 ng μL−1) from each accession were processed using the Affymetrix Axiom 2.0 protocol, involving DNA amplification, fragmentation, hybridization, single-base extension, and signal amplification. The genotyping was performed on the Affymetrix GeneTitan platform, and the resulting. CEL files were analyzed using Axiom Analysis Suite version 1.0 (Affymetrix Power Tools, Santa Clara, CA, USA).
Statistical Analysis Morphological Data AnalysisThe data on plant morphology were collected according to the pigeonpea descriptors proposed by the International Board for Plant Genetic Resources [13]. ANOVA was performed using the PROC .GLM procedure of SAS 2010 software Version 9.2 [14] to determine the significance of mean differences among accessions. Significant differences were further analyzed by Duncan’s Multiple Range Test (DMRT) at p < 0.05 and p < 0.01 levels. PCA reduced data dimensionality and identified key variables contributing to variation using the PRINCOMP procedure [14]. Cluster analysis in SAS grouped similar accessions based on the morphological traits evaluated [14]. These analyses elucidated morphological variation among pigeonpea accessions and identified potential patterns or clusters within the dataset.
Broad-sense heritability (hBS) was estimated according to Allard’s method [15]. PCA was conducted and resulting principal components (PCs) with eigenvalues greater than one were retained, aligning with Jeffers [16]. The data underwent analysis using Mahalanobis D2 statistic [17], and clustering was performed using Tocher’s method, as advised by Rao [18].
Molecular Data AnalysisSNP calling and initial quality control were conducted using the Axiom Analysis Suite version 1.0 (http://media.affymetrix.com/support/downloads/manuals/Axiom_analysis_suite_user_guide.pdf. Accessed on 4 Feb 2025). The best-practices workflow was used for sample quality control, followed by the genotyping workflow for analyzing .CEL files. The summary-only workflow was then employed to export SNP data for subsequent analyses. The SNP data were aligned with the reference genome of the pigeonpea variety Asha (ICPL87119), as detailed in the study available at this link (https://acsess.onlinelibrary.wiley.com/doi/full/10.3835/plantgenome2018.01.0005. Accessed on 4 Feb 2025). Following quality control, SNP markers were filtered based on criteria such as minor allele frequency (MAF) and call rate, resulting in a refined dataset for genetic analysis. Population structure was analyzed using STRUCTURE 2.3.4 software (Pritchard Lab, Stanford University, California, United States). The analysis was run with the following parameters: MCMC—10000, Burnins—10000, iterations—4, and assumed K values ranging from 2 to 10 [19]. A phylogenetic tree was constructed using TASSEL version 5.0 (Biotechnology Bldg Ithaca, New York, NJ, USA), employing the Neighbor-joining distance matrix method [20]. AMOVA was conducted using the adegenet and poppr packages in R studio. Populations for this analysis were defined based on the K values obtained from the STRUCTURE analysis [19,21,22]. Genetic diversity parameters were calculated using TASSEL version 5.0 [20]. The SNP density plot was generated using SR plot software (https://www.bioinformatics.com.cn/. Accessed on 4 Feb 2025). Transitions and transversions were identified and counted using TASSEL version 5.0 [20].
The ANOVA revealed highly significant genetic variability (p < 0.0001) among the 248 pigeonpea accessions for all traits (Table 1), underscoring the panel’s rich diversity and strong potential for selection. The lack of a significant difference between the new accessions and the check varieties, when considered alongside this high internal genetic variation, is a common and favorable finding in germplasm evaluation. It indicates that the check varieties represent a competitive benchmark within the mid-range of the population’s performance, rather than an unattainable ceiling. This genetic architecture is well-documented in pigeonpea, where large germplasm collections often show performance parity with checks on average while simultaneously harboring individual elite genotypes that surpass them. Therefore, this result does not diminish the value of the collection but precisely defines its utility: the subsequent identification of top-performing accessions from this diverse and competitive pool will provide excellent candidates for future breeding programs. Furthermore, the significant block effects for PH and PBvalidate the use of the augmented design, confirming its effectiveness in controlling field spatial variation to obtain precise genetic estimates.
Mean PerformanceThe mean performance of the 248 pigeonpea test entries revealed substantial variation for all agronomic traits (Table 2). DF varied from 51 to 181 days with a mean of 97 days, while DM ranged from 85 to 184 days, averaging 145 days. PH exhibited a wide range from 70 to 280 cm, with a mean of 166 cm. The number of PB varied considerably from 1 to 34, averaging 13.88. Similarly, 100 SW ranged from 5.4 g to 31.6 g, with a mean of 10.54 g. SY demonstrated the most extensive variation, ranging from 11 to 2838 kg/ha, with a mean of 935.29 kg/ha. Analysis of the relative contribution of each trait to the total genetic diversity revealed that SY was the predominant factor, accounting for 43.98% of the variation. This was followed by PH (16.52%) and days to flower (13.37%), while 100 SW, number of branches, and DM contributed 10.37%, 8.15%, and 7.61%, respectively. Notably, specific genotypes emerged as top performers for key traits: ICP6370 for its early flowering and compact PH, ICP16342 for the earliest maturity, ICP14604 for the highest number of PB, ICP13253 for the greatest 100 SW, and ICP9891 as the highest yielder. The heritability in the broad sense (h²BS) was high (>77%) for all traits studied. This indicates that a high proportion of the observed phenotypic variance is attributable to genetic factors, suggesting that selection based on phenotypic performance would be highly effective for the genetic improvement of these traits in this germplasm panel.
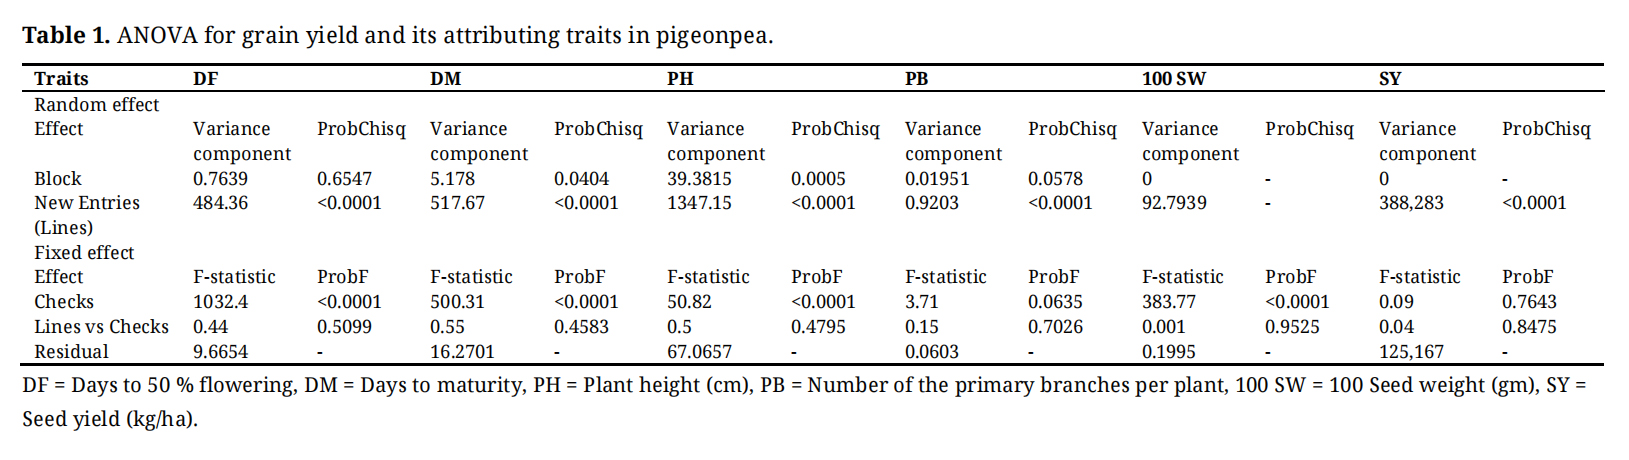 Table 1. ANOVA for grain yield and its attributing traits in pigeonpea.
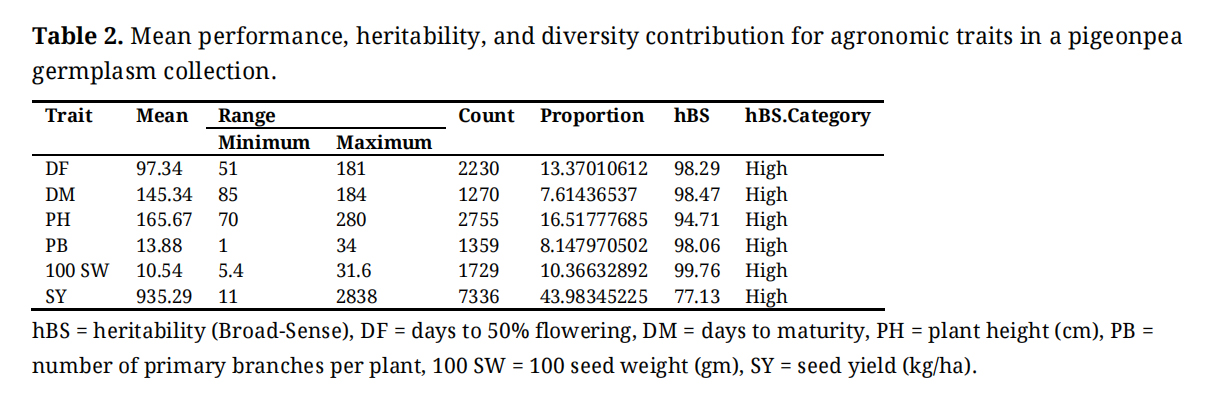 Table 2. Mean performance, heritability, and diversity contribution for agronomic traits in a pigeonpea germplasm collection.
PCA was performed based on six agronomic traits to elucidate the underlying structure of genetic diversity in the pigeonpea germplasm (Table 3). The first three principal components (PC1, PC2, and PC3) collectively explained 84.3% of the total phenotypic variance, indicating their sufficiency in capturing the majority of the variability within the dataset. PC1, which accounted for 37.79% of the total variance (eigenvalue = 2.267), was predominantly influenced by DF, DM, and PH, with all traits exhibiting strong negative loadings. This component primarily represents a gradient in phenology and plant stature. PC2, explaining 29.12% of the variance (eigenvalue = 1.757), was strongly and positively associated with the yield components PB and 100 SW, highlighting their independent and critical role in shaping diversity. PC3, with a 17.39% contribution (eigenvalue = 1.043), was overwhelmingly driven by SY, underscoring its significant and unique impact on the overall variation. The remaining components (PC4 to PC6) each accounted for less than 10% of the variance, capturing minor, trait-specific variations. The relationships between traits were further clarified by their loadings. The strong, concordant negative loadings for DF, DM, and PH on PC1 indicate a positive correlation among these phenological and structural traits. Conversely, the independent contributions of PB and 100 SW to PC2, and SY to PC3, suggest these yield-related traits are genetically independent.
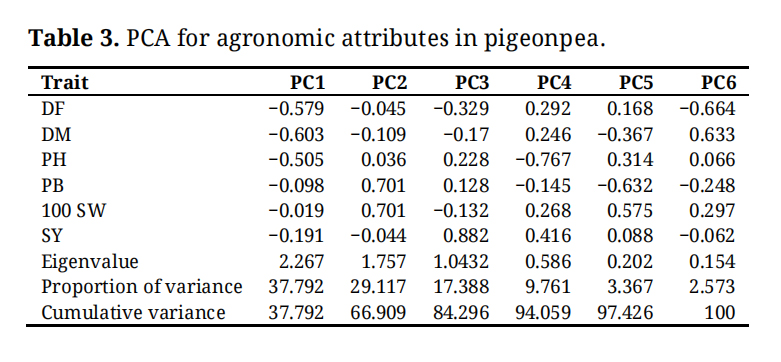 Table 3. PCA for agronomic attributes in pigeonpea.
The analysis identified six distinct clusters among a population of 248 pigeonpea genotypes based on D2 values derived from six traits (Figure 1). Cluster I was the largest, consisting of 108 genotypes, followed by Cluster III with 60 genotypes. Cluster II included 36 genotypes, while Clusters IV, V, and VI comprised 42, 1, and 1 genotype(s), respectively. Notably, the largest inter-cluster distances were observed between Cluster II and Cluster VI (14.06), followed by Cluster II and Cluster I (13.40), Cluster II and Cluster III (13.40), Cluster II and Cluster IV (12.56), and Cluster I and Cluster V (12.36). These significant distances lead to a high level of genetic diversity between these groups (Supplementary Table S2). Cluster II and VI, with cluster means of 109.61 and 103 for DM, respectively, indicated that the genotypes in this cluster were early developing (Table 4). Clusters I, III, and V had cluster mean values of 149.39, 148.38, and 151, respectively, indicating medium maturity, while only cluster IV had a cluster mean greater than 160 days, indicating that its genotypes were long-duration ones. In addition, Cluster VI exhibited the highest mean value for 100-SW (16.0 g), Cluster III exhibited the tallest genotypes with highest cluster mean for PH with 205.9 cm, whereas, relatively dwarf genotypes observed in Cluster V with cluster mean of 116 cm for PH. Furthermore, Cluster I demonstrated the highest cluster mean value for PB at 16.4 and Cluster V presented the highest mean value for SY with 3561 kg/ha.
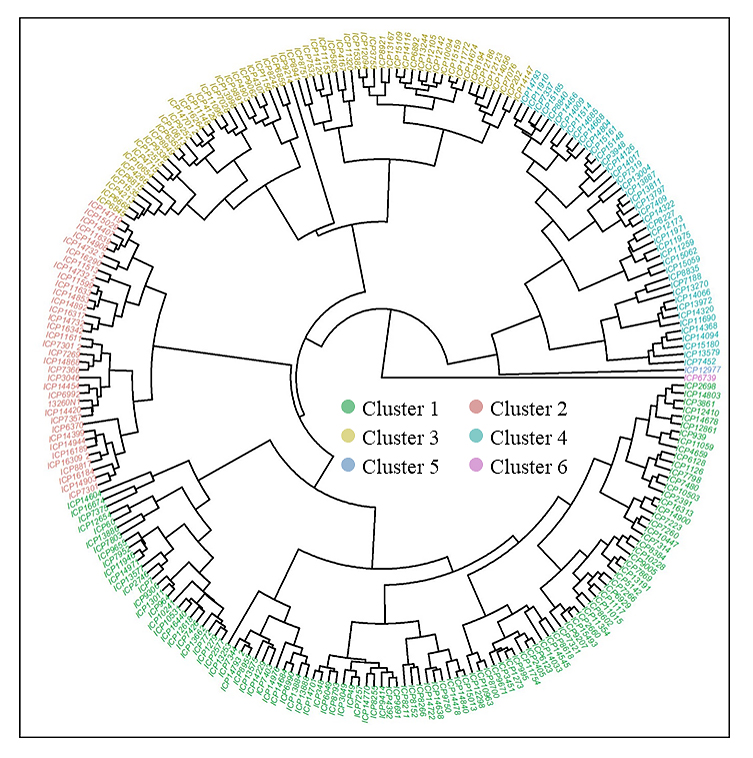 Figure 1. Cluster analysis of 248 pigeonpea (Cajanus cajan) accessions based on tocher’s method.
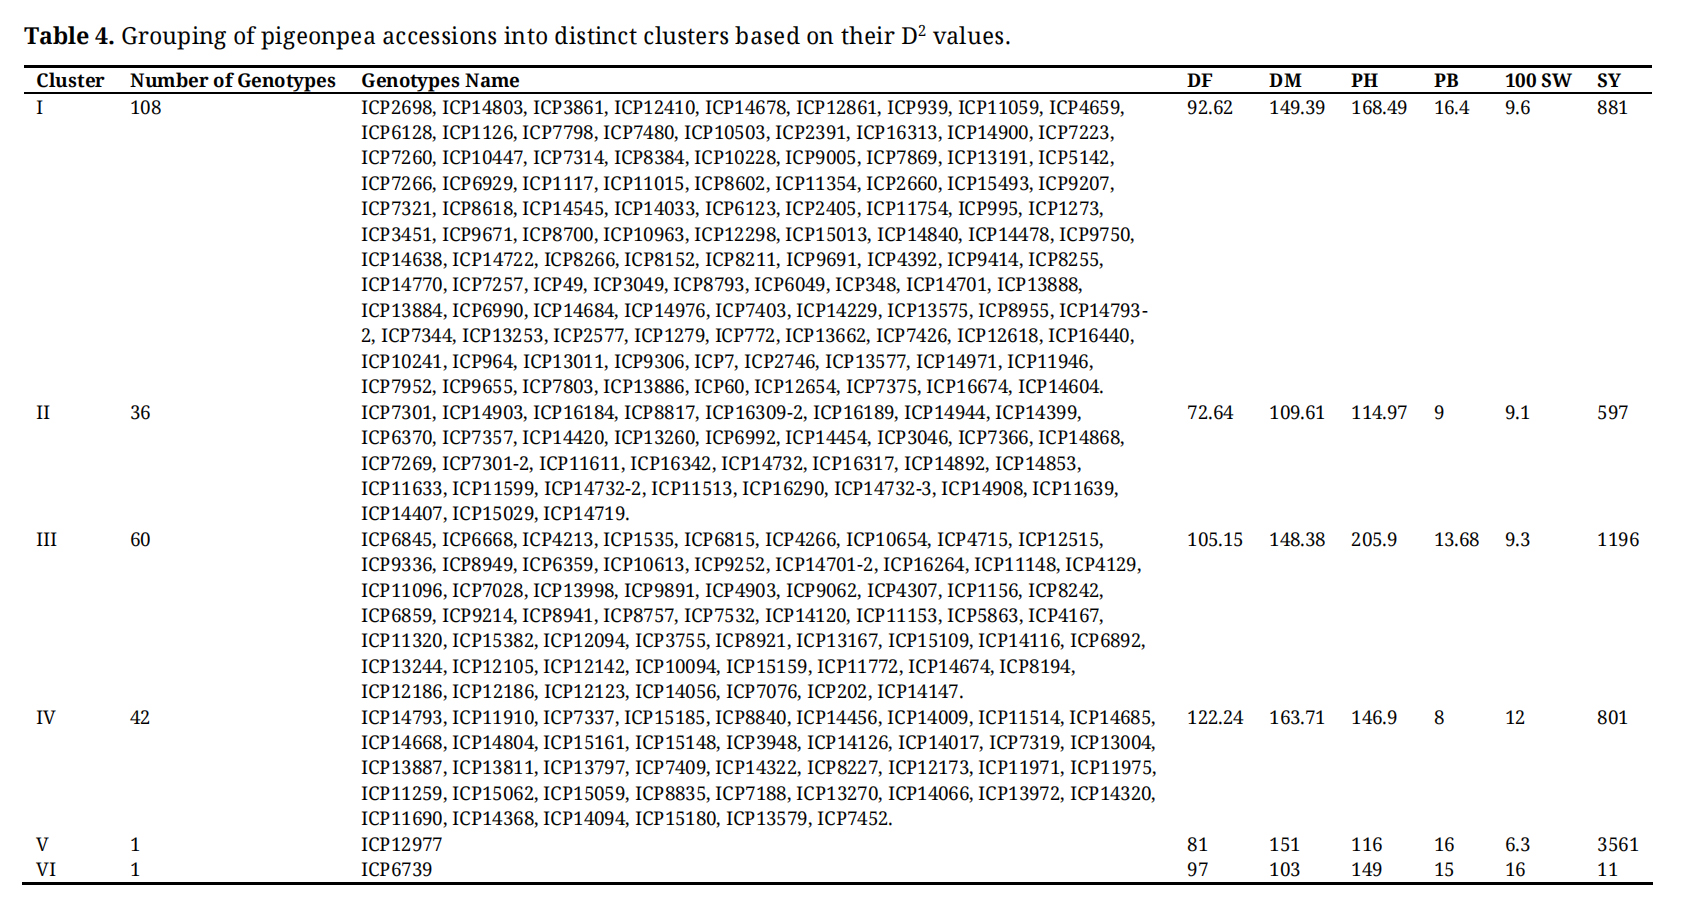 Table 4. Grouping of pigeonpea accessions into distinct clusters based on their D2 values.
A total of 56,127 SNPs were identified across the pigeonpea reference genome Cajanus cajan v1.0. These SNPs were filtered based on a call rate of ≥80% and marker reproducibility of ≥95%. Following stringent filtering criteria, including a MAF > 1% and missing data (SNP loci) ≤ 20%, a total of 52,863 SNPs were retained, representing 94% of the initially identified SNPs across the 11 chromosomes of pigeonpea (Figure 2a). The distribution of the 52,863 mapped SNPs (Figure 2a) revealed that the highest number of SNPs (15.22%, 8044 SNPs) was physically linked to chromosome 11. Analysis of the mutation types revealed that transitions (31,864 allelic sites, 77.64%) were significantly more frequent than transversions (9181 allelic sites, 22.36%), with a ratio of 3.47 (Figure 2b). Among the transitions, A/G and C/T occurred at frequencies of 39.33% and 38.31%, respectively. Among the transversions, A/C was the most frequent (9.85%), followed by G/T (9.75%), while C/G (1.40%) and A/T (1.36%) were the least common. Consequently, A/G transitions and C/G transversions occurred at the highest and lowest frequencies, respectively.
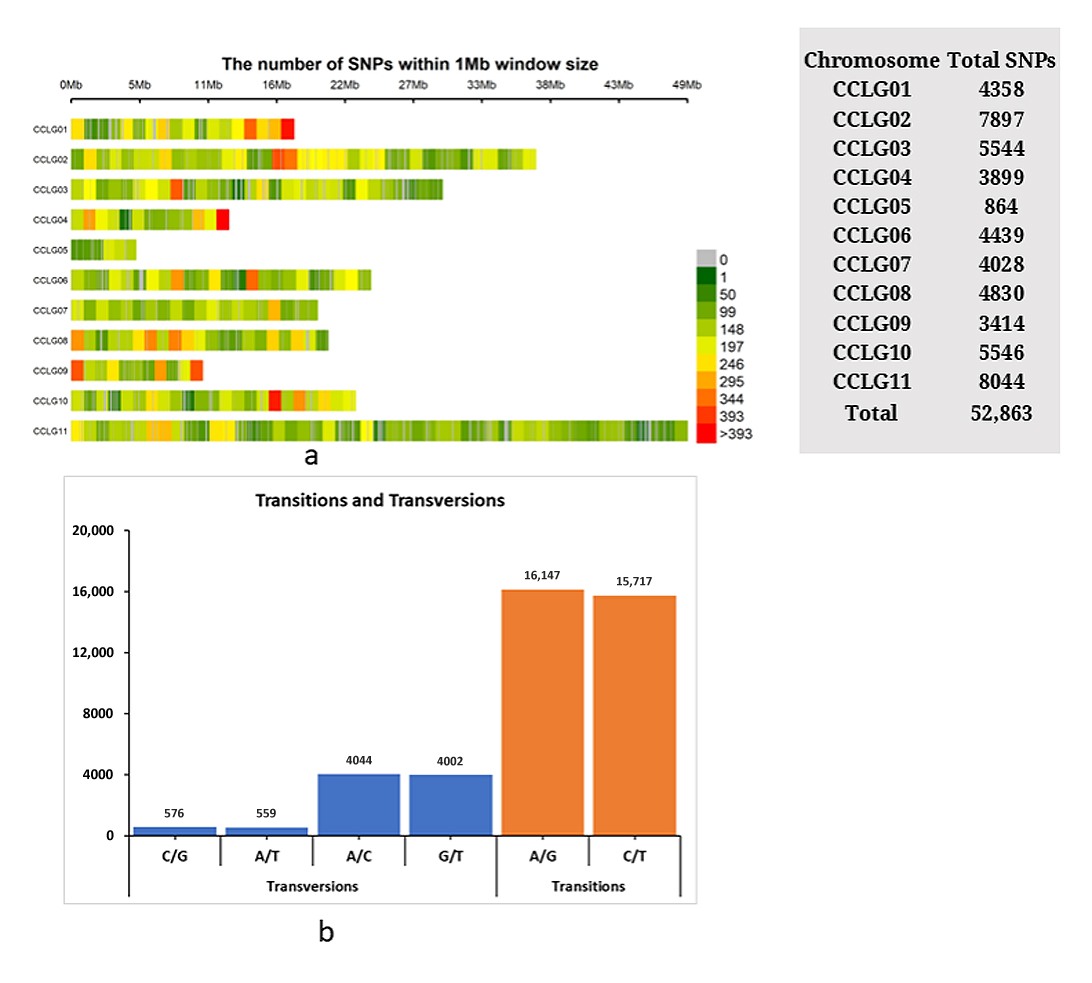 Figure 2. (a) The SNP density plot across the 11 chromosomes of pigeonpea representing number of SNPs within 1 Mb window size. The horizontal axis represents the chromosome length in Mb. Different colors correspond to SNP density. (b) Frequency of transition and transversion mutations across the pigeonpea genome.
The analysis of genetic diversity within the selected unique 185 pigeonpea accessions using SNP markers showed that the MAF among the genotyped accessions ranged from 0.05 to 0.50, with a mean of 0.27, indicating a moderate level of genetic variation within the accessions (Table 5). This range of MAF suggests that while some alleles are relatively common, others are much rarer, which could reflect either natural selection pressures or the historical breeding practices that have shaped these accessions. The observed heterozygosity (Ho) ranged from 0.03 to 1.00, with an average of 0.14, pointing to a generally low but variable level of heterozygosity across the accessions. This low average Ho indicated that many of the accessions may be homozygous at the SNP loci studied, possibly due to inbreeding or self-pollination, which is common in pigeonpea. However, the wide range suggested that some accessions still maintain considerable genetic diversity. In contrast, the expected heterozygosity (He) was relatively consistent, ranging from 0.39 to 0.61, with a mean of 0.37. This expected value provides a baseline for the genetic variation that could be anticipated within the population under random mating conditions. The similarity between the average He and the Ho values might indicate that while genetic diversity is present, it might not be fully exploited. Furthermore, the polymorphism information content (PIC) values, ranging from 0.09 to 0.50 with an average of 0.36, further confirm the moderate level of polymorphism in the SNP markers used. PIC is an important measure as it reflects the markers’ ability to detect genetic diversity within a population. The moderate PIC values indicate that the SNP markers are moderately informative and can be useful in distinguishing between the different pigeonpea accessions. Finally, the genetic distance (GD) among the accessions, which ranged from 0.00 to 0.49 with a mean of 0.37, suggests varying degrees of genetic divergence. The overall PIC value (0.36) and gene diversity (0.37) observed within the pigeonpea collection using SNP markers were higher than those reported by [23] across 21 pigeonpea landraces (PIC value 0.2) and by [8] across 80 accessions (PIC value 0.25 and gene diversity 0.30). This diversity is crucial for breeding programs as it provides a pool of genetic variation that can be harnessed to improve traits such as yield, disease resistance, and environmental adaptability. These findings collectively underline the importance of maintaining and utilizing genetic diversity in pigeonpea breeding programs. This observation aligns with findings from several previous studies [7,19,23,24].
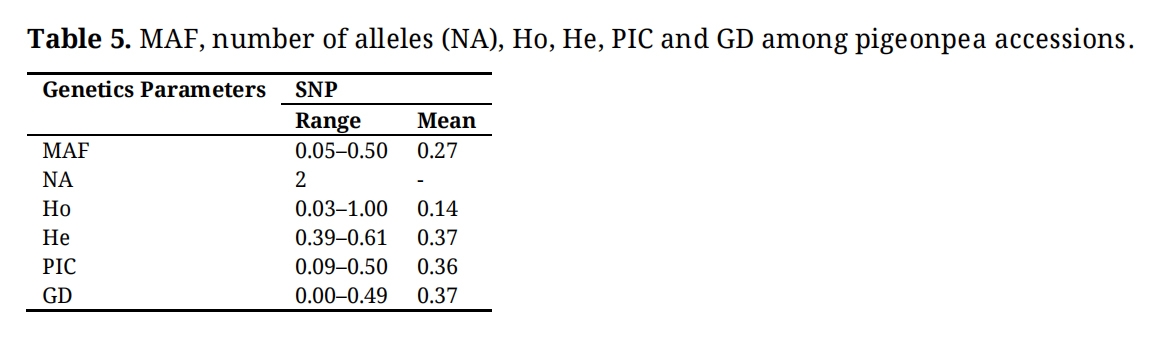 Table 5. MAF, number of alleles (NA), Ho, He, PIC and GD among pigeonpea accessions.
The cluster analysis of 185 pigeonpea accessions based on SNP markers revealed 4 different clusters (Figure 3). The clusters were numbered based on the highest genotypes within them. Cluster I, with red color, comprised of 76 genotypes followed by cluster II (blue) with 63 genotypes, cluster III (pink) with 27 genotypes and cluster IV (green) with 19 genotypes. This indicates that there exist substantial genetic differences among genotypes, further indicating potential evolutionary divergence.
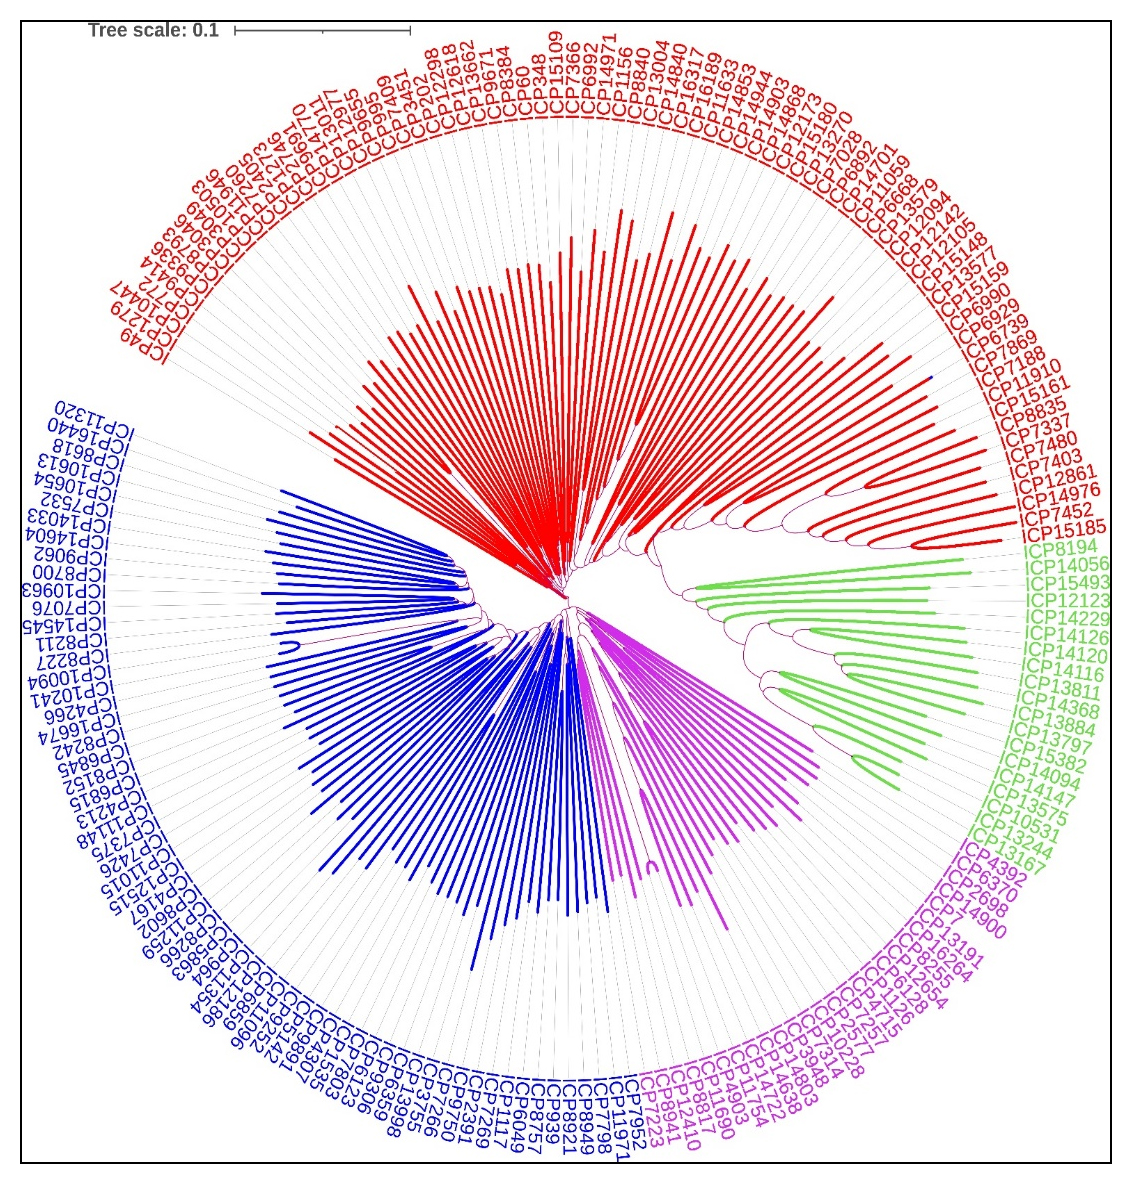 Figure 3. The SNP based genotypic clustering of 185 pigeonpea accessions.
The PCA biplot (Supplementary Figure S1) provides the clearest visualization of genetic dissimilarity in two-dimensional space. Several genotypes are located far apart from the main clusters, indicating their genetic distinctiveness, which correlates with extreme values in key agronomic traits. The accessions positioned on the extreme upper right of the principal component axis ICP8211 and ICP9062 are standout performers, characterized by their exceptional SY (2312 and 2389 kg/ha, respectively), which is more than double the panel average (~935 kg/ha). ICP9062 further distinguishes itself with a very tall PH (233 cm). In contrast, the accessions in the lower quadrants represent other unique genetic pools. ICP11754 is distinguished by its exceptionally high PB (22), a trait crucial for yield architecture. Meanwhile, ICP202 is characterized by its very low SY (209 kg/ha) and the lowest 100 SW (5 g) in this group. ICP10094 presents a more intermediate profile but is still genetically distinct, potentially due to its combination of late flowering (108 days) and average height. These genetically distant accessions possess unique trait combinations and likely harbor valuable alleles for yield components, plant architecture, and phenology, making them prime candidates for targeted use as parental lines to enhance genetic diversity in pigeonpea breeding programs.
AMOVA and Population StructureThe AMOVA and STRUCTURE analysis of 185 pigeonpea accessions provide complementary insights into the genetic diversity and population structure of this important crop. The AMOVA results (Table 6) revealed that the majority of genetic variation (87.01%) was found within samples, while 12.99% of variation exists between samples. This distribution suggested high levels of genetic diversity maintained within populations, which could be beneficial for adaptation to local conditions and resilience to environmental stresses. The fixation index (FST) of 0.13 indicated moderate genetic differentiation among populations, implying a balance between gene flow and local adaptation processes.
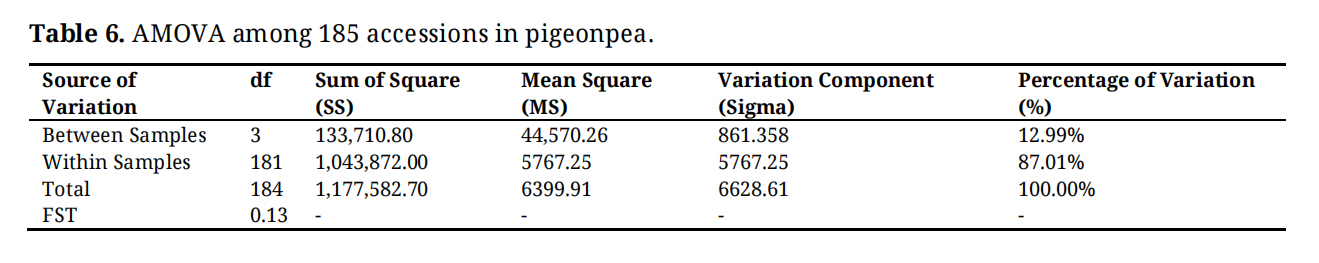 Table 6. AMOVA among 185 accessions in pigeonpea.
Complementing the AMOVA results, the STRUCTURE analysis (Figure 4) provides a more detailed view of the population structure within these pigeonpea accessions. The optimal number of sub population groups was determined to be four (K = 4), as evidenced by the clear peak in the ΔK plot and supported by the plateau in the log probability of data plot. The bar plot visualization of these four genetic sub-populations revealed a complex admixture pattern among the accessions. A sub-population represented by red, appears to be the most genetically distinct, with many individuals showing high assignment probability to this group. This could indicate a subset of accessions with a unique genetic background, possibly representing a distinct breeding line or geographically isolated population. The other three sub-populations, depicted in green, blue, and yellow, display higher levels of admixture, suggesting more frequent gene flow or shared ancestry among these groups. The presence of individuals with almost equal proportions of multiple clusters points to the existence of admixed populations. In a global reference set, this pattern is best explained by shared ancestral genetic variation and the historical movement and exchange of germplasm between geographic regions. The presence of genetic structure in cultivated pigeonpea was previously detected by [8,25,26].
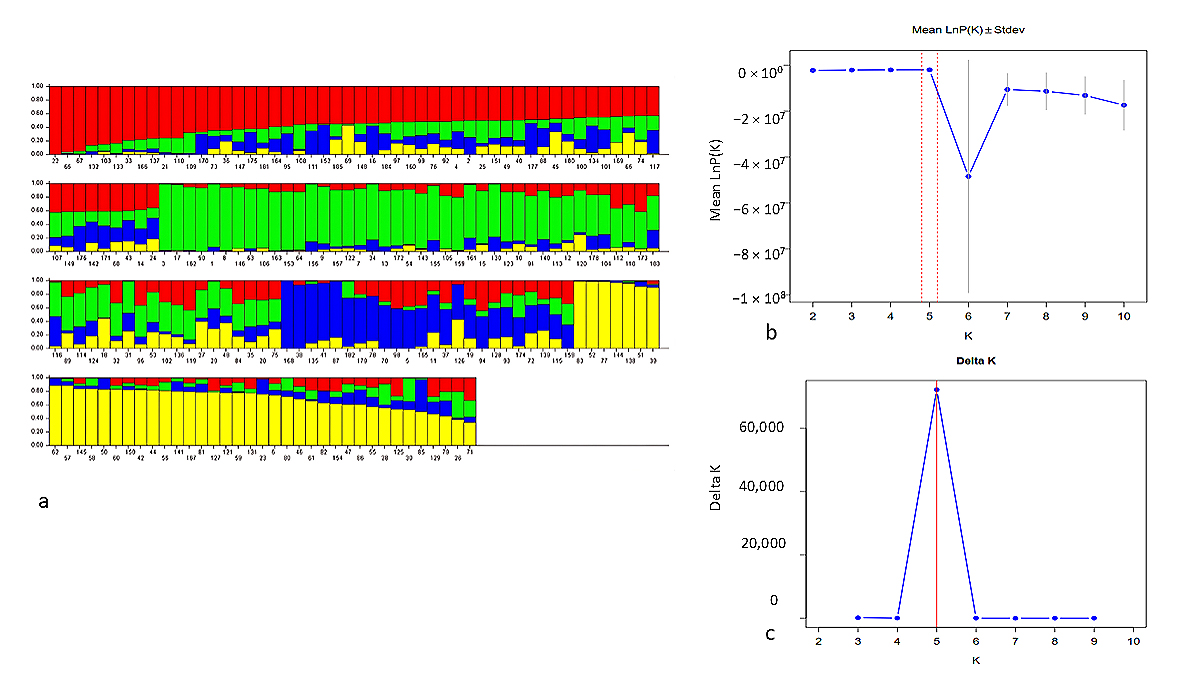 Figure 4. (a) SNP based population structure of the 185 pigeonpea accessions. (b) Mean posterior probability and standard deviation across K values and (c) Delta K plot showing the optimal number of genetic clusters.
This single-season study provides a comprehensive analysis of the genetic variability and population structure within a diverse panel of 248 pigeonpea accessions, delivering crucial insights for varietal development and the selection of hybrid parental lines. While multi-environment trials are essential for assessing genotype-by-environment interactions and stability, early-stage breeding programs fundamentally rely on robust single-season analyses to identify promising genotypes from large germplasm collections, thereby optimizing resources for subsequent multi-location testing [27].
The foundation of this study rests on the detection of highly significant genetic variance for all agronomic traits, a fundamental prerequisite for any successful breeding program [28]. The high hBS estimates (>77%) confirm that a substantial portion of this observed phenotypic variation is under genetic control, providing high confidence that phenotypic selection within this panel will be effective for genetic improvement [29]. A key and favorable finding was the lack of a significant difference between the new lines and the check varieties on average, which does not indicate a lack of superior material but rather positions the checks as competitive benchmarks within a population possessing a wide genetic base. The significant block effects for key traits validated the use of the augmented design, ensuring that the genetic estimates were precise and unbiased by field heterogeneity.
The extensive ranges for all traits, particularly the variation in SY, highlight the vast genetic potential within the collection. The analysis of trait contributions quantified this, identifying SY as the predominant source of diversity (43.98%), underscoring its primacy as a target for selection. The PCA further elucidated the structure of this diversity, with the first three components explaining 84.3% of the total variance. PC1 represented a “phenology and PH” axis, PC2 was independently driven by the yield components PP and 100 SW, and PC3 was overwhelmingly influenced by SY itself. This structure reveals the independent genetic control of these key trait groups, which is advantageous for breaking yield plateaus through strategic recombination of complementary phenotypes [30–32].
The cluster analysis substantiated the PCA, grouping the genotypes into six distinct clusters. The large inter-cluster distances, particularly between Cluster II and VI, indicate a high level of genetic divergence. According to established selection theory, crosses between parents from such genetically distant clusters are more likely to produce transgressive segregants and generate broad genetic variability in progeny, which is essential for harnessing heterosis and achieving genetic gain [32]. The identification of unique clusters with specific trait combinations such as Cluster VI for high 100 SW and Cluster V for high yield provides a clear, data-driven roadmap for targeted hybridization. The findings are consistent with previous research indicating substantial genetic divergence within pigeonpea germplasm, as documented by [23,33,34].
At the molecular level, the analysis of sequence mutations offered insights into the evolutionary dynamics of the pigeonpea genome. The observed spectrum, characterized by a higher rate of transitions compared to transversions, aligns with a well-documented molecular evolutionary trend across diverse taxa, often attributed to the greater biochemical stability of transition mutations [8,35–40].
Comparison of Phenotypic and Molecular Genetic Clustering in PigeonpeaIn the present study, phenotypic diversity analysis grouped pigeonpea accessions into six clusters, whereas molecular genetic diversity analysis identified four clusters. This clear difference in grouping highlights the contrasting patterns revealed by the two methods. Further examination showed discrepancies in the distribution of genotypes within each cluster across the two approaches. To validate this observation, phenotypic clustering was repeated using only the 185 accessions for which genotypic data were available. The results once again demonstrated no consistency in grouping between the methods (Supplementary Figure S2). The presence of genetic structure in cultivated pigeonpea was previously detected by [8,25,26].
These discrepancies may be attributed to the inherent differences between phenotypic and molecular data. Phenotypic traits, particularly those related to yield, are influenced by environmental adaptation and selection pressures [41,42]. In contrast, molecular clustering is based on SNP variations that primarily reflect genetic relationships and evolutionary history, independent of environmental effects. Previous studies have reported similar weak correlations between phenotypic and genotypic clustering, particularly in wheat [43–47] and maize [48,49] further reinforcing this inconsistency.
Comparison of Population Structure and Molecular Genetic Diversity ClusteringBoth population structure and molecular genetic diversity clustering were derived from SNP data, yet they exhibited substantial differences in genotype distribution. Cluster I, consisting of 63 accessions, showed 76% correspondence with the green subpopulation, while Cluster II, with 27 accessions, had 85% alignment with the red subpopulation. Cluster III, comprising 19 accessions, exhibited the highest consistency, with 95% of its members matching the yellow subpopulation. In contrast, Cluster IV, the largest group with 76 accessions, displayed a highly mixed composition only 22% of the accessions matched the blue subpopulation, while 33% were from the red subpopulation and 30% from the yellow subpopulation. Despite both analyses resulting in four groups, the distribution of accessions within these clusters varied significantly, highlighting differences in their methodologies. Population structure analysis, as implemented in programs like STRUCTURE and ADMIXTURE, assigns individuals to subpopulations based on shared genetic ancestry, assuming either discrete clusters or admixture patterns. In contrast, genetic diversity clustering captures overall genetic variation without predefined population boundaries. Additionally, population structure analysis relies on linked SNPs that define ancestry blocks, whereas genetic diversity estimates consider broader allele frequencies, leading to variations in clustering patterns.
These differences emphasize the complementary nature of phenotypic and molecular clustering approaches. While phenotypic clustering is influenced by environmental factors and trait-based selection, genetic clustering primarily reflects underlying genetic relationships. Even within molecular approaches, population structure and genetic diversity clustering can yield differing results due to variations in methodology and underlying assumptions. Therefore, integrating both phenotypic and genotypic analyses is essential for a more comprehensive understanding of genetic diversity and breeding potential in pigeonpea.
This integrated study demonstrates substantial genetic diversity within the 248 pigeonpea accessions through both phenotypic and molecular analyses. The high heritability estimates (>77%) confirm that observed trait variations are primarily genetically controlled, ensuring effective phenotypic selection. The identification of six phenotypic and four molecular clusters, alongside significant inter-cluster distances, reveals a complex population structure with distinct genetic pools. Specific genotypes such as ICP9891 (high yield), ICP13253 (large seeds), and ICP6370 (early flowering) represent valuable breeding candidates. The SNP analysis further confirmed moderate to high genetic diversity (PIC = 0.36) and revealed expected mutation patterns with a transition/transversion ratio of 3.47. We recommend: (1) Utilizing the identified elite genotypes (ICP9891, ICP13253, ICP6370) as parental lines in hybridization programs; (2) Prioritizing crosses between genetically distant clusters (particularly II and VI) to maximize heterosis; (3) Employing marker-assisted selection for key yield components identified through PCA; and (4) Validating these single-season findings through multi-location trials to assess genotype × environment interactions. This comprehensive characterization provides a robust foundation for systematic pigeonpea improvement.
The following supplementary materials are available online, Figure S1: The SNP derived principle component analysis (PCA) biplot of 185 pigeonpea accessions illustrating individual contributions and cosine similarities across two principal components, Figure S2: Phenotypic cluster analysis of selected unique 185 pigeonpea accessions, Table S1: Genetic material used for the study, Table S2: Inter- and Intra-Cluster Distances Analysis for Pigeonpea Genotypes.
All data generated from the study are available in the manuscript or supplementary files.
The dataset of the study is available from the authors upon reasonable request.
Conceptualization, MS, SHB, VOA, NB, MP, MKP and PIG; methodology, MS, SHB, MP, PIG and NB; software, AV, SSG, MKP; validation, MS, VOA, PIG, MKP and SHB; formal analysis, MS, AV, SHB, SSG; investigation, MS, PIG, VOA, NB and SHB; resources, PIG, NB, MKP, VOA and SHB; data curation, MS, AV, MP and SSG; writing—original draft preparation, MS, SHB, MP, VOA, PIG; writing—review and editing, MS, SHB, MKP, VOA, PIG, MP and SSG; visualization, MS, SSG, MP and VOA; supervision, PIG, VOA, MKP, NB and SSG; project administration, PIG, VOA, MKP and NB; funding acquisition, PIG. All authors have read and agreed to the published version of the manuscript.
The authors declare no conflicts of interest related to this study.
We acknowledge the financial support from the International Crops Research Institute for the Semi-Arid Tropics (ICRISAT), Hyderabad, Telangana, India. We also express our gratitude to the African Union Commission for providing a scholarship to Mohammed Salah for his Ph.D. studies at the Pan African University—Institute of Life and Earth Sciences (PAULESI), University of Ibadan, Ibadan, Nigeria.
The author expresses gratitude to the pigeonpea breeding from the International Crops Research Institute for the Semi-Arid Tropics (ICRISAT) for their support and resources.
1.
2.
3.
4.
5.
6.
7.
8.
9.
10.
11.
12.
13.
14.
15.
16.
17.
18.
19.
20.
21.
22.
23.
24.
25.
26.
27.
28.
29.
30.
31.
32.
33.
34.
35.
36.
37.
38.
39.
40.
41.
42.
43.
44.
45.
46.
47.
48.
49.
Salah M, Belliappa SH, Bomma N, Pujar M, Vemula A, Gangurde SS, et al. Exploring genetic diversity and population structure in an international panel of pigeonpea (Cajanus cajan L. Millsp.). Crop Breed Genet Genom. 2025;7(4):e250016. https://doi.org/10.20900/cbgg20250016.

Copyright © Hapres Co., Ltd. Privacy Policy | Terms and Conditions