Location: Home >> Detail
Crop Breed Genet Genom. 2025;7(4):e250017. https://doi.org/10.20900/cbgg20250017
 ,
Louis Butare 2,* ,
Stephen Yeboah 3,4 ,
James Yaw Asibuo 3,4 ,
Victor O. Adetimirin 5
,
Louis Butare 2,* ,
Stephen Yeboah 3,4 ,
James Yaw Asibuo 3,4 ,
Victor O. Adetimirin 5
1 Life and Earth Sciences Institute (including Health and Agriculture), Pan African University, Ibadan 200132, Oyo State, Nigeria
2 Alliance of Bioversity International & International Center for Tropical Agriculture (CIAT), c/o International Institute of Tropical Agriculture (IITA)-Benin Station, Abomey Calavi, 08 BP 0932, Cotonou, Benin
3 Council for Scientific and Industrial Research (CSIR)-Crops Research Institute, Fumesua, Kumasi P.O. Box 3785, Ghana
4 Department of Plant Resources Development, Council for Scientific and Industrial Research (CSIR)-College of Science and Technology, Fumesua-Kumasi, Ghana
5 Department of Crop and Horticultural Sciences, University of Ibadan (UI), Ibadan 200005, Oyo State, Nigeria
* Correspondence: Louis Butare
Micronutrient malnutrition remains a major challenge worldwide, where common bean (Phaseolus vulgaris L.) is a key dietary source of iron (Fe) and zinc (Zn). However, Limited exploration of Genotype plus Genotype × Environment interactions (G + GEI) has constrained efforts to achieve stable micronutrient enhancement across diverse agro‑ecological conditions. This study evaluated genetic variation among 92 advanced lines, four parents, and four checks across multiple environments and years in Ghana, focusing on G + GEI effects on seed Fe and Zn contents using GGE biplot analysis. Significant effects of genotype, environment, year, and their interactions were detected for both traits, underscoring the complexity of micronutrient accumulation. Bunso emerged as the most representative environment, while Akumadan showed strong discriminative ability but poor representativeness. Scaled ranking biplots identified lines such as G64, G70, G86, G66, and G68 as stable high‑Fe performers, whereas G5, G2, and G21 were stable for Zn. Conversely, several lines such as G31, G40, G47, G50, and G88 displayed instability or consistently low mineral content. The “which‑won‑where” analysis highlighted environment‑specific winners across Akumadan, Bunso, and Fumesua. Transgressive segregation among advanced lines proved valuable for generating superior lines beyond parental limits, while backcrossing provided a reliable strategy for consolidating high trait values. Moderate broad-sense heritability was observed for Fe content (45%), whereas Zn exhibited higher heritability (67%). Based on the selection intensity of 2.06 (5% selection), the expected genetic advance was 13.5% for Fe and 10.8% for Zn. These findings demonstrate the robustness of GGE biplots in identifying stable bean nutrient‑rich genotype and candidate lines for biofortification programs and contribute to nutrition and food security in West Africa.
Micronutrient deficiencies remain a significant public health challenge worldwide, particularly in developing countries where access to diverse and nutrient-rich foods is limited [1]. Essential micronutrients like iron (Fe) and zinc (Zn) play crucial roles in supporting immune function, cognitive development, and overall well-being [2]. Among the most common sources of these micronutrients, plant-based foods have gained attention for their potential to alleviate deficiency-related health problems [3]. Among staple food crops to combat micronutrient deficiencies, common bean (Phaseolus vulgaris) stands out as a rich, affordable source of iron and zinc, making it an important dietary staple in many regions of the world [4].
Common bean has traditionally been a major source of important micronutrients such as Fe and Zn in many parts of world. Despite this, over 3 billion people worldwide suffer from iron and zinc deficiencies [5]. Iron deficiency in children and adolescence adversely affect physical growth, mental development and learning capacity. While in adults, iron deficiency causes anaemia which reduces physical labor capacity [6]. Iron deficiency also increases the risk of women dying in childbirth or in the post-delivery period. Zinc deficiency has been linked to stunting in children [7].
Biofortified food crops have been reported to be an effective and affordable way of combating micronutrient deficiency [8]. Common bean is consumed by over 400 million people in Africa, especially in East and West Africa [9]. The crop stands as a potential grain legume for biofortification of Fe due to its relatively high baseline seed Fe content of 55 ppm [10,11] compared to most other staple food crops. It is a very popular source of iron due to its affordability, palatability, and long shelf life that guaranteed high food quality assurance. Beans are generally a healthy food option reported to reduce development of heart disease, and breast/colon cancer [12,13]. Biofortified common bean has great potential for reaching large number of people across Africa, especially in poverty-stricken regions with high micronutrition deficiencies.
The global research and development program of HarvestPlus has set the threshold for high Fe and Zinc beans at 90 ppm and 50 ppm, respectively [14]. In the field, some genotypes consistently exhibit higher iron (Fe) and zinc (Zn) concentrations or demonstrate more stable performance across environments, whereas others show reduced accumulation and potentially influenced by genetic background, seed morphology, soil interactions, or tolerance to environmental stress [15], but previous studies have reported genetic variation for Fe and Zn accumulation [16]. Limited information exists on the stability of these traits across diverse environments. Consequently, the effectiveness of biofortification and the nutritional quality of common bean varieties in diets would contribute to the alleviation of micronutrient deficiencies. In West Africa, the limited exploration of G + GEI in common bean have created a critical gap in understanding how stable micronutrient enhancement can be achieved across varied agro‑ecological conditions. We hypothesized that G + GEI and genetic variation would play a decisive role in determining seed Fe and Zn concentrations in common bean. Identifying lines with consistently high micronutrient content and stable performance across environments is essential for developing biofortified varieties to reach nutritionally vulnerable populations and combat hidden hunger. The present study aimed to evaluate 92 advanced common bean lines across multiple environments in Ghana, with a primary focus on GE plus G + GEI for iron (Fe) and zinc (Zn) accumulation and genetic variation.
The genetic materials evaluated in this study consisted of 92 advanced lines, 4 parental lines, and 4 check varieties of common bean. The parental lines included MCR‑ISD‑672, RWR 2154, CAL 96, and NUA99. The varieties checks comprised of ADOYE, NSROMA, SEMANHYIA and JESCA; and their full descriptions are presented in Table 1. Two single crosses were subsequently made (MCR‑ISD‑672 × RWR 2154) and (CAL 96 × RWR 2154) with F1 seeds advanced to F2 populations. Backcross populations were developed using NUA99 as a fourth parent, including BC1P1 [(MCR‑ISD‑672 × RWR 2154) × MCR‑ISD‑672] and BC1P4 [(RWR 2154 × NUA99) × RWR 2154] (Supplementary Materials). Controlled crosses were performed by hand pollination through emasculation followed by pollen transfer in the greenhouse at the Crop Research Institute, Kumasi, Ghana, during the main cropping season (May to August 2018), and the resulting populations were advanced through successive selfing by single‑seed descent to the F6 generation.
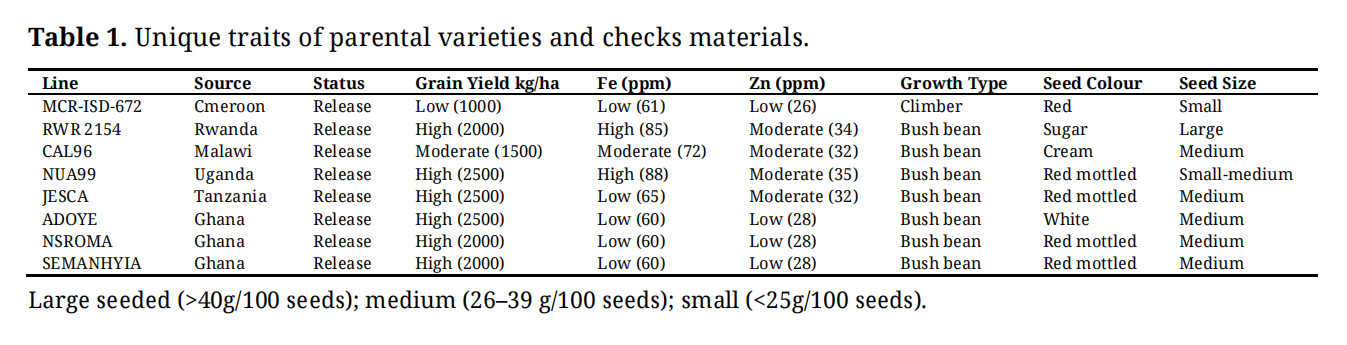 Table 1. Unique traits of parental varieties and checks materials.
The experiments were conducted during the year 2023 and 2024 at three sites in Ghana including: Akumadan, Bunso and Fumesua. Akumadan (Lat. 7°23′ N, Long. 1°56′ W) is in the Transition agro-ecological zone under the Council for Scientific and Industrial Research (CSIR) in the Ashanti Region. The area has a bimodal rainfall pattern with an annual total of about 1200–1300 mm. Bunso (Lat. 5°46′ N, Long. 1°46′ W) is in the semi-deciduous forest zone of the Eastern Region, at an elevation of 149 m above sea level. The trials were conducted at CSIR-Plant Genetic Resources Research Institute in the East-Akim District. It characterized by a bimodal rainfall distribution with an annual average of about 1750 mm. Fumesua (Lat. 6°46′ N, Long. 1°1′ W) situated in the semi-deciduous forest zone at CSIR/Crop Research Institute (CRI) in Ashanti Region, and characterized by a bimodal rainfall with an average of 1727 mm per year.
Over a typical cropping season of about 12–16 weeks common beans require a total of approximately 300–400 mm of water, either from rainfall or supplemental irrigation [17]. The experimental field trials conducted at Fumesua were irrigated due to insufficient rainfall, especially during 2024 growing season (Table 2) for proper development. Other monthly weather parameters during the growing season are presented in Table 2, and the highest rainfall was recorded at Bunso and the highest temperatures were recorded at Fumesua. The highest relative humidity was recorded at Bunso and all the two research sites have recorded the lowest relative humidity in June 2024. Relative to Akumadan and Fumesua, the Bunso site is characterized not only by high concentrations of bioavailable iron (Fe) and zinc (Zn), but also by a more favorable soil pH regime. In addition, Bunso exhibits higher levels of soil organic matter and greater reserves of macro- and micronutrients, conferring superior edaphic conditions that enhance nutrient cycling and support the accumulation of grain micronutrients (Table 3).
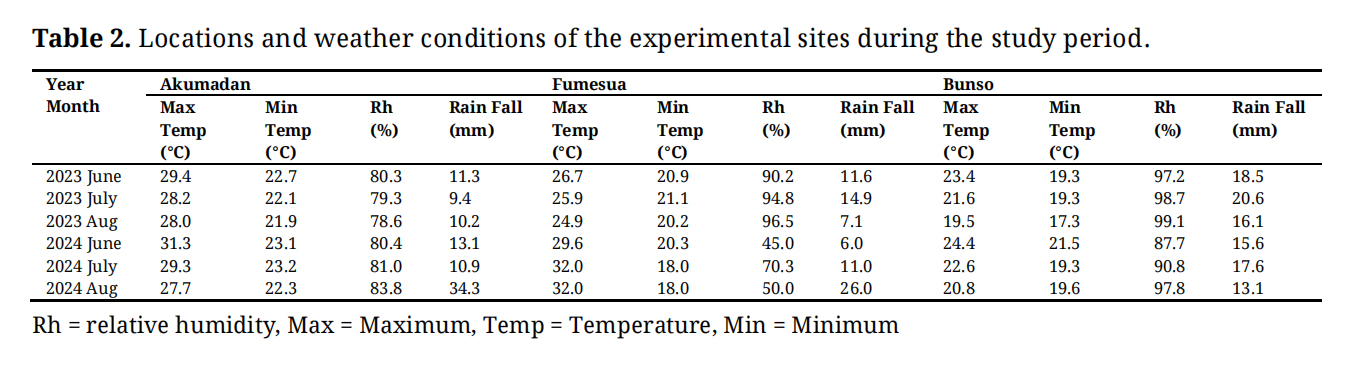 Table 2. Locations and weather conditions of the experimental sites during the study period.
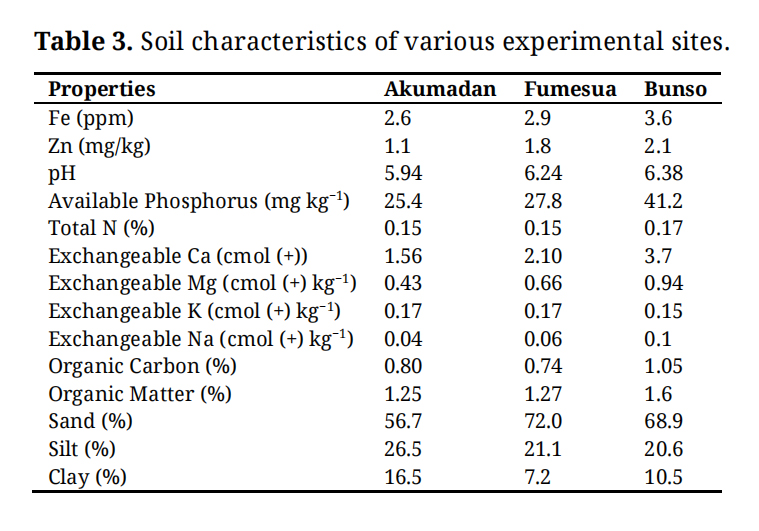 Table 3. Soil characteristics of various experimental sites.
The field experimental design was laid out as a 10 × 10 lattice design with two replications per site. The experimental plot was in one row per bean line, with 10 plants per row. Plants were spaced at 20 cm intervals within the row. Each row was 2 m long with 0.4 m distance between rows of plants, and the spacing between blocks was determined at 0.5 m.
Soil AnalysisSoil at the experimental site was analyzed at the Department of Crops and Soil Sciences of the Kwame Nkrumah University of Science and Technology (KNUST) for Iron (Fe) and Zinc (Zn), organic matter (OM) and organic carbon (OC), Nitrogen (N), Phosphorus (P), Potassium (K), Calcium (Ca), Magnesium (Mg), Copper (Cu) and Manganese (Mn) (Table 3) using the method develop by [18].
Iron and Zinc QuantificationMature pods were harvested and dried, cleaned and dirt free. The harvested pods were hand threshed, and seeds were subsequently dried to a moisture content of 12–14% 40 seeds from each line and each season and from each site were counted and put into a small paper bag. Rapid screening of iron (Fe) and zinc (Zn) was conducted at Rwanda Agriculture Board (RAB) Rubona Research Station in southern province; and for quantification of iron and zinc, an X-ray fluorescence (XRF) method was used [19]. The samples were thoroughly washed and cleaned with distilled water and clean cloth to avoid contamination. The samples were oven dried at 60 °C for 12 h and then ground using Sunbeam Conical Burr Mill EM0480 Grinder. Iron and zinc content in the seeds were determined using XRF Spectrometer by analyzing each sample.
Data collection and AnalysisData collected were mineral content of seeds from each bean genotype on the three sites for two years.
Analysis of variance (ANOVA) was carried out using aov () function in R software version 4.4.2 [20] to estimate mean squares for iron and zinc contents across common bean lines, year, environments, and their interactions. To further explore the patterns of genotype performance and GE interaction, a Genotype + Genotype × Environment (G + GEI) biplot analysis was conducted following the methodology of Yan et al. (2001) [21]. The analysis was conducted to generate GGE biplots using GGEBiplots package in R software, and the model was based on the singular-value decomposition of the first two principal components [22]. Yan and Tinker (2006) [23] suggested that it is a powerful tool for visualizing “which-won-where” patterns and assessing adaptability. The equation used was as follows:
Where yijr = observe of the rth replicate of the ith genotype in the environment, μ = the overall mean, λk = the singular value for principal component k, ej = the mean effect of the jth environment, x = matrix rank {gge}ij = gi + geij, σik = the eigenvector score for genotype i and component k, and γjk = the eigenvector score for environment j and component k, and εijr = the error for the genotype i and environment j and replicate r.
The heritability for iron and zinc contents was estimated using the formulae described by Allard (1960) [22]. Mixed-effects model with line as a fixed effect and year as replication within years, and line × year interactions as random effects, estimating heritability (H2) involves partitioning the variance components obtained from the mixed-effects model. The model was fitted using R software with lme4 package, and broad-sense heritability (H²) was estimated by partitioning the variance components obtained from the mixed-effects model. The broad-sense heritability formula using variance components derived from a mixed-effects model was described as follows:
Where:
represent the variance due to lines effects.
represents the residual variance (unexplained variability within replication within years).
represents the variance due to the line × year interaction (random effect).
Phenotypic and genotypic variance components were estimated using the formulae described by Johnson et al. (1955) [24] in a mixed-effects model with lines as a fixed effect and year, replication within years and line × year interactions as random effects.
The variance components were designed as follows:
: Phenotypic variance.
: Genotypic variance.
: Residual variance.
: Variance due to line × year interaction.
The phenotypic variance ( ) is the sum of all variance components:
The genotypes variance was estimated by subtracting non-genetic variance components from the genotypic variance.
These variance components quantify the variance attributed to various sources:
: represents the variance due to genetic effects from lines fixed effect and related interactions; : denotes the residual variance, unexplained variability within replication and year; : captures the variance due to the lines × year interaction.
Expected genetic advance for each character at 5% selection was determined using the formulae described by Johnson et al. (1955) [24] as follow.
where GA = expected genetic advance, K = selection differential (constant) where K = 2.056 at 5% selection intensity, σP = phenotypic standard deviation on mean basis, and h2 = heritability in the broad sense, H represents the broad-sense heritability of iron and zinc.
Genotype, Environment and year effects were significant (p < 0.001) for iron and zinc (Table 4). Differences between the genotype × environment and the genotype × year were significant (p < 0.001) for zinc, but not significant for iron. Environment × year interaction was not significant for both iron and zinc. The genotype × environment × year interaction was significant for iron and zinc (Table 4).
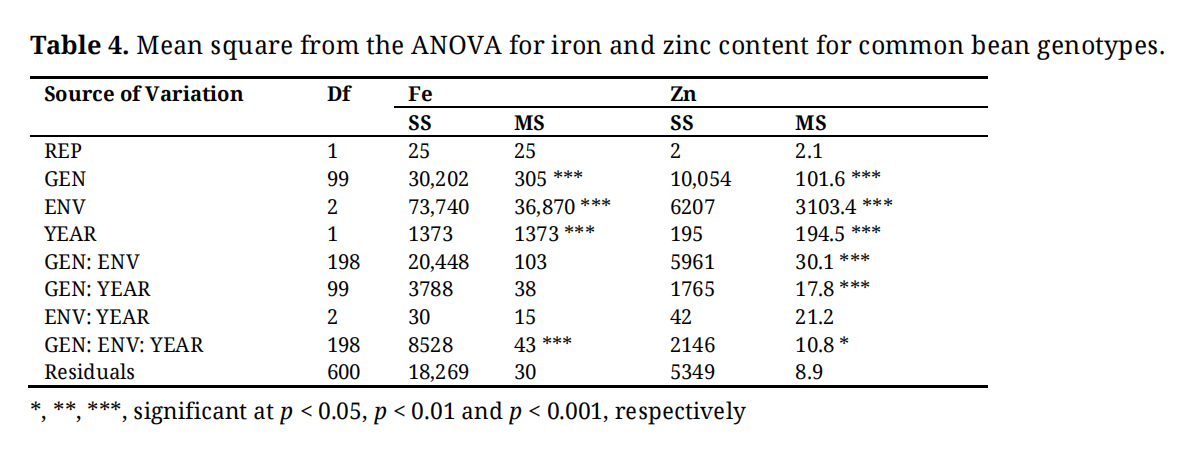 Table 4. Mean square from the ANOVA for iron and zinc content for common bean genotypes.
In the GGE genotypes plus genotype-by-environment interaction (G + GEI) biplot analysis for iron content, the first two principal components together explained 57% of the total G + GEI variation (Figure 1), providing a reliable basis for interpretation. The positions of Akumadan_1 and Akumadan_2 are farther from the ideal center, indicating strong discriminative ability but weak representativeness. A similar pattern was observed for Fumesua_1 and Fumesua_2, which also lie away from the center, showing moderate discrimination but reduced representativeness. In contrast, Bunso_1 and Bunso_2 are closer to the concentric circle center, making them more balanced environments for both ranking genotypes and reflecting overall growing conditions for iron. This positioning implies that Bunso across both years provides the most reliable basis for genotype evaluation, while Akumadan and Fumesua remain useful for detecting specific adaptation and GEI patterns. It is important to note that the environmental main effect (E) is not considered in GGE biplot interpretation, and as the method focuses on genotype main effect (G) plus GEI, which are the relevant components for comparing and selecting genotypes across environments. For zinc content, the first two principal components together explained 52.72% of the G + GEI variation (Figure 2), confirming the reliability of the biplot. As with iron, Bunso_2 and Bunso_1 were closest to the ideal center, making them the most balanced environments for zinc evaluation, while Akumadan and Fumesua remained more discriminative but less representative.
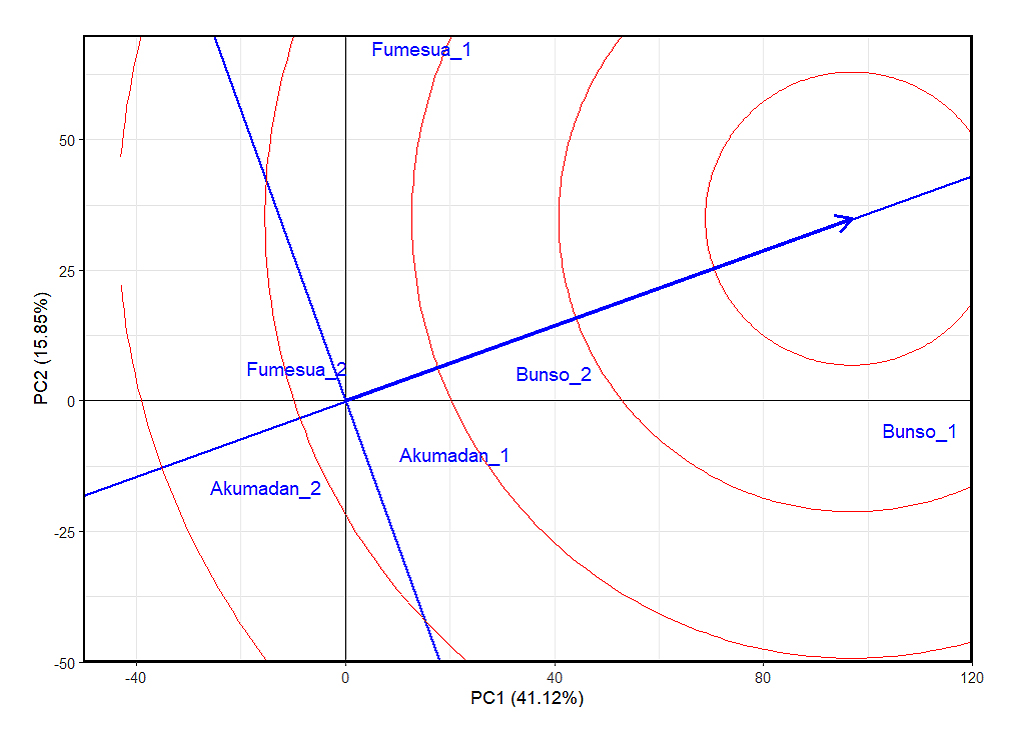 Figure 1. The GGE biplot “environmentranking” pattern of environment comparison with the ideal environment, showing the G + GEI (where GEI stands for genotype × environment interaction) effect on 100 common bean lines for iron across years (2023−2024). 1 = 2023 and 2 = 2024, PC1 and PC2 represent the first and second principal components of GE (main effects) and GEI (interaction effects), respectively. Circles describe environments, indicating discriminating ability and representativeness.
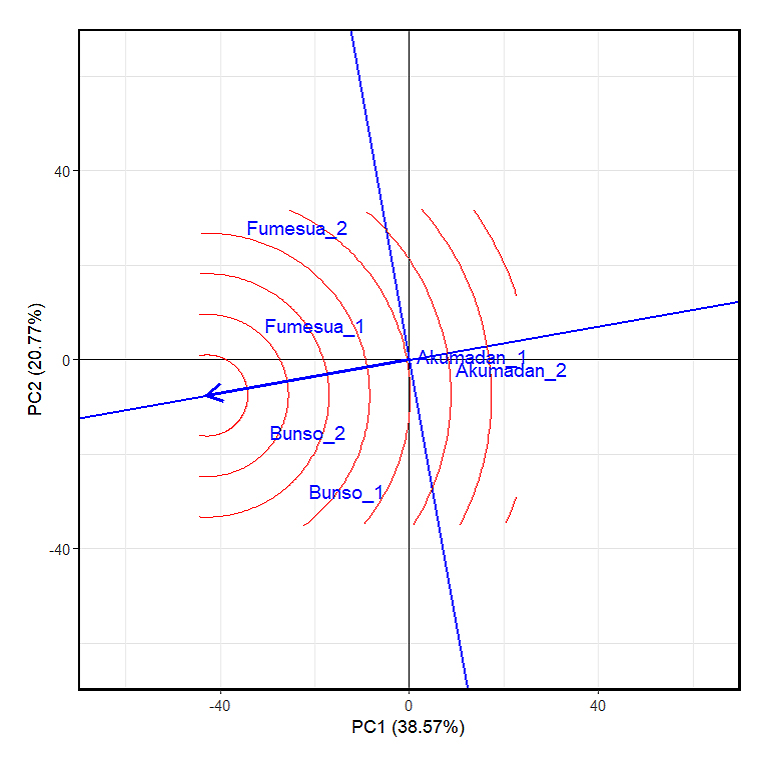 Figure 2. The GGE biplot “environmentranking” pattern of environment comparison with the ideal environment, showing the G + GEI (where GEI stands for genotype × environment interaction) effect on 100 common bean lines for zinc across years (2023–2024). 1 = 2023 and 2 = 2024, PC1 and PC2 represent the first and second principal components of GE (main effects) and GEI (interaction effects), respectively. Circles denote environments, indicating discriminating ability and representativeness.
GGE biplot based on lines-focused scaling to rank environments, the Average Environment Coordinate (AEC) represents the main effect of the lines, reflecting their mean performance for iron content. The arrow along the AEC axis indicates increasing line performance, while the perpendicular distance represents GEI, where greater distance from the origin indicates stronger GEI effects and instability. Accordingly, lines such as G64, G70, G86, G66, and G68 were positioned closer to the AEC axis with short projections, indicating strong stability across environments. Importantly, these lines also aligned positively along the AEC arrow, reflecting high mean iron content combined with consistency, making them particularly promising candidates for breeding and selection. In contrast, lines such as G31, G40, G47, G52, and G60 exhibited long projections away from the AEC axis, signifying pronounced GEI effects and reduced stability. Their placement corresponded to lower average iron yields, underscoring their limited adaptability across diverse environments (Figure 3).
Lines such as G11, G13, and G21 exhibited long projections from the average environment axis, indicating greater instability despite potentially high mean zinc content. In contrast, lines such as G5, G71, G2, and G96 displayed short projections and were positioned closer to the AEC axis, suggesting stable zinc performance across environments (Figure 4).
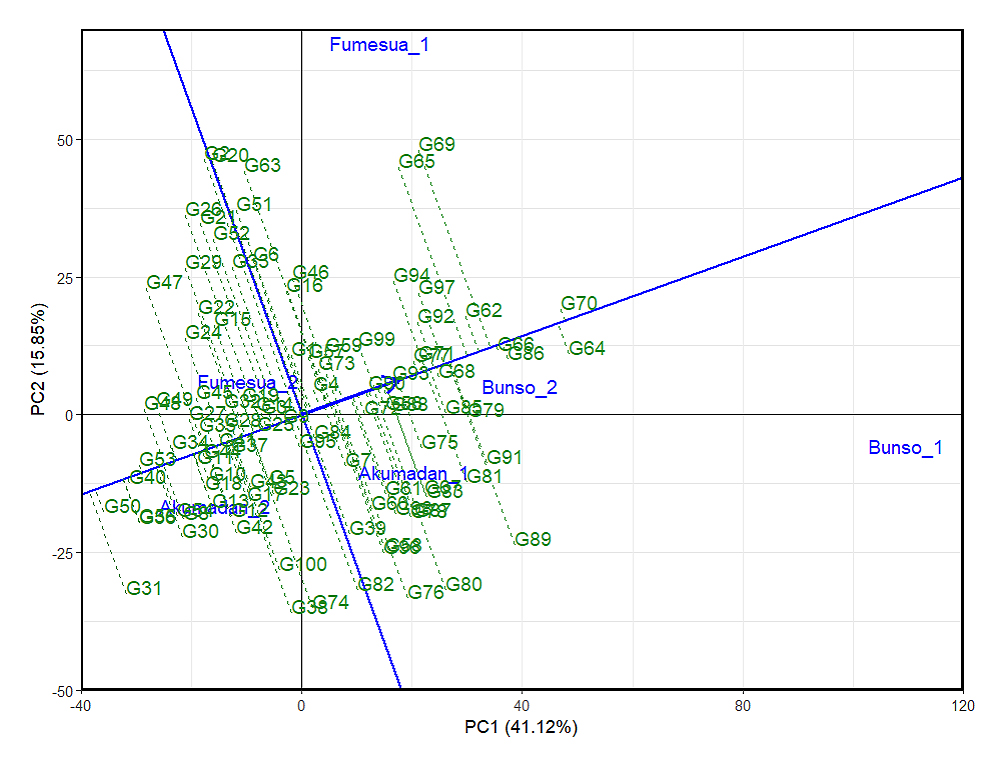 Figure 3. GGE biplot showing the ranking of 100 common bean lines for mean iron and stability based on the average environment across years (2023–2024). 1 = 2023 and 2 = 2024, PC1 and PC2 represent the first and second principal components of GE (main effects) and GEI (interaction effects), respectively. Lines denote genotypes, reflecting performance and stability.
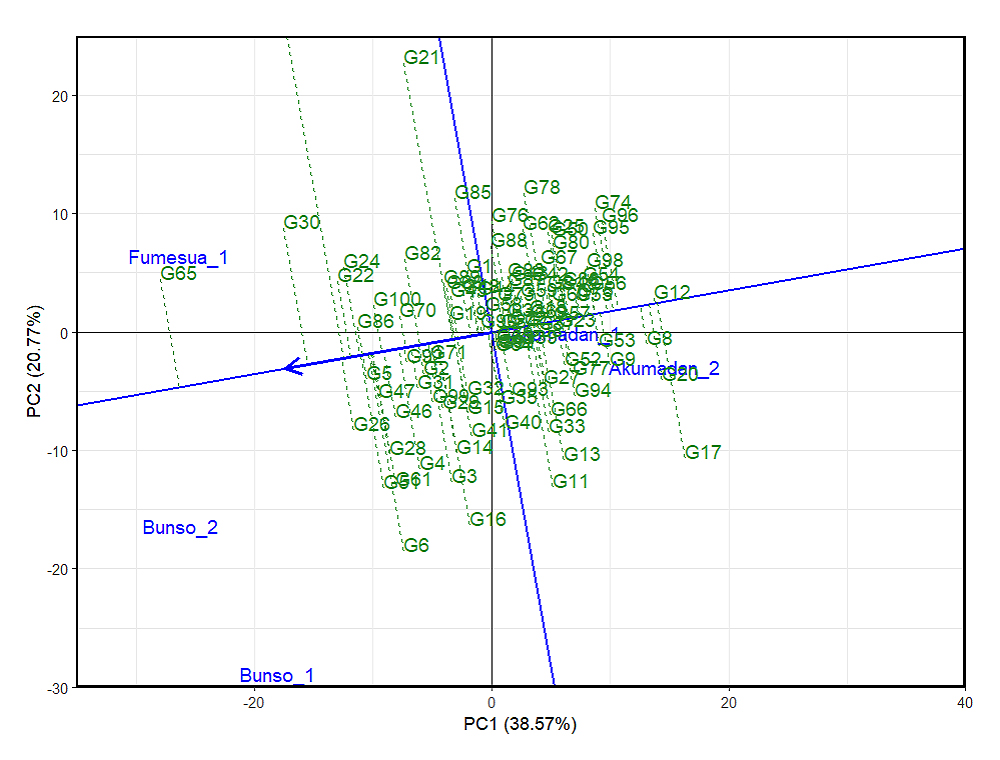 Figure 4. GGE biplot showing the ranking of 100 common bean lines for mean zinc and stability based on the average environment across years (2023–2024). 1 = 2023 and 2 = 2024, PC1 and PC2 represent the first and second principal components of GE (main effects) and GEI (interaction effects), respectively. Lines denote genotypes, reflecting performance and stability.
Based on the scaling for comparison of lines using the GGE biplot, a line located nearest to the central concentric circle is both high in iron content and highly stable. Such line is considered ideal, and other lines that fall closest to it are also considered as potential. Accordingly, G70 was located closest to the biplot origin (Figure 5), making it the most potential candidate line since it exhibited superior performance and stability, thus representing a strong candidate for iron selection across the mega-environment. This was followed by G64 and G86, which also demonstrated favorable performance and adaptability across multiple environments for year 2024. Conversely, G31 was positioned farthest from the biplot origin, identifying it as the poorest-performing line in terms of both iron content and stability. Similarly, G47 and G20 were also located at distant positions, reflecting low iron content and poor stability, and thus are less suitable for broad adaptation. Concerning zinc content, G65 was located closest to the biplot origin (Figure 6) making it the best candidate line since it exhibited superior performance and stability, thus representing the most outstanding line for zinc selection across multiple environments, followed by G30 and G26. Conversely, G11 was located farthest from the biplot origin, making the line the poorest-performing line in terms of zinc content and stability, followed by G13 and G33, which also showed low zinc content and poor stability.
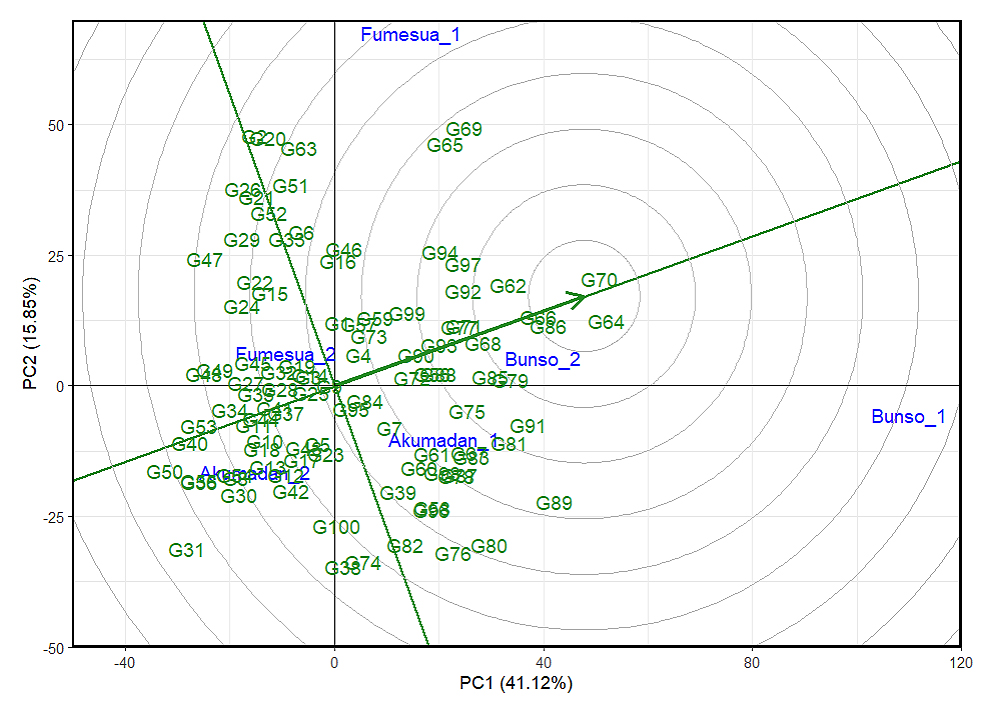 Figure 5. The GGEbiplot “lineranking” pattern for environment comparison with the ideal environment showing the G + GEI (where GEI stands for Line × Environment interaction) effect of 100 lines for iron across years (2023–2024). 1 = 2023 and 2 = 2024, PC1 and PC2 represent the first and second principal components of GE (main effects) and GEI (interaction effects), respectively. Circles stand for environments, indicating discriminating ability and representativeness, while lines denote genotypes, reflecting performance and stability.
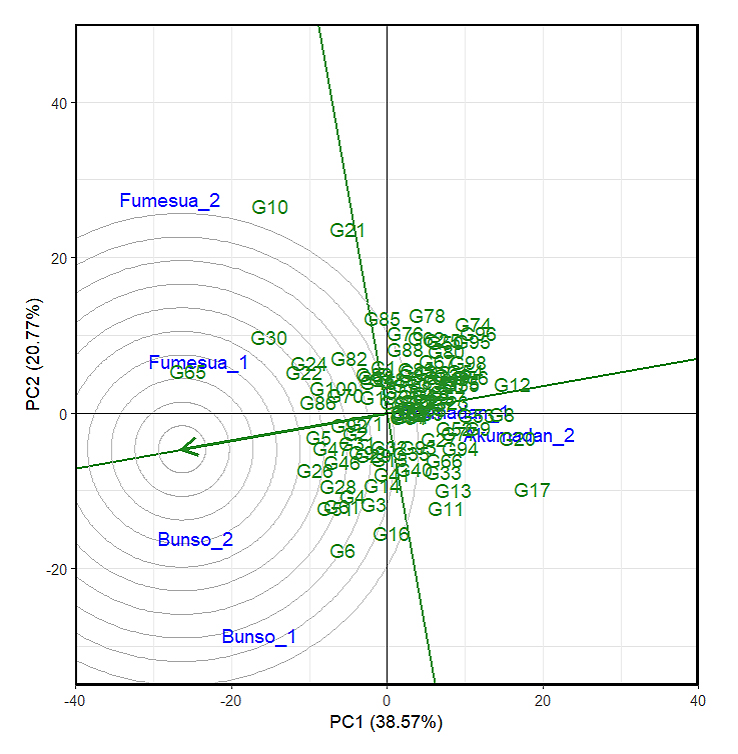 Figure 6. The GGE biplot “lineranking” pattern for environment comparison with the ideal environment, showing the G + GEI (where GEI stands for Genotype × Environment interaction) effect of 100 lines for zinc across years (2023–2024). 1 = 2023 and 2 = 2024, PC1 and PC2 represent the first and second principal components of GE (main effects) and GEI (interaction effects), respectively. Circles denote environments, indicating discriminating ability and representativeness, while lines denote genotypes, reflecting performance and stability.
The visualization of the “which won where” pattern across three environments evaluated over two years in multi-environment trials (Akumadan, Bunso, and Fumesua) for iron content revealed G89, G64, G70, G65, G69, G2, G47, G50 and G31 as the vertex genotypes (Figure 7), indicating that they exhibited extreme performance in terms of iron concentration and stability in specific environments. Among them, G50, G38 and G31 recorded the highest iron content and were the most suitable lines for the district of Akumadan in 2024 and G80 and G89 in 2023. Similarly, G47 and G2; G69 and G65 showed superior iron content and were the most suitable lines for Fumesua in 2024 and 2023, respectively. Whereas G70 and G64 were the best-performing lines for Bunso in 2024. In addition, the visualization of the “which-won-where” pattern for zinc content identified G17, G21, G10, G65 and G6 as the vertex genotypes (Figure 8), indicating that the lines exhibited extreme performance in terms of zinc concentration and stability in specific environments and years. Among them, G17 and G12 recorded the highest zinc content and were the most suitable lines for the district of Akumadan in 2024 and 2023 respectively, whereas G6 showed high zinc content and were the most suitable lines for Bunso in 2024, followed by G65 G10 and G21 for Fumesua in 2024 and 2023 respectively.
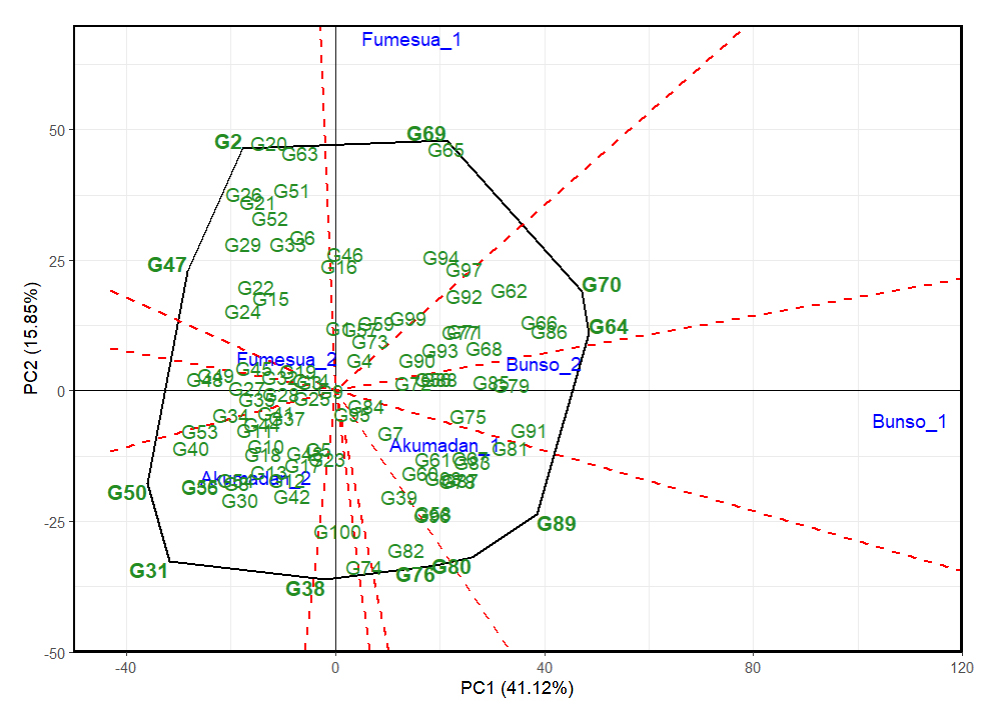 Figure 7. “Which-won-where” patterns of GGE biplots based on 100 advanced common bean lines for iron across environments and years (2023–2024). 1 = 2023 and 2 = 2024, PC1 and PC2 represent GE (main effects) and GEI (interaction effects), respectively. Polygon = outer lines (potential winners), dotted lines = sector boundaries (which‑won‑where interpretation).
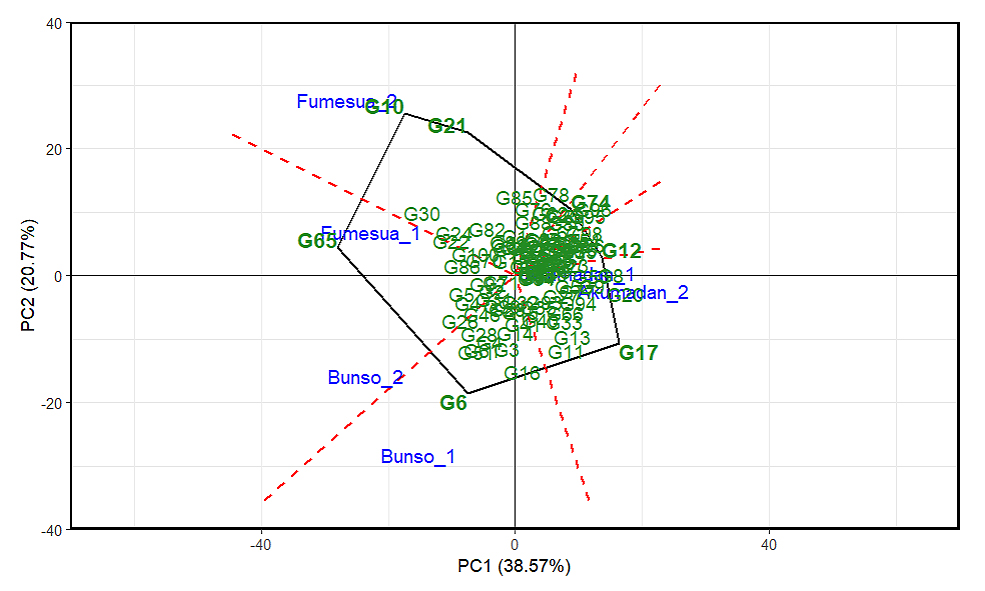 Figure 8. “Which-won-where” patterns of GGE biplots based on 100 advanced common bean lines for zinc across environments and years (2023–2024). 1 = 2023 and 2 = 2024, PC1 and PC2 represent GE (main effects) and GEI (interaction effects), respectively. Polygon = outer lines (potential winners), dotted lines = sector boundaries (which‑won‑where interpretation).
Crosses between low and high Fe’s parents yielded several high-Fe lines. Notably, GH-MR67-20 (G64) and GH-MR8-20 (G68) derived from backcross (MCR-ISD-672 × RWR2154) × RWR2154, and as recorded Fe contents of 110.7 mg/kg and 102.3 mg/kg; respectively, thereby reinforcing high Fe potential from the recurrent parent. Similarly, lines such as GH-MR39-20 (G86) and GH-RN5-20 (G1), with Fe contents of 100.0 mg/kg and 98.5 mg/kg, exceeded parental values and demonstrated transgressive segregation (Table 5). Additional lines such as GH-MR7-20 (G40) and GH-MR46-20 (G447) showed moderate Fe levels (64–67 mg/kg), indicating acceptable improvement over low parents. These outcomes suggest that single crosses are effective for generating transgressive Fe lines, while backcrosses consolidate high Fe traits with moderate stability.
The genetic crosses between low and high zinc (Zn) parent lines revealed clear differentiation in outcomes, with backcrosses generally reinforcing higher Zn accumulation compared to single crosses (Table 6). Among the advanced lines derived from single crosses, MCR-ISD-672 × RWR2154 produced GH-MR47-20 (G46) and GH-MR80-20 (G30), which reached 41.7 and 39.1 mg/kg, both exceeding the parental Zn levels, while CAL96 × RWR2154 yielded GH-CR6-20 (G92) at 39.7 mg/kg, also surpassing the parent with high mineral content. In contrast, other advanced single-cross derivatives such as GH-MR39-20 (G50), GH-MR26-20 (G70), and GH-CR9-20 (G93) recorded 26.9, 25.6, and 27.1 mg/kg respectively, showing only slight genetic improvements over the low parent baseline. Additionally, backcrosses demonstrated stronger reinforcement of high Zn traits, with GH-MR6-20 (65) reaching 51.4 mg/kg, the highest value observed in this study. While advanced single-cross lines generated both promising high-Fe lines and modestly improved low-Zn lines, backcrossing proved to be the most reliable strategy for consistently elevating Fe and Zn concentration.
 Table 5. Stable iron performance in advanced common bean lines under genotype + g × environment interaction and year effects.
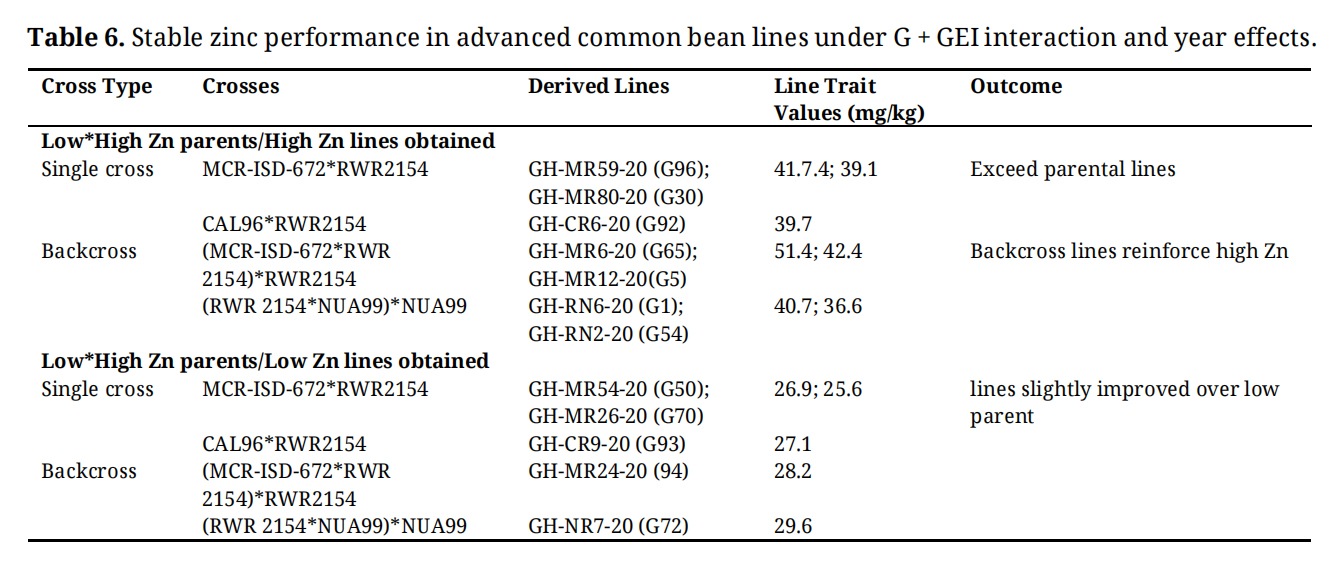 Table 6. Stable zinc performance in advanced common bean lines under G + GEI interaction and year effects.
The grand mean value for iron (Fe) was 70.7 mg/kg, while zinc (Zn) had a mean of 34.3 mg/kg (Table 7). Variance components analysis for iron ranged from 95.1 to 114.8 and from 40.9 to 60.6 for zinc. Environmental variance showed a higher value for iron (114.8) compared to zinc (19.7). The environmental coefficient of variance (ECV%) for iron was 15.2%, slightly higher than that of zinc (12.9%). Similarly, the genotypic coefficient of variance (GCV%) was higher for iron (18.7%) compared to zinc (13.8%). However, the phenotypic coefficient of variance (PCV%) was also higher for iron (22.7%) than for zinc (20.5%). Moderate broad-sense heritability (45%) was found for iron, whereas zinc showed a higher heritability (67%). The genetic advance (GA%) for iron content was 13.5% compared to 10.8% for zinc.
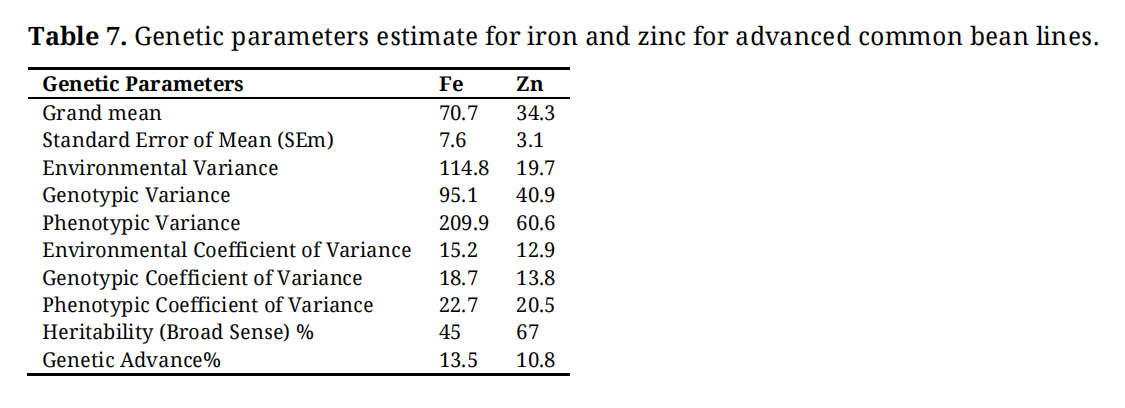 Table 7. Genetic parameters estimate for iron and zinc for advanced common bean lines.
In this study, the contribution of G + GEI to the variation in seed iron (Fe) and zinc (Zn) contents were clearly demonstrated across 92 advanced common bean lines, four parents, and four checks evaluated in multiple environments and years. Significant effects of genotype, environment, year and the interactions among these factors were observed for both micronutrients. The results highlight the complexity of micronutrient accumulation in common bean and emphasize the importance of evaluating stability and adaptability across diverse agro‑ecological conditions to identify lines with consistent and enhanced nutritional performance.
The GGE biplot methodology has been widely applied to identify representative and discriminative test environments in multi-location trials. According to Yan et al. (2002) [25], an ideal environment is characterized by a long vector coupled with a small IPCA score, positioning it near the center of concentric circles. Such environments are both highly representative of the targeted growing conditions and effective in discriminating against genotypic performance. GGE biplot analysis explained 57% and 52.72% of the G + GEI variation for iron and zinc, respectively. These values are consistent with those reported in GGE‑biplot analyses of multi‑environment yield trials on common bean (Phaseolus vulgaris L.) in southern Ethiopia, where the first two principal components similarly accounted for more than half of the total G + GEI variation [26]. Bunso was the most representative environment, balancing discriminative ability and representativeness. Similar findings were reported by Yan et al. (2002) [25], who emphasized that environments close to the biplot center provide reliable insights into genotype stability. The representativeness of Bunso can be attributed to its relatively rich soil micronutrient profile, particularly higher baseline levels of iron and zinc, combined with favorable agro‑ecological conditions such as greater annual rainfall, which support consistent mineral uptake compared to Akumadan and Fumesua. In line with Akumadan’s strong discriminative capacity yet weak representativeness, Ndebeh et al. (2017) [27] similarly reported that sites with high discriminative ability in early maturing maize were less effective for broad adaptation testing. Comparable findings have been reported in maize trials [28], where environments positioned near the biplot center offered breeders reliable insights into genotype stability and broad adaptation.
These results highlight the dual importance of representative sites for broad adaptation and discriminative sites for uncovering GEI, reinforcing the methodological principle that GGE biplot interpretation focuses on G + GEI rather than environmental main effects.
Advanced lines such as G64, G70, G86, G66 and G68 exhibited high mean Fe content coupled with short projections on the AEC axis, indicating strong stability across diverse environments. These lines represent promising candidate varieties for broad adaptation and biofortification programs, as they combine superior nutritional quality with consistent performance. In contrast, lines including G31, G40, G47, G52, and G60 were characterized by low mean Fe content and long projections, reflecting pronounced GEI effects, instability, and therefore limited breeding value. The differentiation between stable high-performing and unstable low-performing lines is consistent with earlier GGE biplot applications [21,26], which emphasize that lines with high mean performance and stability are the most suitable for release and further improvement. Moreover, lines such as G5, G2 and G96 exemplify the desirable combination, showing high zinc content alongside short projections that reflect consistent performance across environments. By contrast, genotypes including G50, G72, G88 and G95 displayed long projections, suggesting instability. These patterns resonate with earlier findings in rice, where stable high-zinc genotypes were prioritized for varietal release [29,30]. Similar outcomes have also been reported in cowpea where genotypes positioned on the right side of the biplot with short projections were identified as nutritionally superior and broadly adaptable [31]. The consistency across crops underscores the robustness of the GGE biplot approach in identifying stable and nutrient-rich genotypes from unstable or low-performing ones, reinforcing that stability coupled with high zinc accumulation remains the most desirable trait combination for biofortification programs.
The “which‑won‑where” pattern provides valuable insight into how genotypes respond across contrasting environments, offering a clear framework for identifying lines with either broad stability or specific adaptation. By visualizing performance across Akumadan, Bunso, and Fumesua, the GGE biplot highlights vertex genotypes that exhibit extreme behavior in terms of iron and zinc concentration, thereby revealing the best candidates suited for targeted environments and defining potential mega‑environments. For iron, G50 and G89 were most suitable for Akumadan in 2024 and 2023, respectively, while G47 and G65 excelled in Fumesua across both years, and G70 and G64 performed well in Bunso. This distribution suggests that Akumadan and Fumesua represent distinct mega‑environments, each favoring specific genotypes, whereas Bunso emerges as a more representative environment with genotypes showing broader adaptability. For zinc, G17 and G12 were superior in Akumadan, G6 and G65 in Bunso, and G10 and G21 in Fumesua, again reflecting the partitioning of environments into mega‑environment clusters. These findings align with recent rice studies where GGE biplot analysis successfully identified stable high‑zinc genotypes across multiple environments [32]. Comparable results in maize also highlighted that micronutrient‑rich hybrids exhibited environment‑specific superiority under varying nitrogen conditions [33]. In contrast, pearl millet studies emphasized the importance of broad stability, showing that genotypes closest to the biplot origin were prioritized for biofortification programs rather than those with environment‑specific peaks [34]. Collectively, the comparisons reinforce that while vertex genotypes are valuable for targeted adaptation within specific mega‑environments (e.g., Akumadan, Bunso, Fumesua), lines combining high micronutrient density with broad stability across environments remain the most desirable for long‑term biofortification strategies.
Crosses between low and high Fe parents in our study produced both transgressive segregants and reinforced high-Fe lines, while Zn crosses yielded promising transgressive lines but showed greater consistency under backcrossing. Our findings are consistent with those of Pramanik et al. (2024) [35] who reported transgressive segregants in advanced generations of French bean, particularly for yield and its component traits. The results confirm that transgressive segregation remains a valuable mechanism for generating superior genotypes beyond parental limits while backcrossing provides a reliable strategy for consolidating high trait values, underscoring the effectiveness of combining single crosses for variability with backcrosses for stability in micronutrient biofortification.
The ECV% further supports these findings with Fe content showing a higher value than Zn, which is consistent with results from previous research studies indicating greater environmental variability for Fe content in common beans [36]. The GCV% was higher for Fe than for Zn, indicating greater genetic diversity for Fe content, which is in line with earlier studies that report more genetic variation for Fe than for Zn in common beans [37]. Similarly, PCV% was higher for Fe than Zn, suggesting a stronger environmental influence on Fe content as presented in other studies on biofortified crops [38].
Broad-sense heritability for Fe was moderate, while Zn content presented a higher heritability indicating that Zn content is more genetically controlled. This observation is consistent with the findings of Sperotto et al. (2021) [39] who reported higher heritability for Zn in common beans compared to Fe. The GA% was higher for Fe than for Zn, but when expressed as a percentage of the mean (GAM%), Fe showed higher value compared to Zn. The result suggests that Fe content could still respond effectively to selection despite its moderate heritability. The conclusion was supported by studies showing that genetic improvement in Fe through breeding is still achievable even in the presence of environmental variability [36]. These findings suggest that while Fe is more environmentally sensitive, it still possesses sufficient genetic variation for improvement through selection. On the other hand, Zn with its higher heritability and lower environmental variance appears to be more stable and predictable for breeding. Previous studies have shown that Fe and Zn accumulation in common beans is controlled by complex genetic mechanisms including quantitative trait loci (QTLs) with varying environmental interactions and further supporting the use of marker-assisted selection (MAS) for improving the two micronutrients [40].
Multi-location trials are essential for evaluating genotypic performance under diverse growing conditions, and the GGE biplot methodology provides a powerful framework for understanding G + GEI. By simultaneously assessing mean performance and stability, the approach enables breeders to identify environments that are both representative and discriminative, as well as genotypes that combine nutritional superiority with adaptability. This study has identified the advanced lines G64, G70, G86, G66, and G68 as the most stable and high in iron content while G5, G2, and G96, were the most stable and high in zinc content. The poorest-performing lines for iron were G31, G40, G47 G52, and G60, and for zinc were G50, G88, and G95. The “which-won-where” visualization further revealed environment-specific winners for iron including G50 and G89 in Akumadan, G47 and G65 in Fumesua, and G70 and G64 in Bunso; and for zinc, G17 and G12 in Akumadan, G6 and G65 in Bunso, and G10 and G21 in Fumesua.
The following supplementary materials are available online.
The raw data from this study are available from the corresponding author upon request.
Conceptualization, MC, LB, VOA, SY and JYA; methodology, MC, LB, VOA, SY, and JYA; validation, LB, VOA and MC; formal analysis, MC; investigation, MC; data curation, MC; writing—original draft preparation, MC; writing—review and editing, MC, LB, VOA, SY, and JYA; supervision, LB, VOA, SY and JYA. All authors have read and agreed to the published version of the manuscript.
The authors declare no conflicts of interest.
This work was funded by the Africa Union (AU) through the Pan African University Life and Earth Sciences Institute (including Health and Agriculture), Ibadan, Oyo State, Nigeria and Alliance Bioversity International and International Center for Tropical Agriculture (CIAT) through the Pan-Africa Bean Research Alliance (PABRA).
We thank Bonaventure Aman Omondi ALLIANCE Bioversity & CIAT Cotonou/BENIN for paper review. We also thank Lamptey Maxwell of CSIR-Crops Research Institute, Fumesua, P. O. Box 3785 Kumasi Ghana for technical assistance in trial’s establishment and phenotyping data collection and Ndayizeye Viateur of HarvestPlus—Alliance Bioversity-CIAT for technical assistance in the minerals analysis.
1.
2.
3.
4.
5.
6.
7.
8.
9.
10.
11.
12.
13.
14.
15.
16.
17.
18.
19.
20.
21.
22.
23.
24.
25.
26.
27.
28.
29.
30.
31.
32.
33.
34.
35.
36.
37.
38.
39.
40.
Chabi M, Butare L, Yeboah S, Asibuo JY, Adetimirin VO. Genotype × environment effect and genetic parameter estimate for iron and zinc in advanced common bean lines. Crop Breed Genet Genom. 2025;7(4):e250017. https://doi.org/10.20900/cbgg20250017.

Copyright © Hapres Co., Ltd. Privacy Policy | Terms and Conditions