Location: Home >> Detail
Crop Breed Genet Genom. 2025;7(4):e250018. https://doi.org/10.20900/cbgg20250018
 ,
Louis Butare 2,* ,
Stephen Yeboah 3,4 ,
James Yaw Asibuo 3,4 ,
Victor O. Adetimirin 5
,
Louis Butare 2,* ,
Stephen Yeboah 3,4 ,
James Yaw Asibuo 3,4 ,
Victor O. Adetimirin 5
1 Life and Earth Sciences Institute (including Health and Agriculture), Pan African University, Ibadan 200132, Oyo State, Nigeria
2 Alliance of Bioversity International & International Center for Tropical Agriculture (CIAT), c/o International Institute of Tropical Agriculture (IITA)-Benin Station, Abomey Calavi 08 BP 0932, Cotonou, Benin
3 Council for Scientific and Industrial Research (CSIR)-Crops Research Institute, Fumesua, Kumasi P.O. Box 3785, Ghana
4 Department of Plant Resources Development, Council for Scientific and Industrial Research (CSIR)-College of Science and Technology, Fumesua-Kumasi, Ghana
5 Department of Crop and Horticultural Sciences, University of Ibadan (UI), Ibadan 200005, Oyo State, Nigeria
* Correspondence: Louis Butare
The performances of 100 common bean (Phaseolus vulgaris) genotypes comprising 92 advanced lines, 4 parental lines, and 4 commercial checks were evaluated for grain yield and yield components across three locations during June to August in both 2023 and 2024. Data collected on yield and other agronomic traits were analyzed using the Additive Main Effects and Multiplicative Interaction (AMMI) model to assess genotype × environment (G×E) interactions and identify stable, high-yielding genotypes. Genotypic, environmental, and G×E interactions significantly influenced yield and its components. Lines GH-MR77-20 (1307.1 kg ha⁻¹), GH-MR46-20 (1294.0 kg ha⁻¹), GH-MR72-20 (1238.3 kg ha⁻¹), and GH-MR44-20 (1152.6 kg ha⁻¹) demonstrated high yield and stability, making them ideal for multi-environment cultivation. Lines with low AMMI Stability Value (ASV) scores such as GH-MR32-20, GH-MR65-20, GH-CR2-20 and GH-CR1-20 were identified as highly stable. However, GH-MR74-20 and GH-MR71-20 were stable according to ASV yet less productive. GH-MR77-20 and GH-MR72-20 emerged as top performers in site-specific evaluations, with GH-MR72-20 excelling at Bunso due to favorable conditions and GH-MR77-20 showing broad adaptability across locations. Positive correlations (r = 0.23 ***, r = 0.12 ***, r = 0.08 **), respectively between yield on one hand and seed weight, number of seed per pod, and seed number per plant on the other were observed, emphasizing these traits as key targets for breeding programs. Both genotype and G×E interaction effects were statistically significant. Integrating these research findings across studies, breeders will develop resilient high yield potential and stable common bean genotypes and address several agro-ecological challenges.
Common bean (Phaseolus vulgaris) has been adapted to a wide range of environments and is currently cultivated in Ghana, a tropical country, as well as in other tropical, subtropical, and temperate regions worldwide [1]. The Andean gene pool is generally large-seeded and adapted to relatively higher altitudes and lower temperatures, while the Mesoamerican gene pool is small-seeded and adapted to lower altitudes and higher temperatures [2].
Global production of dry common bean grains is 29 million metric tons for 36 million hectares [3]. Latin America is the largest producer of common bean, particularly Brazil and Mexico, with a production of approximately 5.5 million metric tons per year [4]. Despite the significant contribution of West Africa to the global common bean production, accounting for 12.1% of the total 7 million hectares produced (964.1 kg ha⁻¹) in Africa, the region faces challenges in optimizing production levels, addressing local demand, and improving agricultural practices [5]. Wide adaptation of common bean is mainly limited by abiotic stresses such as extreme temperatures, drought, soil salinity and photoperiod sensitivity [6].
Improving grain yield is a major objective for most common bean breeding programs. An understanding of the relation between yield and other agronomic traits would provide a genetic foundation for improving grain yield [7]. Grain yield is a quantitative trait governed by multiple genes, commonly influenced by three yield components namely, number of pods per plant (NPP), number of seeds per pod (NSPo), and seed weight [8]. The three yield components are also quantitative and their relationship with grain yield is based on physiological and morphological features of the plant [9].
The analysis of G×E interactions provides valuable insights into the relative performance of genotypes under diverse environmental conditions and helps in selecting stable, high-performing varieties [10]. Studies involving G×E interactions have been extensively used to assess the adaptability and stability of various crops, including common beans [11]. Grain yield and its components in common bean, such as the NPP, NSPo, and hundred seed weight, have been shown to be influenced by G×E interactions in studies conducted in various regions, including sub-Saharan Africa [12] and Central America [13]. Many advanced common beans lines have been developed by CSIR-Crop Research Institute, Kumasi, Ghana and PABRA in West Africa with no information on their productivity and stability. The objectives of this study were to evaluate the genetic variation among 92 advanced lines of common bean for yield and stability.
Genetic materials evaluated in this study were 92 advanced lines, 4 checks, and 4 parental common bean lines. The parental lines included MCR‑ISD‑672, RWR 2154 (early maturing genotype), CAL 96 and NUA99. The varieties checks comprised of ADOYE, NSROMA, SEMANHYIA and JESCA; and their full descriptions are presented in Table 1. The materials lines were developed from two single crosses and two backcrosses involving four parents. 48 lines derived from Cross 1 (MCR-ISD-672 × RWR 2154) and 15 lines from Cross 2 (CAL 96 × RWR 2154) were selected. Progenies originated from the crosses were maintained at the Crop Research Institute in Kumasi, Ghana. F1 seeds were used to produce F2 populations, and backcross populations were developed using the recurrent parent and 20 BC lines derived from BC1P1 [(MCR-ISD-672 × RWR 2154) × RWR 2154] and 9 BC lines from BC1P4 [(RWR 2154 × NUA99) × NUA99] were selected. Backcross lines were generated by crossing F1 hybrids back to their respective parents (P1 and P4). These controlled crosses were performed by hand pollination, emasculation of the female parent followed by pollen transfer from the male parent under greenhouse at Crop Research Institute, Kumasi research station in Ghana during the main cropping season from May to August 2018 [14]. The resulting population was advanced through successive self-fertilization (selfing) by single-seed descent to the F6 generation. The 92 lines developed from the crosses carry the following acronyms: GH (Ghana), MR (cross between MCR-ISD-672 and RWR2154), RN (cross between RWR2154 and NUA99), and CR (cross between CAL96 and RWR2154). The numbers that followed the letters MR, CR, or RN indicate the specific plant selected and advanced (Supplementary Materials). The genetic materials used in this study (listed in Table 1) are identical to those described by [15]
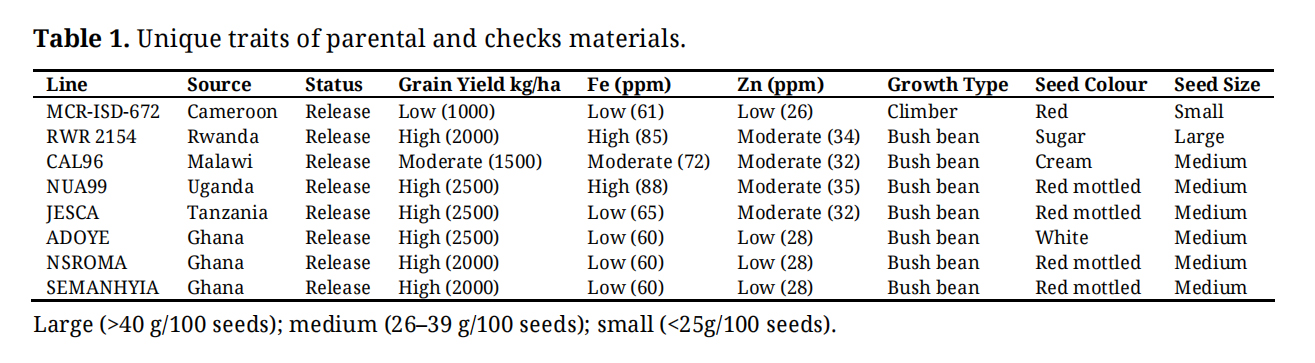 Table 1. Unique traits of parental and checks materials.
The experiments were conducted during the year 2023 and 2024 at three sites in Ghana: Akumadan, Bunso, and Fumesua (Figure 1). Akumadan (Lat. 7°23′ N, Long. 1°56′ W) is in the Transition agro-ecological zone under the Council for Scientific and Industrial Research (CSIR) in the Ashanti Region. The area has a bimodal rainfall pattern with an annual total of about 1200–1300 mm. Bunso (Lat. 5°46′ N, Long. 1°46′ W) is in the semi-deciduous forest zone of the Eastern Region, at an elevation of 149 m above sea level. It experiences a bimodal rainfall distribution with an annual average of about 1750 mm, and trials were managed by the CSIR–Plant Genetic Resources Research Institute in the East-Akim District. Fumesua (Lat. 6°46′ N, Long. 1°1′ W) lies in the semi-deciduous forest zone, also under CSIR in the Ashanti Region, and characterized by a bimodal rainfall averaging 1727 mm per year. Over a typical growing season of about 12–16 weeks, common beans would require a total of approximately 300–400 mm of water, either from rainfall or supplemental irrigation [16]. The experimental trials at Fumesua were irrigated due to considerable variation in rainfall and its distribution, which was particularly pronounced during the 2024 growing season [15]. Other monthly weather parameters during the growing season are presented in Table 2 of [15]. The highest rainfall was recorded at Bunso, while the highest temperatures were recorded at Fumesua. The highest relative humidity was observed at Bunso.
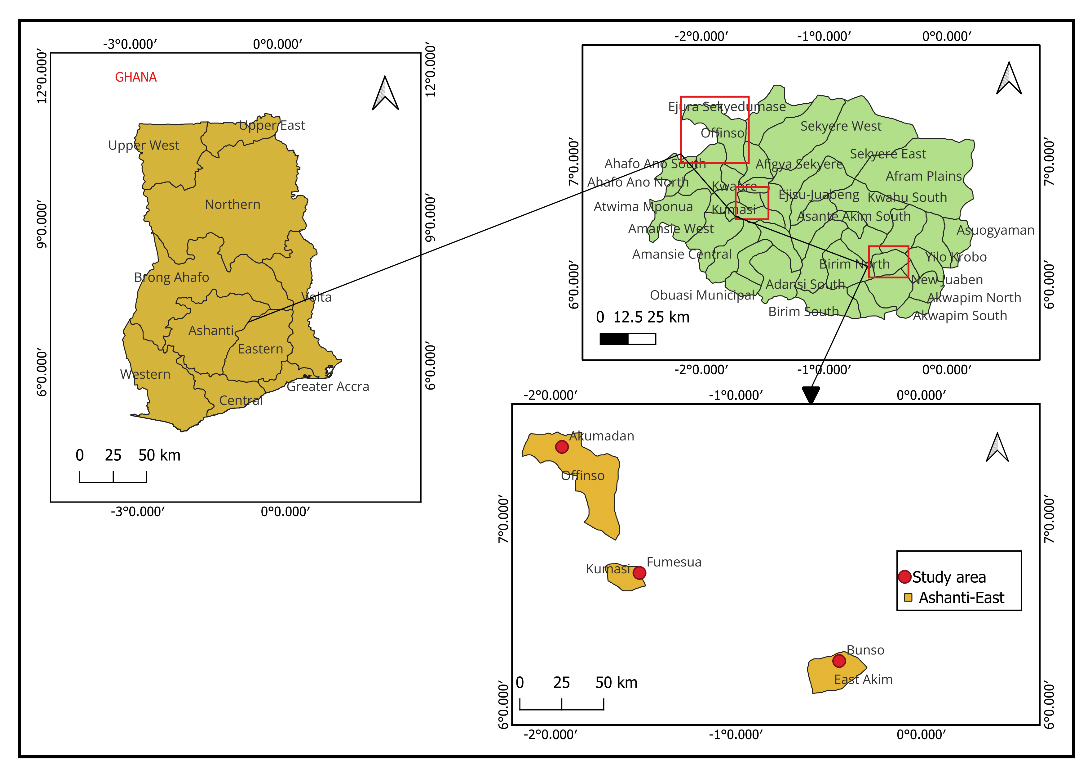 Figure 1. Study location map.
Soil samples were collected at each site and analyse (Table 3 of [15]) for organic matter (OM), organic carbon (OC), Nitrogen (N), Phosphorus (P), Potassium (K), Calcium (Ca), Magnesium (Mg), Sand, Silt, Clay, Ph, Copper (Cu) and Manganese (Mn) at the Department of Crops and Soil Sciences of the Kwame Nkrumah University of Science and Technology (KNUST) using the protocol develop by Thomas GW (1996) [17].
Experimental DesignThe experiment was laid out in a 10 × 10 lattice design with two replications per site. The experimental plot was in one row per bean line with 10 plants per row. Plants were spaced at 20 cm intervals within the row. Each row was 2 m long with 0.4 m inter-row spacing. The spacing between blocks was maintained at 0.5 m.
Data CollectionData collected include days to flowering (DF), days to 50% maturing (DM), NPP, number of seeds per plant (NSP), NSPo, hundred seeds weight (HSW) and grain yield (kg ha⁻¹). Grain yield was calculated after harvesting all plants in each row, recording the total seed weight, and converting the value to yield per hectare based on the plot area. Data were collected as outlined in the International Board for Plant Genetic Resources (IBPGR) descriptor [18] for Phaseolus vulgaris. NSPo was determined using samples of pods from 10 plants and the average recorded. One hundred seed weight was determined by weighing 100 randomly sampled seeds from the 10 plants. Grain yield was calculated using all the plants in a plot and the average weight of the seeds was used to estimate grain yield per hectare.
Data AnalysisAnalysis of variance (ANOVA) was carried out using the aov () function in R [19]. Pearson’s correlation was used to assess the relationship between post-ANOVA statistical power and mean separation, which was performed using Duncan’s Multiple Range Test (DMRT) implemented in the agricolae package [20]. AMMI model [21] using R software version 4.4.2 (R Development Corporation) was used to assess the effect of line by environment interaction, analyze the suitability of common bean lines to each environment.
The linear mixed-effects model described by [22] was used as follows:
Where:
Yijk is the observation of k-th replication in the i-th line in the jth location in the Kth year; μ is the overall mean; Gi is the effect of the ith genotype; Sj is the effect of the jth location; Yk is the effects of the Kth year; (GS)ij is the interaction effects between genotype and location; (GY)ik is the interaction effect between genotype and year; (SY)jk is the interaction effects between location and year; and εijk is the random error term.
The ASV described by [23] was calculated as follows:
where SSIPCA1/SSIPCA2 is the weight given to the IPCA1 value by dividing the IPCA1 sum of squares by the IPCA2 sum of squares. The higher the IPCA score, either negative or positive, the more specifically adapted a genotype is to certain environments. Lower ASV scores indicate a more stable genotype across environments.
The yield stability index (YSI) and rank sum (RS) were calculated as:
where RASV is the rank of the ASV and RY is the rank of the mean grain yield of genotypes (RY) across environments.
Genotype and Environment effects were significant (p < 0.001) for grain yield and all the yield components studied (Table 2). Differences between the years were significant (p < 0.001) for number of days to 50% flowering, NPP and 100 seed weight, but not significant for grain yield and number of seeds per pot. Genotype × environment and Genotype × year interaction were significant for all the five traits except Genotype × year for grain yield which was not significant. Environment × year interaction was significant (p < 0.001) all traits. Genotype × Environment × year interaction was also significant for the five traits.
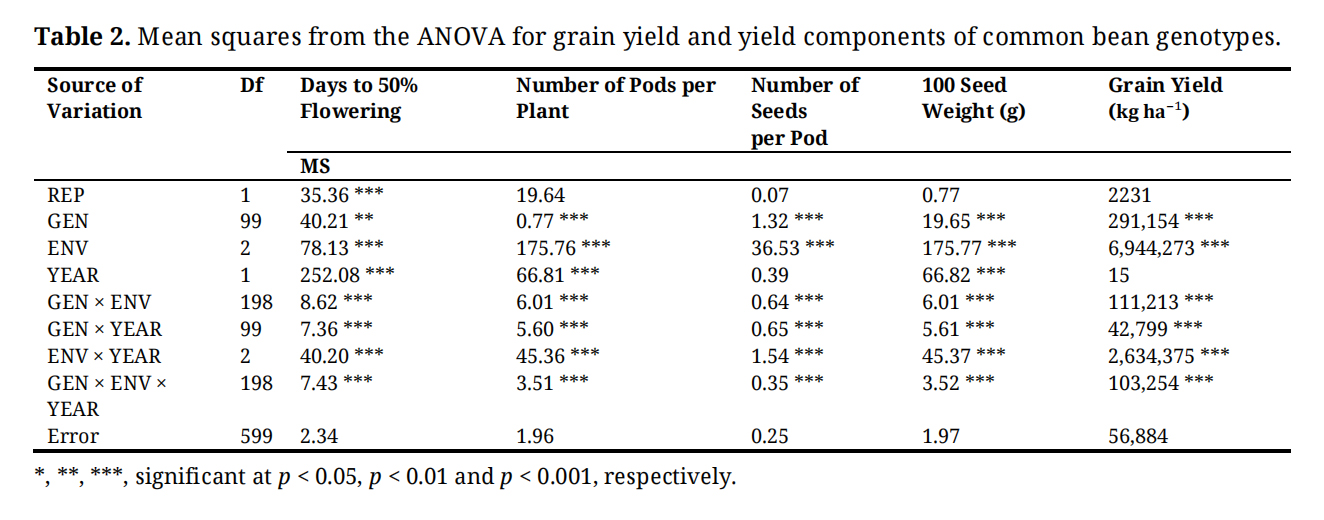 Table 2. Mean squares from the ANOVA for grain yield and yield components of common bean genotypes.
Seed yield and yield components varied across locations. Bunso recorded the highest mean grain yield (1043.4 ± 220.6 kg ha⁻¹) along with superior yield components, including pods per plant (9.2 ± 2.0), seeds per pod (26.0 ± 6.4), seeds per plant (3.2 ± 0.8), and 100-seed weight (25.9 ± 5.8). Akumadan showed intermediate performance with a mean seed yield of 871.2 ± 205.2 kg ha⁻¹, seed per plant (22.8 ± 4.8), seeds per pod (2.9 ± 0.5), and seed weight (24.0 ± 4.5). Fumesua had the lowest mean yield (811.9 ± 205.5 kg ha⁻¹), pods per plant (7.8 ± 1.1), seeds per pod (20.0 ± 5.0) and seed weight (22.7 ± 18.1) (Table 3).
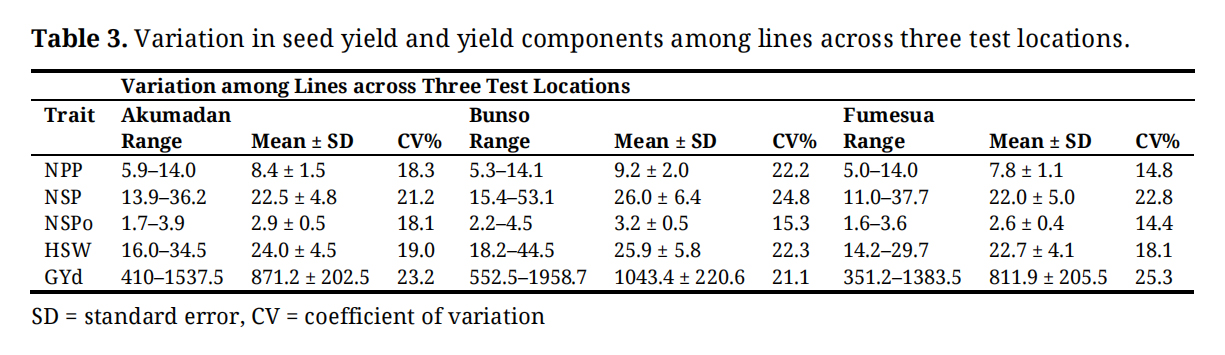 Table 3. Variation in seed yield and yield components among lines across three test locations.
Based on ASVs on grain yield of the harvested 100 common bean lines across locations, the lines were ranked based on least scores, whereby low score indicates the most stable line. ASV ranked GH-MR32-20 as the most stable line due to lowest ASV followed by GH-MR65-20, GH-CR2-20, GH-CR1-20 and GH-MR44-20. GH-MR4-20 was the most unstable line given the highest ASV, followed by GH-MR24-20, JESCA and GH-MR48-20. The sum of seed yield and AMMI stability rankings also known as YSI showed GH-MR77-20 (1307.1 kg ha⁻¹) as the highest grain yielding and moderate stability common bean line across locations, followed by GH-MR46-20 (1294.0 kg ha⁻¹), GH-MR72-20 (1238.3 kg ha⁻¹), GH-MR24-20 (1167.4 kg ha⁻¹), and GH-MR44-20 (1152.6 kg ha⁻¹). GH-MR53-20 (533.4 kg ha⁻¹) was ranked the lowest yielding line (Table 4).
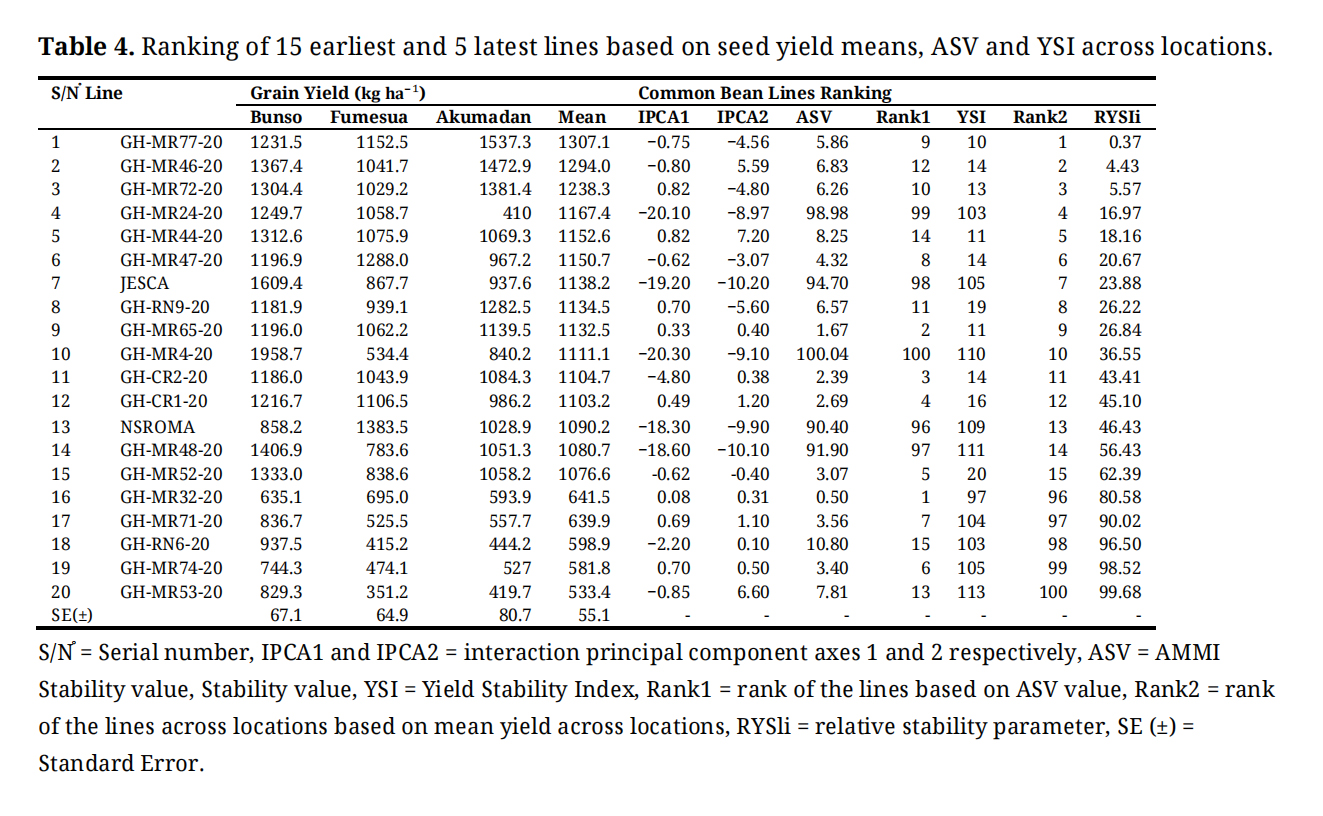 Table 4. Ranking of 15 earliest and 5 latest lines based on seed yield means, ASV and YSI across locations.
Grain yield, seed weight, flowering time, seeds per pod, and pods per plant varied considerably across locations. Bunso recorded the highest-performing lines overall, with GH-MR4-20 producing the highest grain yield (1958.7 kg ha−1), followed by GH-MR72-20 (1609.4 kg ha−1), GH-MR46-20 (1406.9 kg ha−1) and GH-MR48-20 (1367.4 kg ha−1), whereas GH-MR32-20 (635.1 kg ha−1), and GH-MR74-20 (744.3 kg ha−1) were consistently low-yielding. At Akumadan, GH-MR77-20 was the top-yielding line (1537.3 kg ha−1), with GH-MR46-20 (1472.9 kg ha−1), and GH-MR72-20 (1381.4 kg ha−1) also performing well, while GH-MR24-20 (410.0 kg ha−1), and GH-MR53-20 (419.7 kg ha−1) were the poorest. At Fumesua, the check variety NSROMA outperformed all test lines (1383.5 kg ha−1), followed by GH-MR47-20 (1288.0 kg ha−1), and GH-MR77-20 (1152.5 kg ha−1), whereas GH-MR53-20 (351.2 kg ha−1), and GH-RN6-20 (415.2 kg ha−1) had the lowest yields (Table 5).
At Bunso, GH-MR77-20 exhibited the heaviest seeds (44.5 g), with GH-MR46-20 (41.6 g), and GH-CR1-20 (40.8 g), while GH-MR75-20 (18.3 g), and GH-MR10-20 (18.4 g) produced the lightest seeds. At Akumadan, GH-MR46-20 (34.5 g), and GH-MR77-20 (33.5 g) again ranked highest, whereas GH-MR53-20 (14.5 g), and GH-CR28-20 (14.6 g) had the smallest seed weights. At Fumesua, GH-MR77-20 (29.7 g), GH-MR46-20 (29.6 g) and GH-MR61-20 (29.5 g) produced relatively heavier seeds, while GH-MR75-20 (14.3 g), and GH-MR21-20 (14.4 g) were the lowest (Table 6). Flowering time revealed GH-MR18-20 as one of the earliest lines, particularly at Fumesua (25.8 days). Pod number per plant highlighted GH-MR77-20 and GH-MR46-20 as stable high performers across environments. At Bunso, GH-CR1-20 (14.1), GH-MR77-20 (13.9), and GH-MR46-20 (12.8) ranked highest, while GH-MR62-20 (5.4), and GH-CR62-20 (6.0) were the lowest. At Akumadan, GH-CR30-20 (14.0), GH-MR46-20 (11.9), and GH-MR77-20 (11.6) were top performers, whereas GH-MR71-20 (5.9), and GH-RN9-20 (6.2) had the lowest values. At Fumesua, GH-MR77-20 (10.6), GH-MR46-20 (10.5), and GH-MR72-20 (10.4) obtained the highest pod numbers, while GH-MR7-20 (5.0), and GH-MR21-20 (5.9) were the lowest. Seed number per pod further reinforced this pattern. At Bunso, GH-MR77-20 (4.5), NUA99 (4.5), and GH-MR46-20 (4.5) ranked highest, while GH-CR43-20 (2.2) and GH-MR59-20 (2.4) were the lowest. At Akumadan, GH-MR46-20 (3.9), GH-MR6-20 (3.8), and GH-MR77-20 (3.8) performed best, whereas GH-MR80-20 (1.8) and GH-MR7-20 (1.8) had the poorest values. At Fumesua, GH-MR77-20 (3.6), GH-MR9-20 (3.3), and GH-MR46-20 (3.2) ranked highest, while GH-MR53-20 (1.6) and GH-MR79-20 (1.9) showed the lowest values (Table 7).
 Table 5. Ranking of 100 common bean genotypes for grain yield (kg ha−1): Top 15 and Bottom 5 at each location (2023–2024).
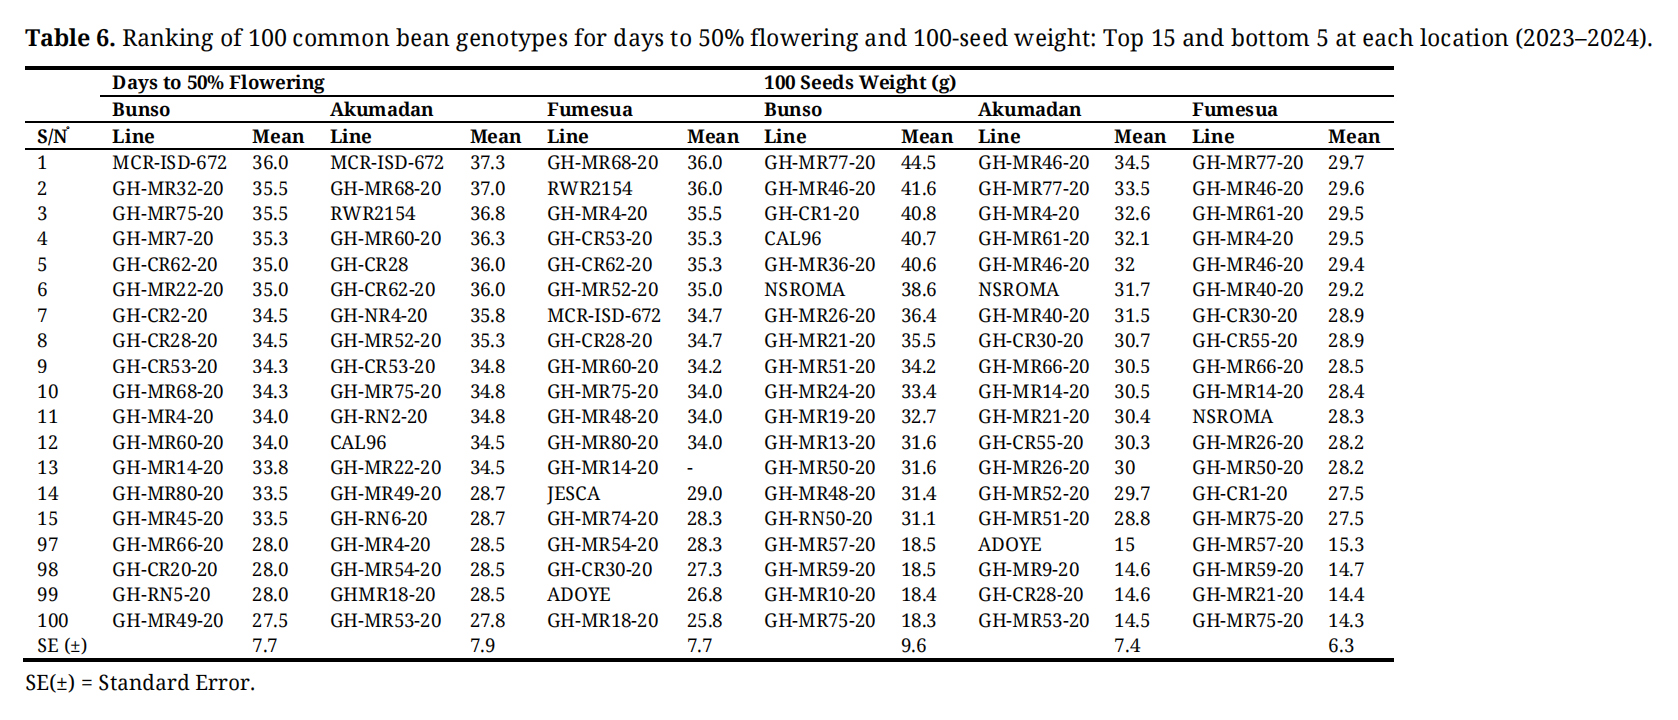 Table 6. Ranking of 100 common bean genotypes for days to 50% flowering and 100-seed weight: Top 15 and bottom 5 at each location (2023–2024).
 Table 7. Ranking of 100 common bean genotypes for number of pods per plant and number of seeds per pod: Top 15 and bottom 5 at each location (2023–2024).
The AMMI-1 biplot (Figure 2) illustrates the genotype and environment additive main effects against their corresponding first interaction principal component axis (IPCA1). Common bean lines placed on the right-hand side of the middle vertical line have higher seed yield compared to those on the left-hand side of Figure 2. Genotypes G47 (GH-MR46-20) and G52 (GH-MR44-20) had low IPCA1 scores close to zero and high seed yield. This indicates that the performance of the genotype was less influenced by G×E interaction, indicating that they were the most stable and high yielding genotypes. On the other hand, genotype G90 (GH-MR72-20), G27 (GH-MR47-20), and G10 (CAL96) exhibited the high yield and high G×E interaction while G74 (GH-MR78-20) and G68 (GH-MR67-20) had low yield and high negative G×E interaction. Among the three environments, Akumadan had the lowest G×E interaction component and yield performance whereas Bunso and Fumesua showed larger environment effects and G×E interaction component for grain yield.
 Figure 2. AMMI-1 model biplot for seed yield (kg ha⁻¹) presenting the means of 100 genotypes (G) across three environments (E) against their corresponding IPCA-1 scores.
Grain yield was positively correlated with each of 100-seed weight (r = 0.23; p < 0.001), NSPo (r = 0.13; p < 0.001) and NSP (r = 0.08; p < 0.01) (Figure 3). The highest positive correlation coefficient was obtained between NSP and NSPo (r = 0.34; p < 0.001), with correlation of 0.28 (p < 0.001) obtained between NSP and NPP. The correlation between NPP and grain yield was very low and non-significant (r = 0.02; p > 0.05). There was no significant correlation between grain yield and number of DF (r = −0.08; p > 0.05).
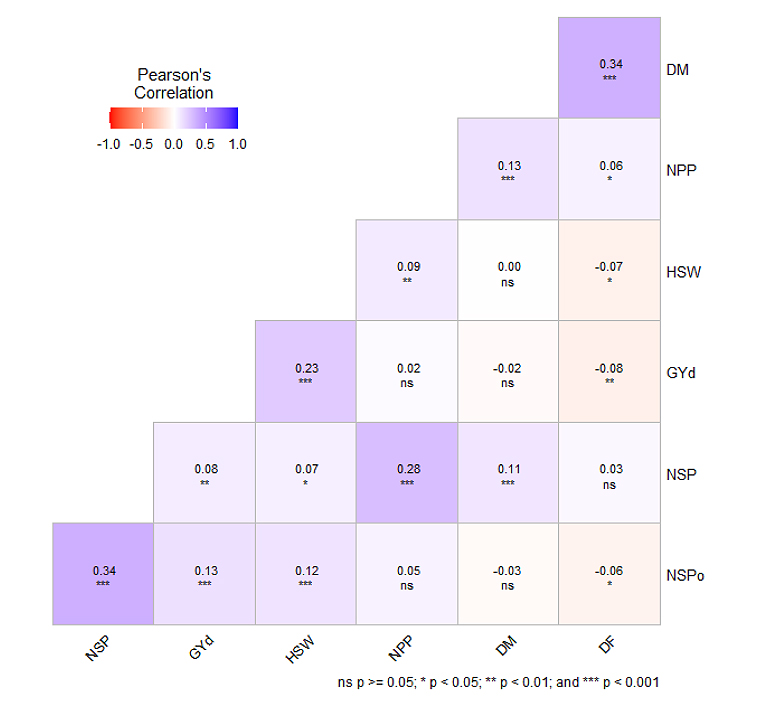 Figure 3. Pearson correlation between grain yield and yield components subjected to different environment.
In the present study, the genetic makeup of the lines, the environmental conditions at the locations, and their interactions considerably influenced the yield and yield components of the common bean lines. The influence of genotypes, environment, and lines by environment interaction in common bean has been reported [24]. Grain yield and seeds per pod remained relatively stable across years. However, the combined interaction of factors had a clear influence on these traits. Grain yield is shaped by a complex balance of environmental conditions, including rainfall distribution, temperature, soil fertility, pest and disease pressure. These factors rarely act in isolation; instead, they interact with each other and with management practices such as planting date and input use. In a year with slightly reduced rainfall crops may still produce stable yields if soil fertility is high and pest incidence is low. Conversely, favorable rainfall may not translate into higher yields if temperatures are extreme or disease pressure is high. Similar compensatory patterns among yield components have been reported in common bean, where G×E interactions influence yield stability [24]. In our study, the absence of significant year-to-year variation in grain yield and seeds per pod likely reflects such compensatory mechanisms, where unfavorable conditions in one factor were offset by favorable conditions in another. Comparatively lower yields obtained for Fumesua highlight the sensitivity of grain yield to local constraints, possible linked to poor soil characteristic moisture availability and rainfall distribution. Across the three sites, specific lines consistently emerged as top performers, underscoring the role of G×E interaction in shaping yield outcomes. These sites specific differences highlight that each environment favors distinct lines, suggesting that adaptive traits such as drought tolerance, efficient nutrient uptake, or resilience to soil constraints may be expressed differently depending on local conditions. Variation in genotypic performance across environments can be attributed to factors including rainfall patterns, temperature, soil fertility, and management practices. As reported by Yan et Tinker, (2006) [25], genotypes that perform well across multiple environments often exhibit broad adaptability or specific adaptation to high-yielding environments. GH-MR4-20 performed well at Bunso, demonstrating strong site-specific potential whereas GH-MR77-20 showed consistent performance across locations, indicates its adaptability to diverse environments. The identification of the earliest flowering lines at Bunso, Akumadan and Fumesua demonstrated the influence of G×E interaction on phenological traits. Notably, these lines were derived from parent that is itself early maturing, suggestion that earliness was inherited and consistently express across environment. Similar results were reported by Beebe et al. (2013) [13], demonstrating that early flowering and maturity in common bean are heritable traits that consistently confer adaptation to short-season environments. In addition to phenology, pod production revealed line with consistent resilience, most prominently GH‑MR77‑20, derived from Parent 2 (RWR2154). Beebe et al. (2013) [13] has found similar results and demonstrated that certain progenies from two-way and three-way crosses consistently ranked among the highest-yielding clones across diverse environments in common bean, underscoring the importance of stability and adaptability in legume breeding programs. The NSPo directly impacts final seed yield, as it determines the total seed output per plant [12]. Line GH-MR77-20, a progeny consistently exhibited a high NSPo across the Bunso and Fumesua environments, suggesting a strong genetic component for high reproductive efficiency and seed set stability. Similarly, ref. [25] reported that common bean progenies derived from two-way and three-way crosses ranked among the highest-yielding lines across environments in Ethiopia.
Adaptability and stability analysis techniques are used to select plant genotypes that show consistent performance under diverse conditions [26,27]. The AMMI model is recognized as one of the most robust analytical approaches for understanding G×E interaction in multi-environment trials [28]. In this study, GH‑MR4‑20 was ranked as the most unstable line due to its high ASV score; nevertheless, it exhibited high yield performance. This result demonstrated that superior yield potential does not necessarily coincide with stability. Such findings emphasize the importance of integrating both mean yield and stability parameters in selection decisions to ensure that breeding programs identify genotypes combining productivity with consistent performance across diverse environments. To address this limitation, the YSI was applied to identify bean genotypes that combined high yield with stability, as it integrates both traits into a single selection criterion [29]. Genotypes with lower YSI are more desirable because they exhibit both high mean yield and stability [30]. This explains why some genotypes identified as stable by ASV analysis yet exhibited relatively low yields (e.g., GH-MR32-20 and GH-MR71-20), whereas other lines with high yield but unstable ASV rankings were better captured by YSI (e.g., GH-MR24-20 and JESCA). Similar findings have been reported in common bean, where ASV alone did not always align with yield potential, and YSI provided a more reliable criterion for selecting high-yielding and stable genotypes [31]. Comparable patterns have also been observed in African yam bean, where stability indices required integration with yield measures to accurately identify superior lines [32]. The AMMI-1 biplot is an effective tool for identifying high-yielding and stable genotypes while also highlighting the contribution of environments to G×E interaction [33].
There were positive correlations among yield and seed weight, seed number per pod, and seed number per plant, highlighting promising pathways for improving productivity. Ref. [9] reported similar significant positive correlations among yield and yield components in advanced backcross populations of common bean, reinforcing the importance of the traits in breeding programs.
This study demonstrates that common bean advanced lines differ in both yield potential and stability across environments, highlighting the importance of integrating mean performance with stability indices (ASV, YSI) for selecting lines that are both productive and good adaptability. This provides breeders with evidence-based pathways to develop resilient lines suited to diverse agro-ecological conditions. Moreover, the observed trait correlation indicates that breeding strategies should prioritize improving number of seeds per pod and seed weight to enhance yield potential, while ensuring stability of seed numbers across environments. By concentrating on these components alongside stability indices, breeders can more effectively develop bean varieties that combine high yield with resilience under diverse growing conditions. Nonetheless, the analysis was restricted to a limited number of locations and lines, meaning broader multi-location trials and larger genetic pools are needed to fully capture G×E interactions and ensure wider applicability of the research findings.
This study highlights the intricate interplay of genotype, environment, and their interaction in determining grain yield and yield components of common bean lines. The AMMI model and associated stability indices, such as ASV and YSI, effectively identified high-yielding and stable genotypes with GH-MR77-20 emerging as the top performer across environments. Positive correlations between yield on one hand and hundred seed weight, NSPo, and NSP suggest potential breeding pathways, while the negative correlation with DF emphasizes the value of early maturity on the other hand. The findings provide valuable insights for developing resilient, high-yielding common bean lines suited to diverse agro-ecological conditions. Lines GH-MR77-20, GH-MR46-20, GH-MR72-20, GH-MR44-20 and GH-MR47-20 are promising for direct cultivation and use in breeding programs.
The supplementary materials are available online.
The raw data from this study are available from the corresponding author upon request.
Conceptualization, MC, LB, VOA, SY and JYA; methodology, MC, LB, VOA, SY, and JYA; validation, LB, VOA and MC; formal analysis, MC; investigation, MC; data curation, MC; writing—original draft preparation, MC; writing—review and editing, MC, LB, VOA, SY, and JYA; supervision, LB, VOA, SY and JYA; All authors have read and agreed to the published version of the manuscript.
The authors declare no conflicts of interest.
This work was funded by Africa Union (AU) through the Pan African University Life and Earth Sciences Institute (including Health and Agriculture), Ibadan, Oyo State, Nigeria; and Alliance of Bioversity International and International Center for Tropical Agriculture (CIAT) through the PABRA.
Funding for the study was provided by the Africa Union (AU) through the Pan African University Life and Earth Sciences Institute (including Health and Agriculture), Ibadan, Oyo State, Nigeria and Alliance Bioversity International and International Center for Tropical Agriculture (CIAT) through PABRA. Crop Research Institute, Kumasi, Ghana for its technical support.
1.
2.
3.
4.
5.
6.
7.
8.
9.
10.
11.
12.
13.
14.
15.
16.
17.
18.
19.
20.
21.
22.
23.
24.
25.
26.
27.
28.
29.
30.
31.
32.
33.
Chabi M, Butare L, Yeboah S, Asibuo JY, Adetimirin VO. Analysis of common bean (Phaseolus vulgaris) advanced lines for environmental interaction and grain yield stability. Crop Breed Genet Genom. 2025;7(4):e250018. https://doi.org/10.20900/cbgg20250018.

Copyright © Hapres Co., Ltd. Privacy Policy | Terms and Conditions