Location: Home >> Detail
Crop Breed Genet Genom. 2026;8(1):e260005. https://doi.org/10.20900/cbgg20260005
 ,
Isabelle Morasse 2 ,
Baoluo Ma 1
,
Isabelle Morasse 2 ,
Baoluo Ma 1
1 Ottawa Research and Development Centre, Agriculture and Agri-Food Canada, 960 Carling Ave., Ottawa, ON K1A 0C6, Canada
2 Normandin Research Farm, Quebec Research and Development Centre, Agriculture and Agri-Food Canada, 1468 St-Cyrille, Normandin, QC G8M 4B2, Canada
* Correspondence: Weikai Yan
New crop cultivars are introduced into production every year, but yield gains in growers’ fields may not materialize due to non-genetic factors such as declining soil fertility or climate change. This study aimed to estimate the genetic gain from new oat cultivar introductions and yield trend in Quebec, using data from the provincial oat variety trials conducted between 2010 and 2024. The estimated genetic gain in both oat sub mega-environments (ME2a: south; ME2b: north) was approximately 39 kg/ha per year. However, this was insufficient to offset the estimated non-genetic losses of 124 kg/ha per year in ME2a and 108 kg/ha per year in ME2b, resulting in a net yield decline over time. The trend of non-genetic loss was accompanied by increased mean temperature at 0.05 °C per year and in total rainfall at 0.9 mm per year in May and June. The possibility of declining soil fertility as a driver of the non-genetic loss was discussed.
CRUST: crown rust score; DTH: days to heading; DTM: days to maturity; KG/HL: test weight in kg/hl; LOD: lodging score; KG/HA: yield in kg/ha; MAX: the mean yield of the highest yielding cultivar in a trial or year; ME, mega-environments; MEAN4: the mean yield of four common cultivars.
As global food demands rise and climate variability intensifies, the importance of improving crop productivity through genetic and non-genetic measures becomes increasingly urgent [1–3]. Oat production plays a vital role in the agricultural landscape of Quebec, serving both human consumption and livestock feed markets. Each year, new oat cultivars are introduced with the promise of higher yields, better quality, and improved resilience. However, yield performance in farmers’ fields reflects not only genetic potential but also the influence of environmental and agronomic factors.
Understanding the balance between genetic gain—improvements attributable to plant breeding—and non-genetic influences such as climate trends and soil fertility is essential for guiding future breeding strategies and agronomic practices. While many studies have reported steady yield improvements over time (e.g., [4–7], others have raised concerns about stagnating or even declining yields due to non-genetic constraints [1,2].
This study investigates the trends in oat yield in Quebec from 2010 to 2024, dissecting the contributions of genetic and non-genetic gains across two distinct mega-environments. By analyzing provincial variety trial data alongside weather variables, we aim to quantify the rate of genetic improvement and identify potential environmental or management-related factors that may be limiting yield progress.
This study analyzed 15 years of grain yield data from the Quebec Oat Registration and Recommendation trials conducted from 2010 to 2024, coordinated by RGCQ (Réseau des Grandes Cultures du Québec). Trials were conducted annually at nine locations across Quebec, representing three crop zones [8], along with an additional site in Ottawa, Ontario. Each trial included three replicates. The same set of genotypes was evaluated across all locations within a year, although the specific genotypes varied over time as new entries were added and poorly performing ones were dropped. While trial locations occasionally changed, the number of sites per zone remained consistent. Each year one or two trials may fail field inspection so data from these trials were not included. A total of 265 oat cultivars or breeding lines were evaluated during the period.
In addition to grain yield, data on days to maturity (DTM), plant height, lodging scores (scale of 0 to 9, with 9 being the worst), thousand kernel weight (TKW), and test weight (kg/hl) were determined in most trials. At the Ottawa site, days-to-heading (DTH) was recorded instead of DTM. Starting in 2016, groat content and percentages of protein, oil, and β-glucan (BGL) in the groat were determined at three locations, one in each crop zone.
Two methods were used to estimate genetic gain. The first was to use a balanced subset of 16 cultivars registered between 2001 and 2022 and evaluated during the final three years (2022–2024). Genetic gain was calculated by regressing the mean yield of each cultivar against its year of registration.
The second method was to utilize the yield of four cultivars, CDC Orrin, Synextra, Canmore, and Avatar, which were present in all 15 years. These cultivars were registered between 2001 and 2011 (Table 1) and are still actively used in oat production in Quebec. The mean yield of the four cultivars in each trial (location-year combination), referred to as MEAN4, was used to represent the non-genetic productivity of the trial. The mean value of MEAN4 across trials in a year was used to represent the non-genetic productivity of the year. A linear regression of the yearly MEAN4 against the year of evaluation provided the rate of non-genetic gain or loss.
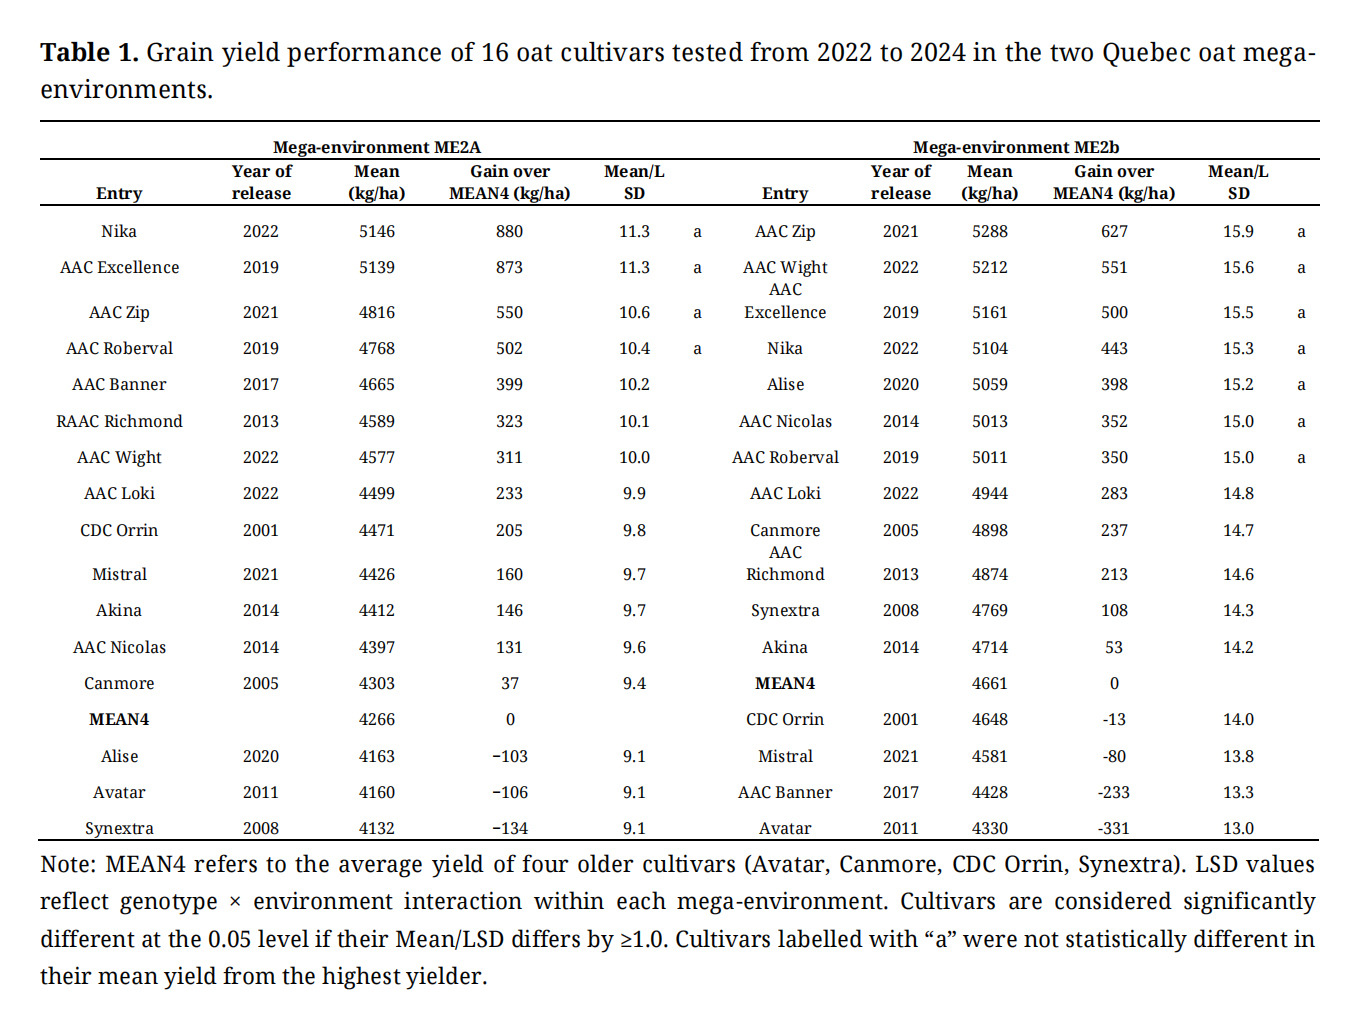 Table 1. Grain yield performance of 16 oat cultivars tested from 2022 to 2024 in the two Quebec oat mega-environments.
Due to variation in genotypes and locations across years, direct comparison between cultivars is difficult. Although BLUPs from mixed model estimation are commonly used in such cases [4,7,9]), this study employed an alternative approach. The yield of the highest-yielding genotype in a year (MAX) was used to represent the combined genetic and non-genetic productivity of the year, and the slope of regressing MAX against the year of evaluation was the combined rate of genetic and non-genetic gain (or loss if it is negative). The difference between the regression slopes of MAX and MEAN4 was interpreted as the genetic gain.
The oat growing regions in Canada were divided into three mega-environments, and Quebec belongs to mega-environment 2 (ME2) [10]. Within Quebec there are two sub mega-environments: ME2a (south), including all zone 1 locations, La Pocatière, and Ottawa, ON; and ME2b (north), comprising zones 2 and 3, excluding La Pocatière [8]. The analyses were conducted separately for each sub mega-environment. Monthly weather data (temperature, rainfall, humidity, and sun hours from May to August) for each Quebec location were obtained from Environment Canada via Copilot to help explain non-genetic yield trends.
Sixteen oat cultivars, registered from 2001 to 2022, were evaluated in the Quebec provincial trials from 2022 to 2024. Compared to the average yield of four older cultivars (MEAN4), newer cultivars demonstrated significantly higher yields in each mega-environment (Table 1). In ME2a, cultivars Nika and AAC Excellence outperformed MEAN4 by approximately 880 kg/ha across 11 trials (year-location combinations), and both showed superior stability, as indicated by their proximity to the “average trial axis” in the GGE biplot (Figure 1a). In ME2b, AAC Zip and AAC Wight exceeded MEAN4 by over 550 kg/ha across 17 trials, with AAC Wight also displaying high stability (Figure 1b).
Interestingly, AAC Wight, derived from a cross between AAC Nicolas and Akina, showed clear yield advantages over both parents. Similarly, AAC Zip yielded consistently higher than AAC Nicolas, which is one of its parents (Figure 1b; Table 1). These examples highlight the effectiveness of breeding effort. The GGE biplots in Figure 1 illustrate substantial genotype-by-environment interaction (GEI) within each mega-environment. Trials conducted at the same location across different years were widely scattered, highlighting the dominant influence of non-repeatable genotype-by-year interaction, which poses challenges to breeding progress.
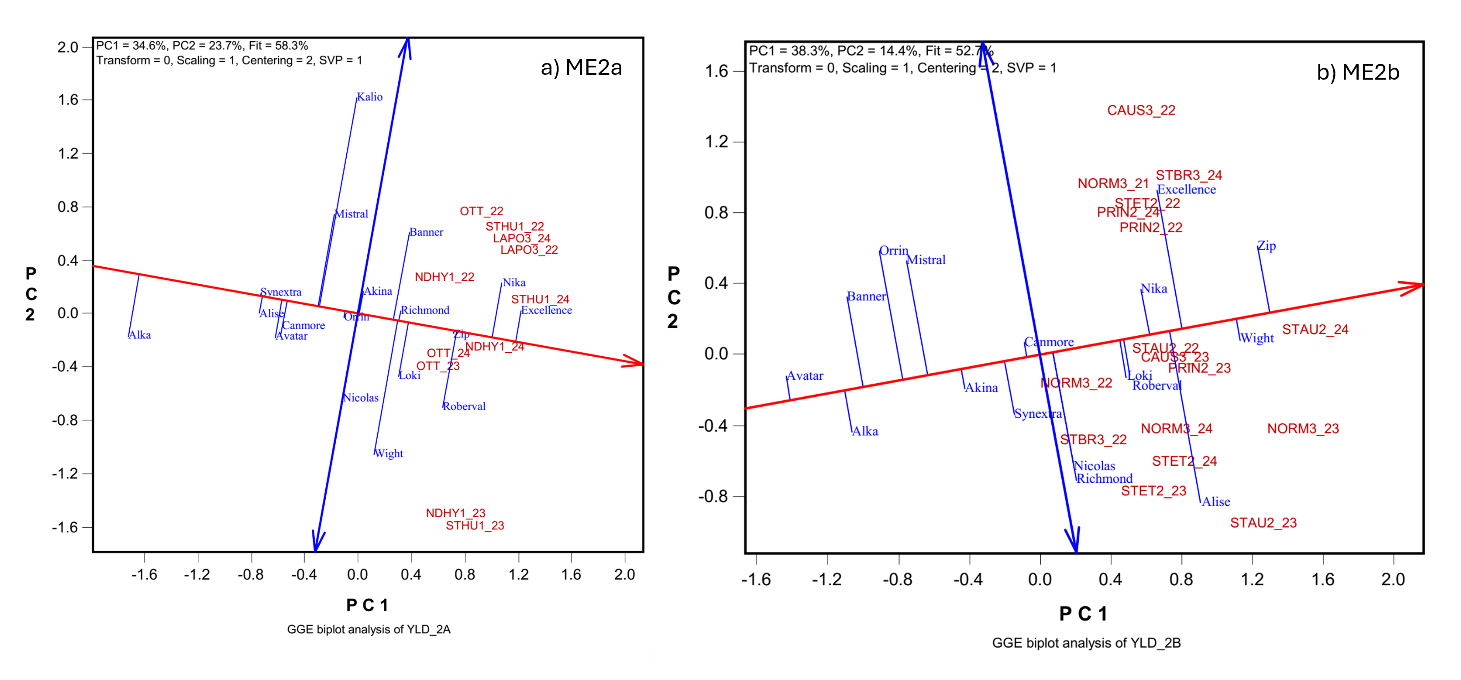 Figure 1. GGE biplots to show the mean yield and stability of oat cultivars based on the yield data from the 2022–2024 Quebec provincial oat trials in two mega-environments: (a) ME2a; (b) ME2b. The trials are presented as location by year combinations. The location abbreviations are: for ME2a: La Pocatière (LAPO3), Ottawa, ON (OTT), Saint-Hubert (STHU1), and Saint-Hyacinthe (NDHY1); For ME2b: Causapscal (CAUS3), Normandin (NORM3), Princeville (PriN2), Saint-Augustin (STAU2), and Saint-Étienne STET2). The year is indicated by its last two digits.
Based on linear regression of genotypic mean yield against the year of registration, the estimated genetic gains was 27.1 kg/ha per year for ME2a (P = 0026) and 21.9 kg/ha per year for ME2b (P = 0043). These estimates may be conservative due to genotype by mega-environment interactions. After excluding cultivars less adapted to a specific mega-environment, the genetic gain estimates increased to 34.0 kg/ha per year for ME2a and 25.3 kg/ha per year for ME2b (Figure 2).
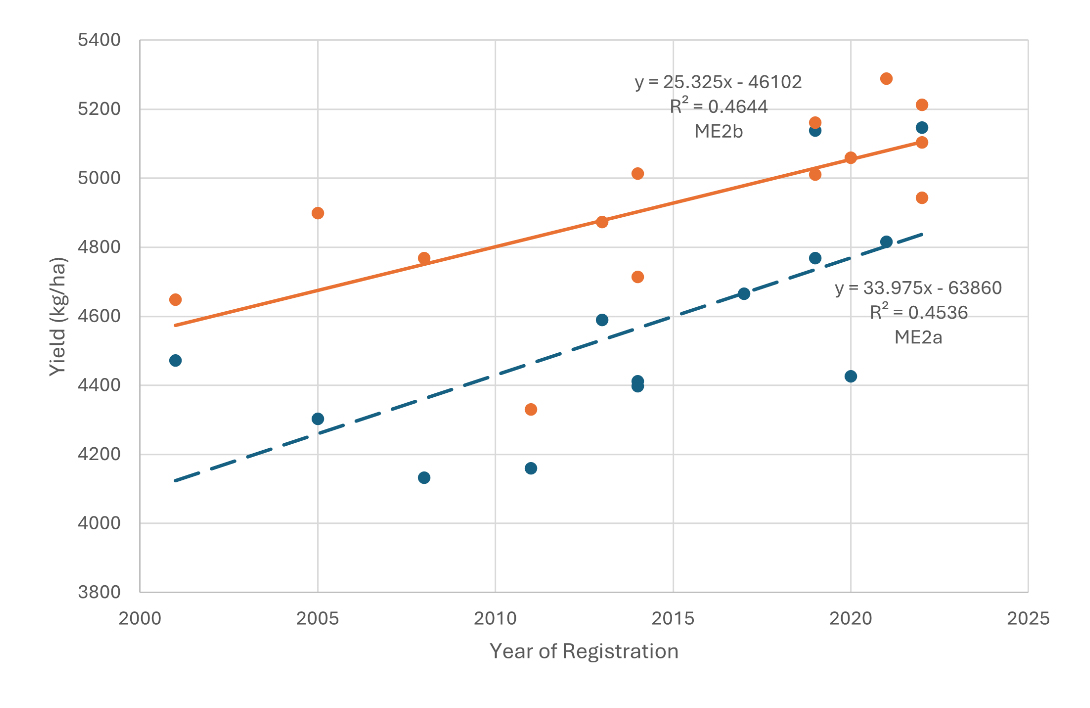 Figure 2. Linear regression of cultivar mean yield against their year of registration, showing estimated genetic gain in the two mega-environments: ME2a and ME2b.
Yearly MEAN4 and MAX values in ME2a were plotted against year of evaluation (Figure 3a), revealing the following patterns. First, both metrics fluctuated across years. Second, a clear downward trend was evident for both. Linear regression analysis showed that MEAN4 declined at a rate of 124 kg/ha per year (P = 0.1147), representing the non-genetic loss. MAX also declined, but at a slower rate of 85 kg/ha per year (P = 0.0062). Since MAX reflects the combined effects of genetic and non-genetic factors, the difference between the two slopes—39 kg/ha per year—was interpreted as the genetic gain.
Note that data from 2010 and 2011 were excluded from the regression due to low values that deviated sharply from the overall trend. These anomalies were results of extreme weather conditions (discussed further in the weather analysis section).
Similar patterns were observed in ME2b (Figure 3b). Both MEAN4 and MAX fluctuated year-to-year but showed a trend of decline over time. MEAN4 decreased at a rate of 108.2 kg/ha per year (P = 0.0147), indicating non-genetic loss, while MAX declined at 69.4 kg/ha per year (P = 0.1626), representing the trend of combined genetic and non-genetic effects. The difference, 38.9 kg/ha per year, represents the genetic gain, almost identical to that obtained for ME2a (Figure 3a).
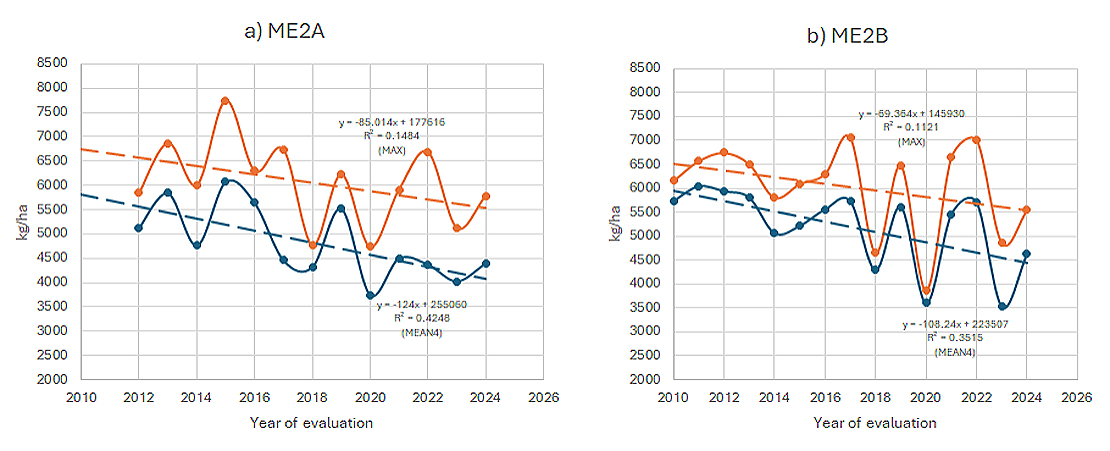 Figure 3. Yearly trends of MEAN4 and MAX from 2010 to 2024. Genetic gain was estimated as the difference in regression slopes. (a) ME2a; (b) ME2b.
The observed non-genetic loss was unexpected and warranted further investigation. To explore possible agronomic contributors, the relationship between grain yield and other measured traits was examined using a year-by-trait biplot (Figure 4), based on data from the four common cultivars across all locations.
Key findings include: (1) Test weight (kg/hl) showed the strongest positive correlation with yield (r = 0.761), highlighting the influence of growing conditions in the later growing stages on yield. (2) Plant height was also positively correlated with yield (r = 0.593), indicating the influence of growing conditions in the earlier developmental stage on yield. (3) Days to heading (DTH) showed a moderate positive correlation with yield (r = 0.473), while days to maturity (DTM) had a weaker, non-significant positive correlation (r = 0.359).
Regression analysis revealed no clear yearly trends for plant height or DTM. However, DTH showed a consistent decline of approximately 1.05 days per year. This reduction in the duration of vegetative growth may have contributed to the observed non-genetic loss. Unfortunately, DTH data were only available from the Ottawa site, limiting the ability to generalize it across the entire Quebec oat-growing region.
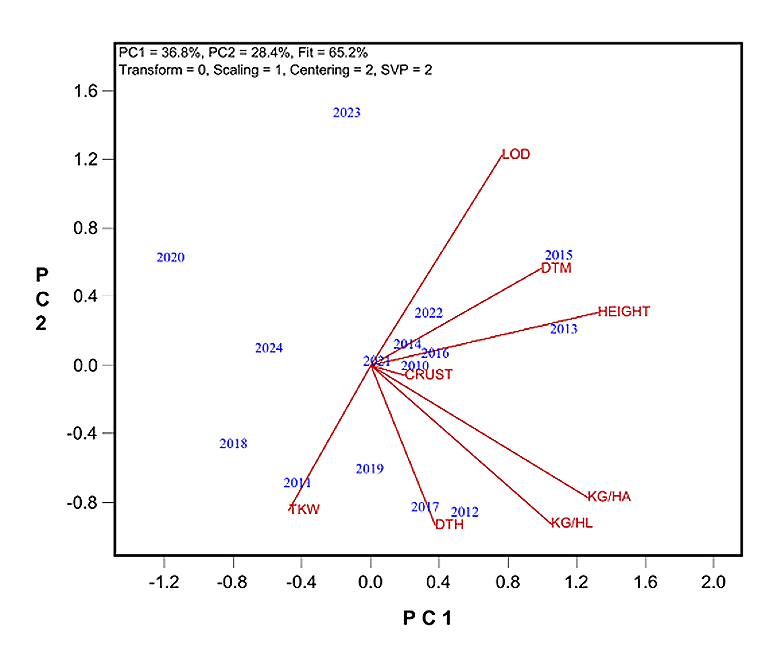 Figure 4. Year-by-trait biplot to show the correlations between grain yield and agronomic traits across years for the four common cultivars. CRUST: crown rust score; DTH: days to heading; DTM: days to maturity; LOD: lodging score; KG/HA: yield; KG/HL: test weight.
In Quebec, oats are typically planted in early May and harvested in late August, with heading occurring between late June and early July. Among the traits associated with yield, days to heading (DTH) are influenced by conditions in May and June, while test weight is more affected by conditions from flowering and onwards. To explore the role of climate in non-genetic yield loss, monthly weather data, including mean temperature, rainfall, humidity, and sun hours from May to August, were analyzed for each mega-environment.
Presented in Figure 5 is a biplot showing the relationships among weather variables and yield metrics (MEAN4 and MAX) across years and mega-environments. The following patterns emerged: (1) The two mega-environments were clearly separated along the first principal component (PC1). ME2a was characterized by having higher temperatures and more sun hours, while ME2b by greater rainfall and humidity throughout the oat growing season. (2) MEAN4 were placed on the same side of the PC1 as ME2b, suggesting higher non-genetic yields in ME2b than in ME2a. (3) May and June were highly correlated for each of the four weather factors, so were July and August. For example, May and June temperatures were near perfectly correlated, as were July and August humidity levels. These correlations justified treating May and June as the early stage and July and August the late stage in subsequent analyses.
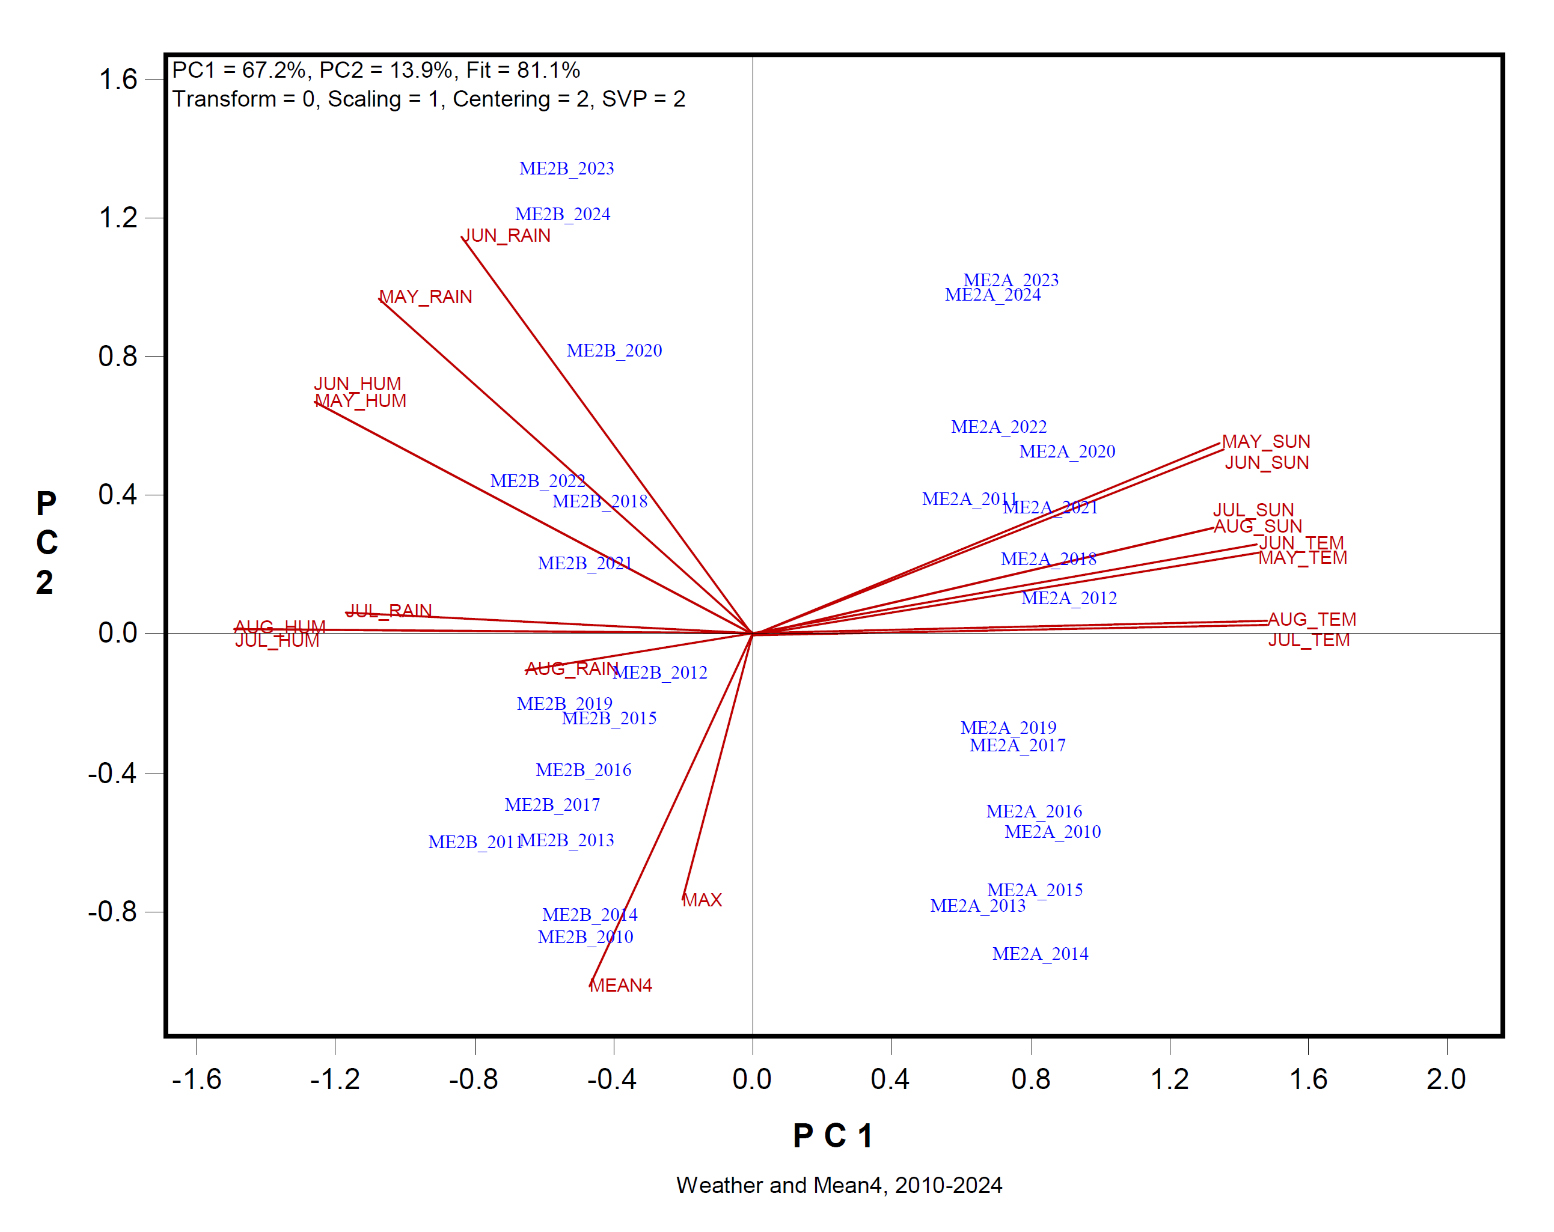 Figure 5. Biplot to show the relationships among weather factors and the non-genetic yield (MEAN4) across the mega-environments and years.
Figure 6a focuses on ME2a. No weather factor showed statistically significant positive correlation with yield. Most variables were negatively associated with MEAN4, with the strongest (though still non-significant) correlation being that between MEAN4 and May–June temperature (r = −0.335). The year-specific yield anomaly mentioned earlier was explainable by weather conditions: high rainfall in July and August in 2011 coincided with the unusually low MEAN4 and MAX values in that year. The biplot also showed elevated May–June temperatures in the most recent years (2022 to 2024), which corresponded with lower yields (Figure 5a).
Figure 6b presents the same analysis for ME2b. Here, stronger negative correlations were observed between MEAN4 and weather variables in May and June. Notably, MEAN4 was significantly and negatively correlated with sun hours during these months (r = −0.516). Similar magnitudes of negative associations were found between MEAN4 and temperature, rainfall, and humidity.
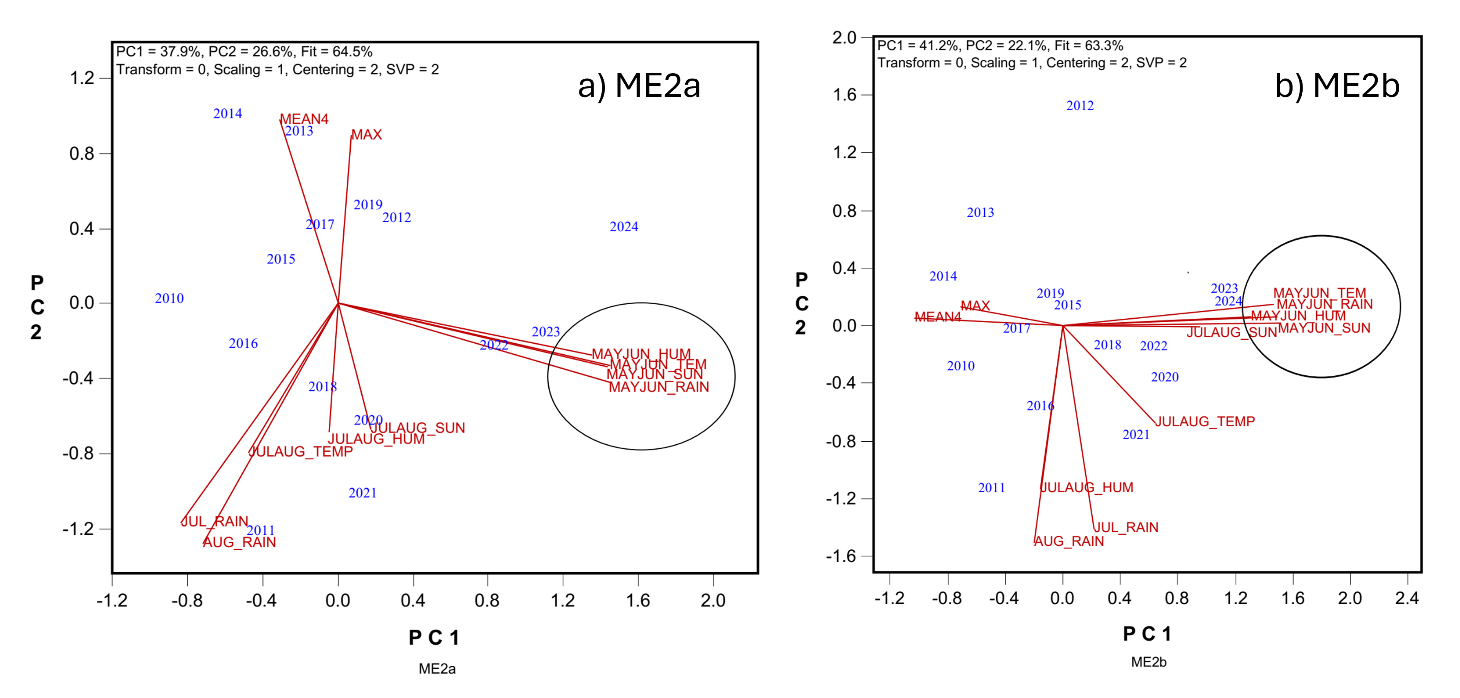 Figure 6. Biplots to show the correlations between the non-genetic yield (MEAN4) and weather factors in the two mega-environments. (a) ME2a; (b) ME2b.
The mean temperature, sun hour, rainfall, and humidity in May and June were closely corelated with one another across the years for both mega-environments, forming a May-June weather complex (Figure 6). Multiple regression showed that 27.6% and 37.6% of the yearly variations in MEAN4 were collectively accounted for by these factors for ME2a and ME2b, respectively (Figure 7). Among these four factors, temperature and rainfall are of more commonly studied and therefore more closely examined below. The mean temperature in May-June increased steadily, at the rate of 0.049 °C (P < 0.0001) and 0.047◦C per year (P = 0.0002) across 2010 to 2024 in ME2a and ME2b, respectively (Figure 8a). Simultaneously, the rainfall during May-June also increased steadily, at the rate of 0.86 mm (P = 0.0002) and 0.94 mm (P = 0.001) per year in ME2a and ME2b, respectively (Figure 8b). This finding suggests that increased temperature and rainfall in May-June were at least partially responsible for the observed trend of non-genetic loss. Excessive rainfall in May often delays planting, and increased temperature in May-June can haste vegetative development. Both would reduce the number of days to heading, leading to reduced yield potential. This is consistent with an earlier study, which showed that late-maturing cultivars tended to yield higher in ME2 [11].
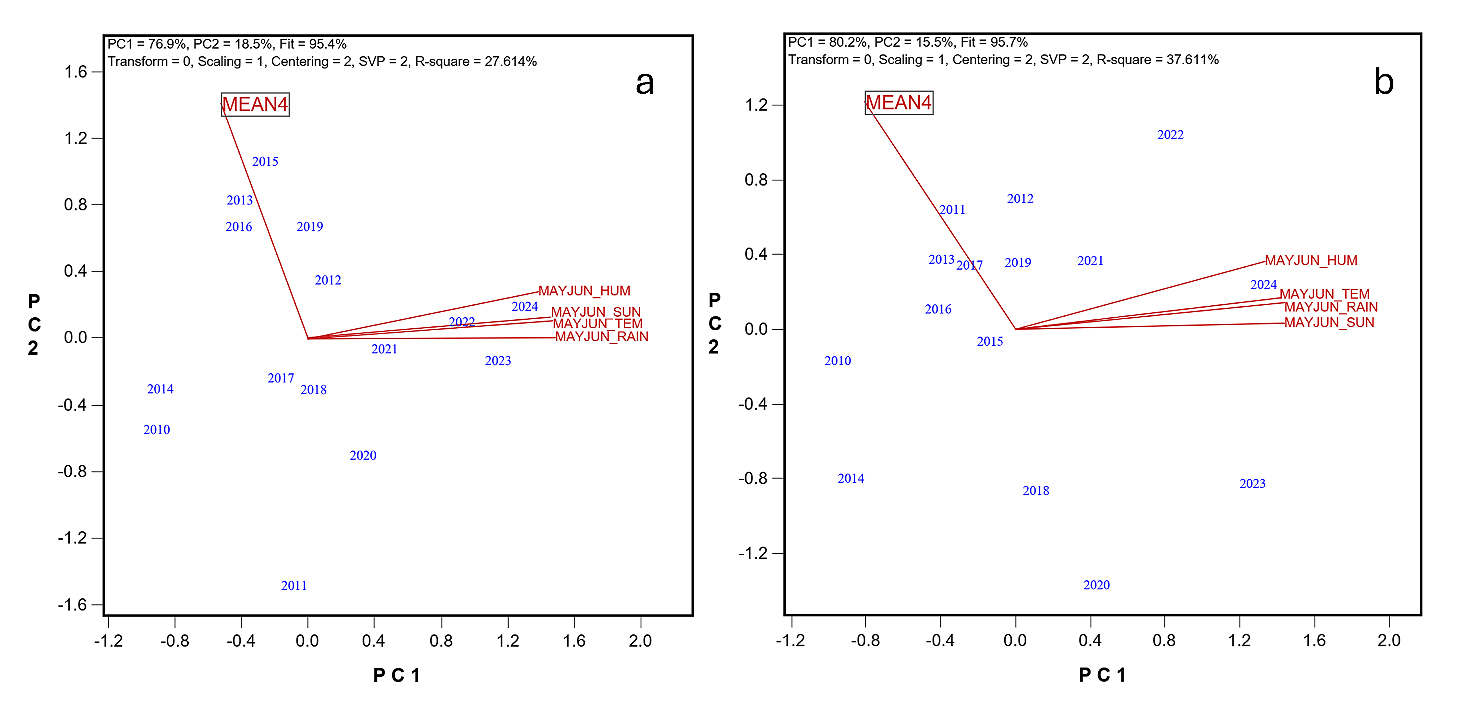 Figure 7. Biplots to show multiple regressions of the non-genetic yield (MEAN4) against May-June weather factors for the two mega-environments. (a) ME2a; (b) ME2b.
In contrast, no trends were found for the weather factors in July-August (Figure 8). However, a reduction in rainfall was clear in the last three years (2022–2024) in both mega-environments, which may also have contributed to the estimated long-term non-genetic loss (Figure 8b).
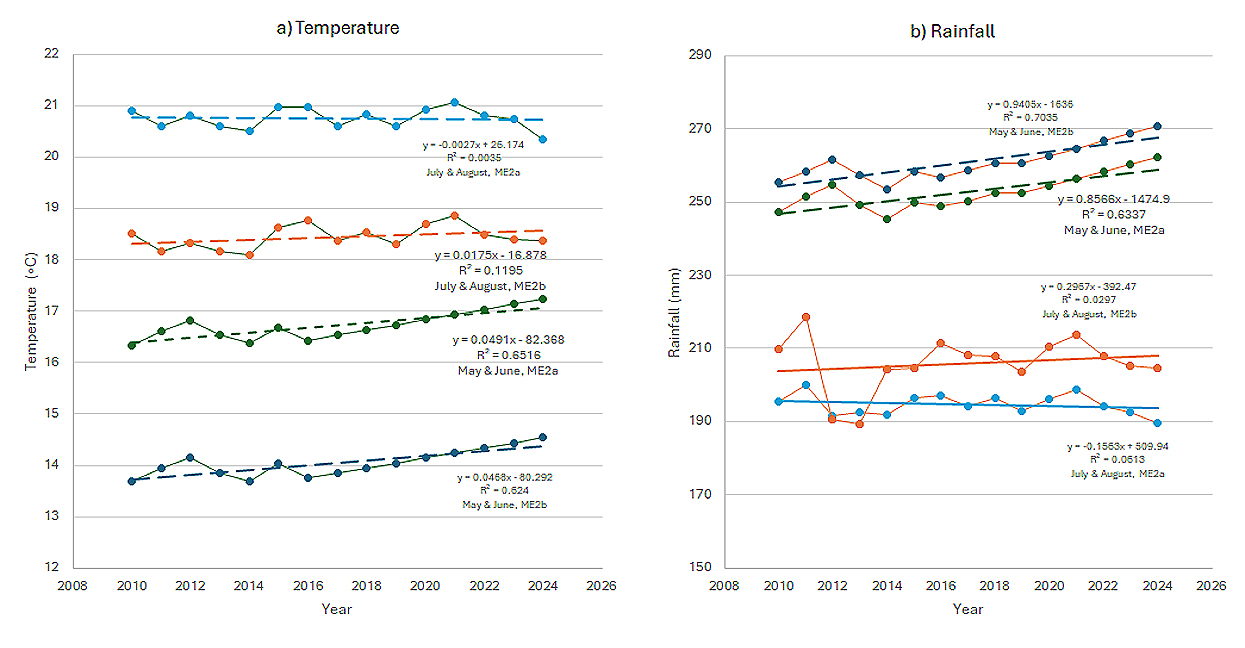 Figure 8. Mean temperature and total rainfall in the two mega-environments from 2010 to 2024. (a) May-June and July-August mean temperatures; (b) Total May-June rainfall and total July-August rainfall.
In contrast to the steady increases in mean temperature and rainfall in May and June, the temperature and rainfall in July and August showed greater fluctuation over years (Figure 8). The greater unpredictability of the July and August weather conditions could be a cause for the yearly fluctuation of the non-genetic yield that was not explained by the May-June weather complex. Figure 8b also showed that more rainfall occurred in May-June than in July-August in both mega-environments.
This study employed two complementary methods in estimating the genetic gain in oat yield in Quebec oat variety trials. The first method used a balanced subset of cultivars, those evaluated in each of the final three years (2022–2024). Genotypic means were calculated across locations and years, then regressed against the year of cultivar registration. This approach is similar to those used in dedicated genetic gain studies and provides valid estimates of genetic gain with regard to included cultivars (e.g., [12]). However, it has several limitations: (1) It is restricted to a short-term frame and cannot capture long-term non-genetic trends. (2) It excludes newest cultivars that have been evaluated in only one or two years, which may represent the most advanced breeding progress. (3) It may underestimate genetic gain when multiple mega-environments and mega-environment specific adaptation are involved, as was in the current case.
The second method was an indirect approach that leveraged long-term data. It used the average yield of four common cultivars (MEAN4) to estimate non-genetic trends and used the yield of the yearly highest-yielding cultivar (MAX) to represent the combined effect of genetic and non-genetic gain. The difference between the regression slopes of MAX and MEAN4 was interpreted as the genetic gain.
This method offers several advantages: (1) It includes all tested cultivars, even those evaluated for only one year, capturing the most recent breeding progress. (2) It avoids complex statistical assumptions regarding missing data. (3) It is simple to implement using basic tools like Microsoft Excel. However, it requires the presence of cultivars evaluated in all years across a number of years, a requirement rarely met in many regional variety trials. The Quebec oat performance trials provided a unique opportunity in this regard. To enable similar analyses elsewhere, it is advisable to include a stable set of control cultivars over time. The estimated genetic gain for oat in Quebec was 39 kg/ha per year, in comparable magnitudes as those for winter wheat, barley [4], and rice [5–7].
Note that in the balanced subset approach the cultivar mean yields were regressed against the year of registration, while in the long-term approach MAX and MEAN4 were regressed against the year of evaluation. The first approach explicitly takes genotype by year interaction into account, while the second approach avoided complication from genotype by year interactions as it was not bound to specific cultivars. Use of MAX may overlook some genotype by year interactions, leading to overestimated genetic gain if an exceptionally high MAX occurred in the most recent few years or underestimated genetic gain if it occurred in earlier years. However, this complication becomes of little concern when analyzed across a large number of years.
While mixed model approaches (as explained in [4]) are commonly used for handling unbalanced data, the connectivity between years is a key requirement [7]. For this reason, genotypes evaluated in fewer than three years are often excluded in the analyses ([4]). This can lead to omission of the most recent genetic progresses. For example, recently registered oat cultivars for Quebec, such as CFA2011, CFA2019, AAC Wallace, and AAC Marquis, showed strong yield advantages but could not be included in the balanced subset. In addition, it may be questioned whether a cultivar evaluated for three years many years ago can be meaningfully compared with one that was evaluated only in the most recent three years.
The Alarming Non-Genetic LossThe estimated non-genetic yield losses of 124 kg/ha per year in ME2a and 108 kg/ha per year in ME2b are striking, given that similar studies often report non-genetic gains over time (e.g., [4,9]). This unexpected trend prompted a deeper investigation into potential causes, including climate change and soil fertility. If it were due to climate change, then the only way to overcome it is to develop more adaptive and more resilient cultivars. If it were due to soil fertility, then agronomic measures may offer more effective, instant, and sustainable solutions.
As non-genetic yield reduced over time (Figure 3), the mean May-June temperature and total May-June rainfall increased steadily (Figure 8). This correspondence is a clear indication that elevated temperature in May and June led to reduced oat yield. Increased rainfall often leads to delayed planting while increased temperature can hasten vegetative development, and both would lead to reduced time to heading and thereby reduced yield potential. Baron et al. [13] reported 40% yield loss due to delayed planting. And, it is well documented that higher temperatures in the early developmental stages had negative influences on the yield of spring cereals [14–16]). It is interesting to note that in May to June, when the temperature is low, increased temperatures go hand-in-hand with increased rainfall, while in July to August, when temperature is high, temperature and rainfall were much less correlated (Figure 6). In contrast, unpredictable year to year fluctuations in temperature and rainfall were characteristics of this stage, leading to large yearly yield variations even disastrous yield loss. For example, severe drought and heat in late June and July in 2021 caused up to 50% oat yield loss in the Canadian prairie provinces (Figure 9b). Occurrences of short-time and abrupt changes in temperature and rainfall cannot be captured in the monthly or bimonthly means but could be the causes for some drastic fluctuations of the yearly yield.
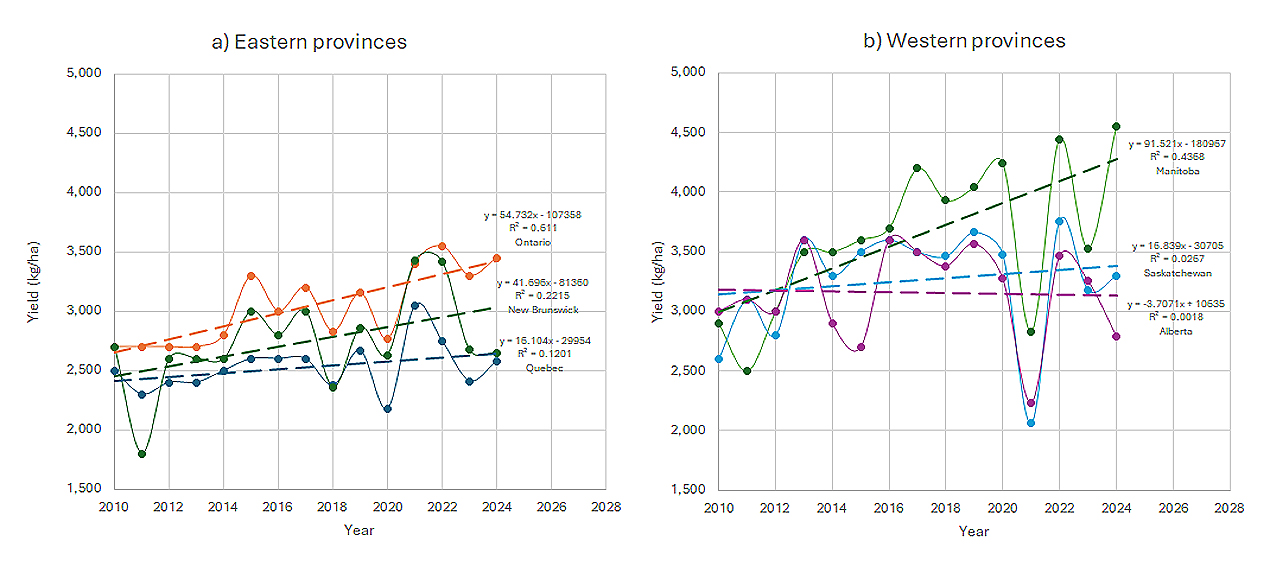 Figure 9. Yearly mean yield in Canada by province based on survey data from Statistics Canada. (a) Eastern provinces; (b) Western provinces.
In addition to steady trends in climatic factors, the change in soil fertility should be sought as potential causes of the observed non-genetic trend. Assuming a grain yield of 5000 kg/ha and considering a nitrogen content of >2% in the oat grain, each oat crop would remove at least 100 kg/ha of nitrogen from the soil. Additional 25 kg/ha of nitrogen would be removed if the straw is also harvested. In contrast, the nitrogen application rate for the Quebec oat trials recommended by RGCQ was only 40 to 70 kg/ha, depending on the soil type and organic matter content. This imbalance could lead to a progressive depletion of soil nitrogen, exacerbated by losses due to nitrification and leaching [17–19]. In contrast, a two-year (2013–2014) study involving Ottawa (a ME2a location) and Normandin (a ME2b location) compared four levels of nitrogen fertilizer rates (0, 50, 100, and 150 kg/ha) on the yield of nine oat cultivars. The mean yields at Ottawa were 5403 kg/ha and 4717 kg/ha at the nitrogen rates of 100 kg/ha and 50 kg/ha, respectively, and the respective yields at Normandin were 4579 kg/ha and 4287 kg/ha, demonstrating the importance of nitrogen fertilizer on oat yield [20,21]. A two-year (2015–2016) nitrogen fertilizer study with three cultivars and three levels of nitrogen rates (0, 60, and 90 kg/ha) at New Liskeard, northern Ontario, showed highest oat yield and β-glucan levels at 90 kg/ha [22], so this nitrogen rate has currently been used in the local oat variety trials. In the Canadian Prairies the recommended nitrogen rate was 80 kg/ha, with a target of 100 kg/ha total available nitrogen [23,24]. A Canada nationwide study conducted from 2018 to 2023 (Baoluo Ma et al., unpublished) suggested a mean MERN (most-economic-rate-of-nitrogen) of 127 kg/ha. In practice, trial conductors tend to apply less nitrogen fertilizer than optimal for maximum yield to prevent excessive lodging and for easy harvest. This may reduce the yield levels and hinder identifying lodging resistant, high yielding cultivars. At the Ottawa site, a low nitrogen rate of about 40 kg/ha in the oat trials was used for many years. This led to low yields, particularly in dry years, even though the oat field was under an oat-soybean-white clover rotation. In 2025, 80 kg/ha nitrogen was applied, which led to much higher yields and test weight, despite of a two-week delay in planting due to wet weather and a prolonged dry and hot weather in July and August. These results lead to the hypothesis that soil fertility could be a more important driver for the observed non-genetic loss in the Quebec oat trials. Unfortunately, soil nitrogen levels were not determined in the Quebec oat trials so this hypothesis cannot be directly tested. Since long-term trials is required for trend analysis, it is advisable to have important soil health indicators (such as soil organic matter content, available nitrogen, phosphorus, potassium, pH, etc.) determined each year at each test sites. This would allow more thorough understanding of the causes of any non-genetic gain or loss and to take measures accordingly.
To account for possible non-genetic losses, Piepho et al. introduced an aging factor in their mixed model to account for productivity reduction of older cultivars due to loss of disease resistance over time [4]. In the current study, the aging factor is of less a concern as MAX, which represents the yield levels of the newest cultivars in any given year, also showed a trend of reduction (Figure 3). In fact, crown rust susceptible oat cultivars tended to yield higher in Quebec where the disease does not occur in most years [11]. Early maturity is a desired trait for most growers and has been a key breeding objective in our breeding program. Given the observed climate change and that later maturing cultivars tended to yield higher, our breeding for Quebec is now focused on high yield while relaxing the requirement for early heading and maturation.
Trends Based On Small-Plot Yield Trials Versus Survey DataThe current study was based on data from small-plot variety trials. The role of such data in identifying superior cultivars is undeniable as most, if not all, crop cultivars currently in use are identified through this system. However, it is a question whether the estimated non-genetic gain or loss based on small-plot trials represent farmers’ fields.
Presented in Figure 9 are the yearly oat yield and linear trends in three eastern provinces (Figure 9a) and three western provinces (Figure 9b), based on survey data from Statistics Canada. The yield trend for the same period of time for Quebec was a net gain of 16 kg/ha per year (Figure 9a), contrasting to the net losses of 70 to 85 kg/ha per year shown in Figure 3 for MAX. Nevertheless, the net gain of 16 kg/ha is less than the estimated genetic gain of 39 kg/ha (Figure 3), suggesting the presence of non-genetic loss. Possible non-genetic losses from the survey data are also suggested for Alberta and Saskatchewan in western Canada (Figure 9b). In contrast, a net gain was seen for Manitoba (92 kg/ha per year), Ontario (55 kg/ha per year), and New Brunswick (42 kg/ha per year) (Figure 9). The trend shown in the survey data represents a mixture of genetic and non-genetic effects. Since the western provinces are accessible to the same set of oat cultivars, the differences in the yearly gain (or loss) among provinces should be primarily non-genetic. This is also true for the differences among the eastern provinces.
The differences in non-genetic factors between small-plot trials and farmers’ fields are mainly due to soil fertility, agronomic management, and/or systematic errors (e.g., conversion from g/plot to kg/ha, yield loss during harvest) as the weather conditions were the same for any given year and region. Small-plot trials typically report much higher yield than farmers. For Quebec, for instance, the yield levels in the survey data ranged from 2020 to 3050 kg/ha (Figure 9a), while the small-plot yield levels ranged from 3740 to 7800 kg/ha (Figure 3). Further studies are needed to understand the discrepancies in the net gain or loss from the small-plot trials versus the survey data; such knowledge of which can contribute to the development of measures to overcome the non-genetic losses and optimization of crop yield trials. Survey data submit to sampling and non-sampling errors; this should be considered as well when comparing with results from small plot variety trials.
This study revealed a troubling trend: despite consistent genetic gains of approximately 39 kg/ha per year, non-genetic losses of over 100 kg/ha per year have resulted in a net yield decline in Quebec oat variety trials from 2010 to 2024. Accompanied this trend were steady increases in mean temperature at the rate of 0.05 °C per year and in total rainfall at the rate of 0.9 mm per year during May and June. About 27 to 37% of the non-genetic yield could be explained by the increased temperature and rainfall in May and June. The possibility of reduced soil fertility as a cause of the non-genetic loss should be investigated.
The dataset of the study belongs to RGCQ and is available from the authors upon reasonable request.
Conceptualization, WY; methodology, WY; software, WY; validation, WY and BM; formal analysis, WY; investigation, WY; data curation, WY, BM; writing—original draft preparation, WY; writing—review and editing, WY, BM, IM; visualization, WY; funding acquisition, WY. All authors have read and agreed to the published version of the manuscript.
The authors declare that they have no conflicts of interest.
This research was part of the oat breeding project funded by AAFC and CFCRA, project number J-003399.
We thank RGCQ for coordinating the Quebec provincial oat trials, sponsors of the oat cultivars for providing the cultivars and funding the trials, and colleagues for conducting the trials at various locations. We thank Environment Canada for the Quebec weather data. We thank Sima Vyas for providing the historical oat yield data from Statistics Canada. We also thank Peter Johnson, Arthur McElroy, Elroy Cober, Quentin Martin, Melinda Drummond, Jean Goulet, Joanne Follings, and Meghan Moran for reviewing an earlier draft of this article and insightful discussions. The author is an employee of Agriculture and Agri-Food Canada. This work was prepared as part of their official duties. As such, the copyright for this article is owned by the Crown (His Majesty the King in Right of Canada), as represented by the Minister of Agriculture and Agri-Food Canada. Notwithstanding the journal's general copyright notice, this article is distributed under the terms of the Creative Commons Attribution license.
1.
2.
3.
4.
5.
6.
7.
8.
9.
10.
11.
12.
13.
14.
15.
16.
17.
18.
19.
20.
21.
22.
23.
24.
Yan W, Morasse I, Ma B. Genetic Gain and Non-Genetic Loss of Oat Yield in Quebec Oat Variety Trials. Crop Breed Genet Genom. 2026;8(1):e260005. https://doi.org/10.20900/cbgg20260005.

Copyright © Hapres Co., Ltd. Privacy Policy | Terms and Conditions