Location: Home >> Detail
Crop Breed Genet Genom. 2026;8(1);e260009. https://doi.org/10.20900/cbgg20260009
 ,
Finn Borum 2 ,
Mogens Støvring Hovmøller 1 ,
Steven Kildea 3 ,
Lise Nistrup Jørgensen 1,* ,
Winnie Füchtbauer 3
,
Finn Borum 2 ,
Mogens Støvring Hovmøller 1 ,
Steven Kildea 3 ,
Lise Nistrup Jørgensen 1,* ,
Winnie Füchtbauer 3
1 Department of Agroecology, Aarhus University, 4200 Slagelse, Denmark
2 Sejet Plant Breeding, Nørremarksvej 67, 8700 Horsens, Denmark
3 Teagasc, Crops Research Centre, Oak Park, R93 XE12 Carlow, Ireland
* Correspondence: Niels Frederik Vestergård, Lise Nistrup Jørgensen
Septoria tritici blotch (STB), caused by Zymoseptoria tritici, remains a significant challenge for winter wheat production in Europe. The gradual breakdown of single, major-gene resistances, coupled with reduced fungicide efficacy and policy frameworks aimed at reducing the environmental impact of pesticides, points to the importance of breeding strategies that emphasize durable, polygenic disease resistance. We conducted genome-wide association studies (GWAS) across five elite winter wheat populations (n = 444), representing both bi-parental and nested association mapping designs. Populations were evaluated over three years (2022–2024) at three locations in Northern Europe. Using multi-locus models, we identified 13 significant marker–trait associations on chromosomes 1A, 1D, 2A, 2B, 2D, 3D, 4D, 7A, and 7D. Several loci were consistent across environments, while others were environment specific, and co-localized with previously reported STB resistance regions and QTL hotspots. Validation in an independent panel of 6589 breeding lines (2020–2025) confirmed consistent marker effects, with additive reductions in STB severity of up to 0.18 per favorable allele. These results provide validated markers for marker-assisted selection and support resistance stacking as a practical route to durable control of Septoria tritici blotch in elite winter wheat.
AVG, average of assessments for the linked environment; BLUP, Best Linear Unbiased Predictor
Septoria tritici blotch (STB), caused by Zymoseptoria tritici, is among the most economically damaging foliar diseases of wheat (Triticum aestivum) in Europe. Yield losses can exceed 50% in epidemic years [1,2], and annual fungicide spending is estimated at more than 1 billion euros across the EU [3]. The pathogen’s rapid adaptive capacity has repeatedly undermined both genetic and chemical control, with major resistance genes often being rendered ineffective within a few years of deployment, and widespread fungicide resistance has emerged in European populations [4–7].
As pesticide regulations become increasingly restrictive, host genetic resistance will inevitably become the cornerstone of integrated disease management. However, achieving durable resistance requires an improved understanding of how Z. tritici populations respond to the deployment of specific resistance sources. The rapid breakdown of STB resistance in the variety Cougar, initially released with strong resistance to both STB and yellow rust (Puccinia striiformis), illustrates the challenge of relying on single major resistance genes [8,9]. Widely used as a crossing parent across Northern and Western Europe, Cougar’s resistance, largely attributed to a major-effect STB locus, rapidly eroded as Z. tritici populations adapted. Similar breakdowns in STB resistance have been reported in other varieties, such as Gene and Cellule [10,11], as well as the major genes Stb6 and Stb15 [12–14] highlighting the vulnerability of single-gene resistance strategies This pattern indicates that it is necessary to diversify resistance sources and deploy combinations of major genes and quantitative trait loci (QTLs) to extend the durability of STB resistance.
To date, at least 23 major genes conferring qualitative resistance to STB, referred to as stb resistance genes, have been identified in wheat, along with more than 120 STB resistance-associated QTL reported from diverse mapping populations [15–19]. While some loci provide relatively broad-spectrum resistance, many show population- or environment-specific effects. Environment-specificity may reflect differences in pathogen population structure, climatic conditions influencing epidemic development, or interactions between the two. The polygenic and environment-dependent nature of STB resistance underlines the importance of identifying loci that are both stable across environments and relevant to elite germplasm. Quantitative resistance, governed by multiple minor-effect loci, is generally regarded as more durable but harder to detect, especially in elite material where genetic variation is narrower and genotype-by-environment interactions are stronger [15,20].
Genome-wide association studies (GWAS) have become a powerful tool for mapping QTLs, but most studies to date have focused on landraces or unadapted germplasm, limiting direct breeding application due to linkage drag [21–23]. By performing GWAS directly in elite breeding germplasm, it is feasible to identify markers that are not only statistically significant but also readily applicable in marker-assisted and genomic selection. In this study, we performed GWAS across five elite winter wheat populations (n = 444) representing both bi-parental and nested association mapping designs. These populations were selectively chosen from readily available populations, based on parental lines with high STB resistance observed under European conditions. We assessed STB levels across three years and three locations in northern Europe, representing different disease pressures. Our objectives were therefore to specifically (i) identify marker–trait associations for STB resistance across multiple environments using elite breeding germplasm, (ii) validate consistent associations in an independent multi-year panel, and (iii) quantify the additive effects of stacking identified QTL to provide marker-assisted breeding strategies for durable resistance.
Five elite winter wheat populations were used for the discovery GWAS, representing both bi-parental and nested association mapping (NAM) designs (Table 1). The recurrent and divergent parent varieties and their marker alleles are listed in Table S1. The populations were derived from crosses between widely grown cultivars with moderate to high levels of STB resistance (KWS Extase, SU Selke, Informer, Kvium, and Pondus) and commercially relevant varieties selected for their moderate to high STB susceptibility, ensuring both practical relevance and sufficient phenotypic variation in the offspring. Population sizes ranged from 44 to 177 lines. Following quality control, including the removal of double dwarfs (lines with two different dwarfing alleles), tall variants lacking dwarfing alleles, and lines highly susceptible to yellow rust, a total of 444 doubled-haploid (DH) lines were retained for the final discovery analysis.
An independent validation panel, grown between 2020 and 2025 and consisting of 6588 elite winter wheat breeding lines developed for Northern European conditions, was used to validate the marker effects identified in the discovery population. The panel represents advanced breeding material from multiple pedigrees within the same breeding programs and thus reflects the genetic structure of current elite pipelines rather than maximizing historical diversity. Although the validation lines are closely related to those in the discovery populations, their number and pedigree breadth are typical of modern breeding programs and allow marker effects to be assessed across a representative sample of elite germplasm rather than a narrowly defined subset.
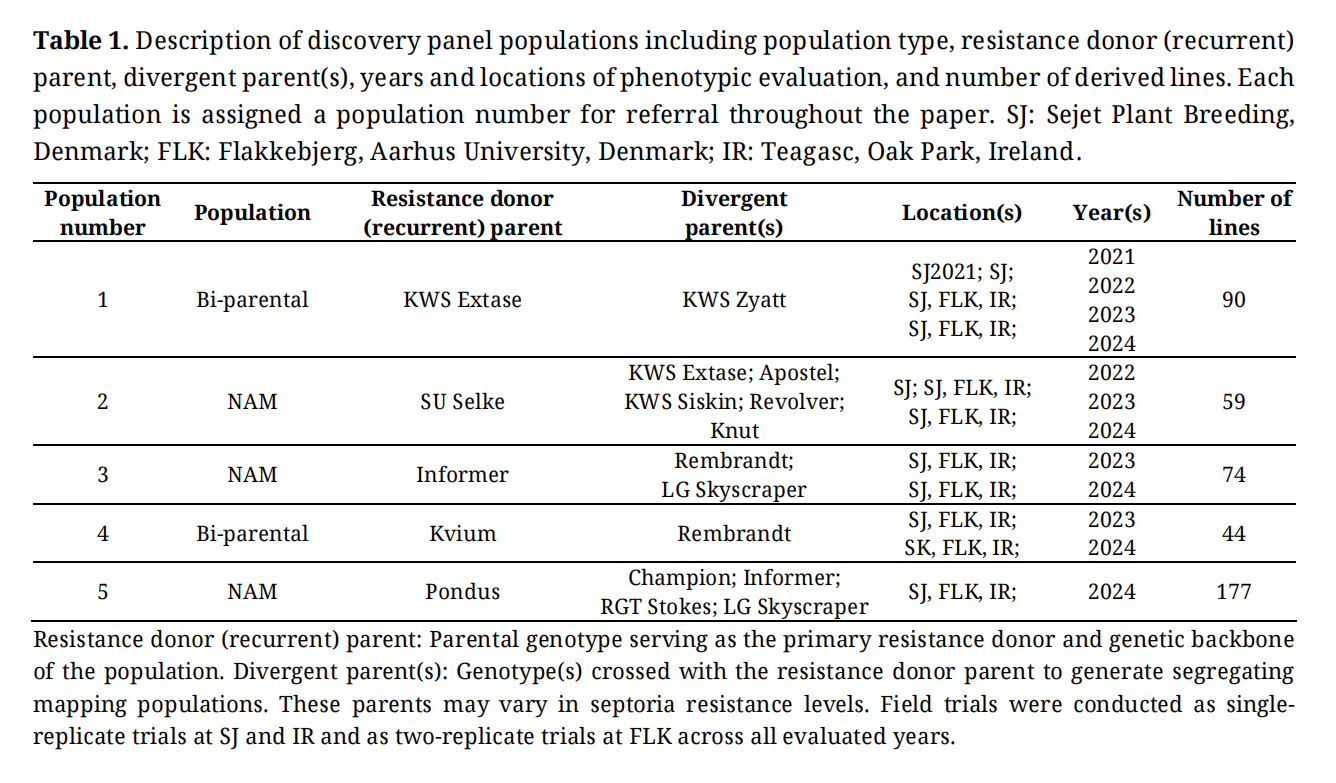 Table 1. Description of discovery panel populations including population type, resistance donor (recurrent) parent, divergent parent(s), years and locations of phenotypic evaluation, and number of derived lines. Each population is assigned a population number for referral throughout the paper. SJ: Sejet Plant Breeding, Denmark; FLK: Flakkebjerg, Aarhus University, Denmark; IR: Teagasc, Oak Park, Ireland.
Trials were conducted from 2022 to 2024 across two Danish locations: Sejet Plant Breeding, Denmark, and Aarhus University, Flakkebjerg, Denmark, and one Irish location: Teagasc Oakpark, Ireland (Table 1). These trials are referred to as SJ, FLK, and IR, respectively. In 2022, the trials were limited to SJ, and from 2023 onwards, trials were conducted at all three locations. Trials were arranged as randomized complete block designs, with one replicate per line at Sejet and Ireland and two replicates at Flakkebjerg. Fields were arranged into 5–6 farm tracks, each with four blocks. Each block had 20 plots, with each plot consisting of six rows, 25 cm spacing, and 90 cm in length. Each plot contained two lines sown in three adjacent rows. Populations were grouped in the layout. Each block contained two control plots: plot number two included one susceptible variety (Rembrandt (2022, 2023), Guiness (2024)) and two resistant checks (Heerup and Informer), while plot number 18 included an additional two resistant checks (Champion and Kvium) along with a spring barley check to assess any potential winter damage. Two of the resistant check varieties, Informer and Kvium, were also included as regular entries within the experimental set, meaning they appeared both as replicated resistant checks and as single evaluation plots among the tested lines. Their repeated inclusion across blocks allowed assessment of within-trial consistency and benchmarking of disease pressure, while their single-plot data were used for direct comparison with other genotypes in Figure 1. Additionally, the variety LG Skyscraper was included (along with all parental lines each year), as another susceptible control variety.
At all sites, STB developed from natural infection. At the Danish sites, overhead sprinkler irrigation was applied during dry periods to promote STB development. Irrigation was typically applied 2–3 times at two-three continues days, per season when rainfall was insufficient, delivering approximately 15–30 mm per event. The primary objective was to extend leaf wetness duration and enhance splash dispersal of Z. tritici conidia, thereby ensuring uniform disease pressure across genotypes. As both the Danish and Irish Z. tritici populations are dominated by Quinone outside Inhibitor (QoI) resistant strains, the fungicide pyraclostrobin (Comet Pro®) was applied 2–3 times annually to suppress foliar rust pathogens, such as yellow (Puccinia striiformis) rust and brown rust (Puccinia triticina), with minimal impact on the development of STB.
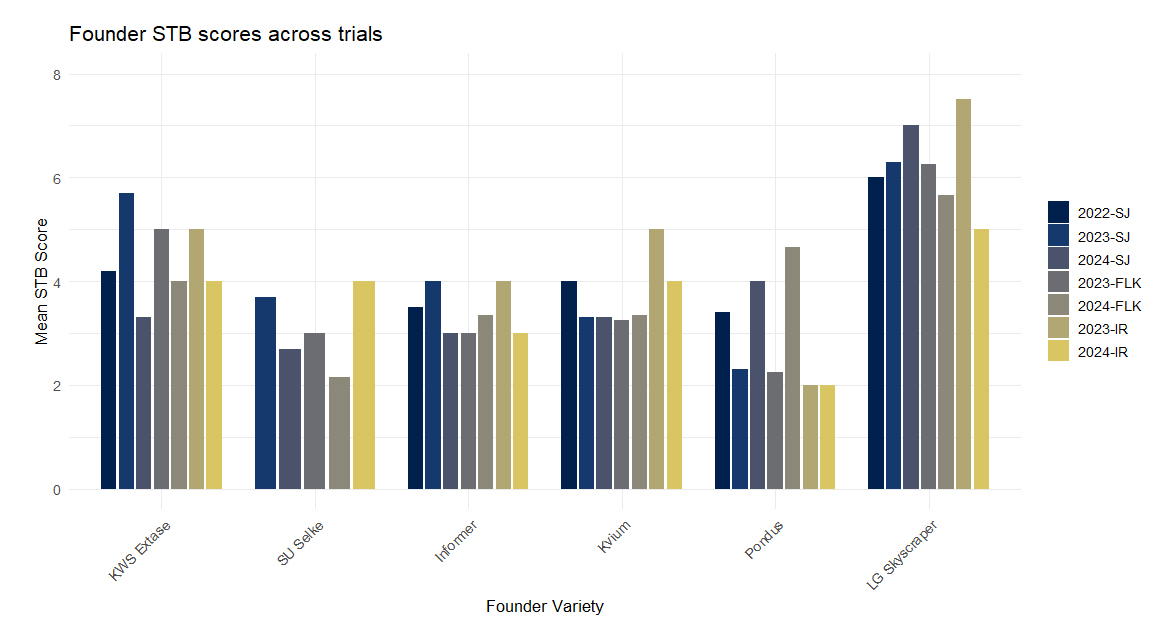 Figure 1. Mean founder STB scores across trials. Each bar represents mean STB values at a single trial site and year, separated by founder variety.
Disease severity was visually assessed two to three times per season at peak epidemic development (GS 65–75) using a 1–9 ordinal scale aligned with the UPOV scoring system for distinctness, uniformity, and stability (DUS) and value-for-cultivation-and-use (VCU) testing in wheat [24]. The scale translates estimated percentage of necrotic leaf area with visible pycnidia into discrete resistance classes, where 1 represents minimal symptom expression and 9 represents extensive necrosis and sporulation. The scoring framework was adapted from standardized Danish cereal disease assessment guidelines [25], ensuring consistency with national variety testing protocols. A detailed correspondence between estimated percentage necrotic leaf area and UPOV score classes is provided in Table S2. Assessments focused on the upper canopy (flag leaf and F-1 leaf), integrating lesion coverage and sporulation intensity into a single severity score. All genotypes within a trial were scored on the same day at each assessment time point to ensure comparable disease pressure across lines. The same experienced evaluator conducted all scorings across years and locations to minimize inter-observer variability. Although repeated assessments were available, we used the mean score per line per environment because assessments were conducted at comparable epidemic stages. Mean values were calculated per line and environment (average of two to three assessments), and across-environment resistance was estimated using the best linear unbiased predictors (BLUPs), accounting for genotype-by-environment interaction. Our objective was to estimate peak-season severity rather than disease progression dynamics. Averaging reduced measurement noise and provided a stable phenotype for subsequent mixed-model and GWAS analyses. The linear mixed model fitted was
where yijkl is the observed STB score, μ is the overall mean, Li is the random effect of the i-th line, Ej is the fixed effect of the j-th environment (location-year combination), (L × E)ij is the random line-by-environment interaction, Rk(j) is the random effect of replication nested within environment, and εijkl is the residual error.
Models were fitted in R using the lme4 package (version 1.1–35.5), and BLUPs for line effects (Li) were extracted with the emmeans package (version 1.11.1). These BLUPs were subsequently used as input for genome-wide association studies.
Phenotypic variance was partitioned using a linear mixed-effects model including genotype (Line), environment (year × location), genotype × environment interaction, and replicate nested within environment as random effects. The estimated variance components were: genetic variance = 1.13 (45.7% of total variance), environment variance = 0.16 (6.3%), genotype × environment variance = 0.44 (17.9%), replicate variance = 0.04 (1.7%), and residual variance = 0.71 (28.5%). Broad-sense heritability on an entry-mean basis across eight site-years was 0.89, while Cullis heritability based on BLUP prediction error variance was 0.85. All analyses were performed in R (version 4.4.1) using the packages tidyverse (version 2.0.0), corrplot (version 0.95), and ggplot2 (version 3.5.2).
Genotyping and Quality ControlSeeds of each breeding line from both the discovery and validation panel were shipped to TraitGenetics GmbH, and subsequent DNA extraction and genotyping were performed on their 7K Illumina Infinium iSelect SNP array, which comprises a subset of 6707 markers selected from the company’s 25K SNP chip designed for European elite wheat germplasm. Raw genotype calls were filtered prior to analysis: markers with a call rate < 85%, minor allele frequency < 5%, or > 15% missing data were removed. Because the populations consisted of DH lines, markers with heterozygous calls were excluded. After filtering, approximately 5000-6000 high-quality markers were retained per population. Missing calls were imputed using the expectation–maximization algorithm implemented in TASSEL 5. For combined analyses across populations, only markers common to all five datasets were retained, resulting in a final set of 4844 SNPs for GWAS.
Population Structure and Genetic RelatednessTo quantify the genetic relationship between the discovery and validation panels, a principal component analysis (PCA) was conducted using shared genome-wide SNP data. After applying quality control filters (call rate ≥ 0.90, minor allele frequency ≥ 0.05), 6,065 high-quality markers were retained. Missing genotypes were imputed with the major allele, and SNPs were encoded in a binary format (major allele = 0, minor allele = 1). The genotype matrix was mean-centered and scaled prior to PCA using the prcomp function in R.
PC1 and PC2 were extracted for visualization in ggplot2. A small set of lines with extreme PC1 values (n = 26; PC1 > 100) were excluded from plots to improve clarity, but all lines were retained in downstream analyses. Pedigree inspection was used to identify shared parents between panels and confirm expected overlap arising from use of common European founder material.
Genome-Wide Association Study AnalysisGWAS was conducted in R (v4.4.1) using the GAPIT 3 package. Four models were applied: Fixed and Random Model Circulating Probability Unification (FarmCPU) and Bayesian-information and Linkage-disequilibrium Iteratively Nested Keyway (BLINK) as the primary multi-locus discovery models, and MLM (Mixed Linear Model) and GLM (General Linear Model) as single-locus models to validate associations. Analyses were performed (i) within each population, (ii) within individual environments (year × location x assessment number), and (iii) using across-environment BLUPs. To account for population structure, principal components (PCs) derived from genotype-based principal component analysis (PCA) were included as fixed covariates. The the optimal number of PCs was determined within GAPIT using Bayesian Information Criterion (BIC) model selection to balance model fit and overparameterization. Relatedness among lines was modeled using a kinship matrix estimated using the VanRaden method implemented in Gapit. The MLM incorporated both the kinship matrix (random effect) and PCs (fixed effects) to control for confounding due to relatedness and structure. FarmCPU and BLINK iteratively incorporate associated markers as covariates while simultaneously modeling kinship, thereby reducing false positives caused by population structure and improving power relative to single-locus models. Multiple testing correction was performed using both a Bonferroni threshold and a false discovery rate (FDR) < 0.05.
Marker Validation in the Independent Breeding PanelAll significant marker–trait associations identified in the discovery panel were evaluated in a large independently derived breeding validation panel consisting of elite winter wheat breeding lines tested from 2020 to 2025. Each year, approximately 1000 newly developed DH or F5–F7 lines were assessed under natural STB infection at Sejet (SJ) using the same visual scoring scale as in the discovery trials. The composition of the validation panel varied annually with limited overlap among years; however, some shared parentage with the discovery panel was expected due to the use of related founder material across European breeding programs. Although approximately 50% of lines shared at least one parent with the discovery populations, the large population size (>6000 lines) and multiple breeding cycles ensured that marker effects were evaluated across diverse elite genetic backgrounds. This design reflects practical breeding reality while maintaining statistical independence at the line level.
For each SNP, the favorable allele was defined as the one associated with reduced STB severity in the discovery analysis.
For validation, STB severity was analyzed per year using linear models comparing mean scores of lines carrying the favorable allele versus the alternative allele. Additionally, a linear mixed model was fitted across years:
where Marker was treated as a fixed effect (favorable vs alternative allele), Year as a fixed effect to account for environmental differences, and ε as residual error. Effect sizes (Δ = Alt − Fav) were calculated per year and across years. A marker was considered validated if the favorable allele reduced STB severity consistently in direction across all years. We deliberately adopted a stringent validation criterion requiring consistent direction of effect across years to prioritize markers with robust, broadly applicable breeding value rather than environment-specific utility.
Allele Frequencies and Stacking PotentialTo evaluate the breeding relevance of the validated loci, the number of favorable alleles carried by each line in the validation panel was calculated. Because the panel represented multiple breeding cycles and diverse parental combinations, favorable allele counts ranged from 0 to 11 per line. Mean STB severity was compared across stacking classes, and a linear regression model was fitted with mean STB score as the response and favorable allele count as the predictor to quantify additive genetic effects.
Favorable and alternative allele distributions for both the discovery and validation panels, together with per-marker contrasts, are presented in Figure S1.
Phenotypic modeling of STB severity in relation to plant height, heading date, and marker stacking
To quantify the relative contributions of phenology, plant height, and genetic stacking to variation in STB severity, a linear modeling approach was applied to the multi-year dataset of the validation panel. Observations with complete measurements for STB, heading date, plant height, and the number of favorable alleles (identified from the GWAS results) were included.
The heading date was recorded as the number of days from the 1st of January to GS 55 (half of the spikes fully emerged). The distribution of heading dates across years in the discovery panel is shown in Figure S6. Plant height (straw length) was measured as the distance from the soil surface to just below the spike at physiological maturity, consistent with standard agronomic measurement protocols in variety testing and is hereafter referred to as ‘plant height’ for simplicity. While measurement to flag leaf insertion may more directly relate to canopy structure during epidemic development, straw length at maturity provides a standardized and reproducible metric routinely recorded in breeding programs. Measurements were taken on three representative plants per plot and averaged per genotype.
STB severity scores (1–9 scale) were modeled as a function of year, heading date, plant height, and the number of favorable alleles:
In this analysis, Year was treated as a fixed factor to account for environmental differences across different field seasons. Model residuals were inspected visually for normality, leverage, and Cook’s distance, and formal tests (Breusch–Pagan test, variance inflation factors) were used to verify heteroskedasticity and multicollinearity. Because mild heteroskedasticity persisted, cluster-robust standard errors per year were used for inference.
Coefficients were expressed both in raw units (per day, per cm, and per allele) and in standardized form to enable effect-size comparison. For interpretability, additional effect estimates were computed per 10 units of each predictor (e.g., 10 days, 10 cm, or 10 alleles). The partial R² statistic for each variable was derived from type-III sums of squares, representing its contribution to the total variance explained after adjusting for all other terms.
Across environments, average STB severity ranged from 3.5 to 4.6, and the distribution of disease scores across all trials and years is shown in Figure S2. Founder varieties displayed distinct resistance profiles: KWS Extase showed moderate resistance, SU Selke and Informer were consistently resistant, Kvium exhibited intermediate resistance, and Pondus showed variable responses depending on environment (Figure 1). LG Skyscraper was included as a susceptible control, with mean STB scores across sites and years ranging from 5.0 to 7.5, confirming its suitability as a high-susceptibility benchmark.
Informer and Kvium were also used as resistant checks replicated across all trial blocks. The values presented in Figure 1 reflect their performance when grown once within the main test panel, ensuring comparability with other single-entry genotypes. In contrast, the summary statistics reported below for the resistant checks derive from their multiple replicated plots distributed throughout the trials, providing a robust benchmark for disease pressure and trial consistency. Across years and locations, resistant checks showed lower STB scores: Informer (3.2–4.5), Kvium (3.1–5.0), Heerup (2.4–5.2), and Champion (2.9–5.6), confirming their appropriateness as resistant standards (data not shown).
Pairwise Pearson correlations among environments ranged from 0.23 to 0.80 (Figure 2). Correlations were strongest among trials within the same year and location, particularly in 2024 (up to r = 0.80 between Sejet and Flakkebjerg), and more moderate between countries (generally r < 0.50).
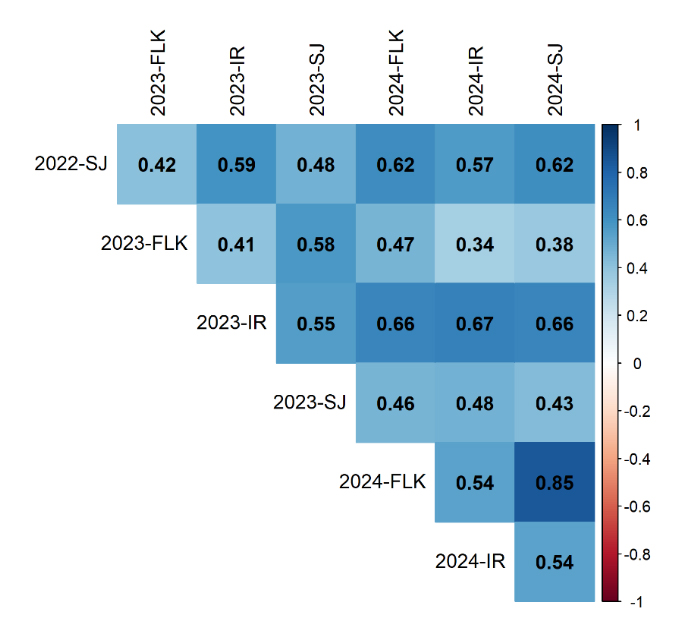 Figure 2. Pairwise Pearson correlations among multi-environment STB trials from 2022–2024. Each cell represents the correlation coefficient between trials, with shading intensity proportional to the strength of correlation. Trials are labeled by year and environment: SJ = Sejet; FLK RAN = Flakkebjerg, randomized replicate; FLK NORM = Flakkebjerg, normalized replicate; IR = Irish trials. Values range from –1 (perfect negative) to +1 (perfect positive), with darker blue indicating stronger positive correlations.
The relatively lower correlations observed in 2023, particularly at Flakkebjerg (r = 0.23–0.50), coincided with severe drought stress, which reduced overall disease pressure and phenotypic variance. Reduced variance under low epidemic intensity can attenuate correlation coefficients, reflecting both diminished expression of genetic differences and increased environmental noise.
These results indicate substantial genotype-by-environment interaction but also confirm detectable and repeatable genetic resistance across contrasting epidemic conditions. Variance component analysis indicated that genetic variance accounted for 45.7% of total phenotypic variance, while genotype × environment interaction contributed 17.9%. The moderate cross-environment correlations (r = 0.23–0.80) are therefore consistent with substantial G × E effects rather than reduced measurement repeatability, as replicate variance represented only 1.7% of total variance.
Genetic Structure and Relatedness Between Discovery and Validation PanelsA PCA based on 6,065 genome-wide markers was performed to assess the genetic relationship between the discovery and validation panels and to evaluate potential overfitting. The first two PCs explained 6.2% and 4.1% of the total genetic variance, respectively (Figure 3). The discovery panel (~450 lines) formed three partially separated clusters reflecting major breeding origins: UK/French (e.g., KWS Extase): Nordic (e.g., Kvium, Pondus): and German-influenced material (e.g., SU Selke, Informer). In contrast, the validation panel (~6000 lines) displayed a broader and more continuous distribution, consistent with its representation of multiple breeding programs and selection cycles.
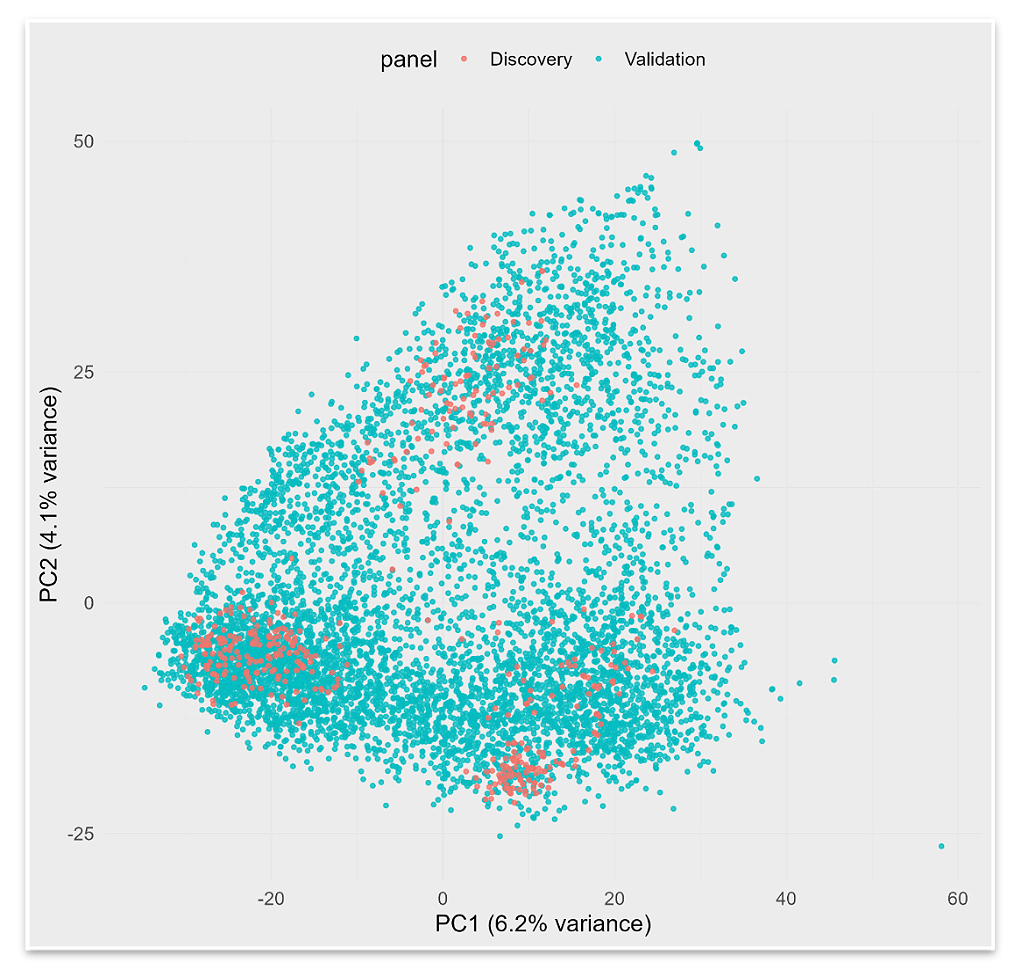 Figure 3. PCA of the discovery (~450 lines) and validation (~6000 lines) panels based on 6065 genome-wide SNPs. The first two PCs (PC1 = 6.2% of the variance; PC2 = 4.1% of the variance) are shown. Discovery lines are labeled in red and validation lines in blue.
Despite this broader distribution, substantial overlap was observed between the two panels along the first two PCs. Approximately 50% of the validation lines shared at least one parent with a line from the discovery panel, confirming close but not redundant relatedness. This structure is typical for Northern and Western European winter wheat programs and ensures both relevance and independence when validating marker effects.
GWAS Discovery ResultsGWAS across the five populations identified 13 significant marker–trait associations distributed across nine chromosomes (Table 2; Figure 4). Eight loci were detected across multiple environments and models, with the most robust signals observed on chromosomes 2B and 3D. The largest effects were detected for markers TA004380-0460 (1D) and Kukri_c4230_398 (3D). While five associations were environment-specific, a subset of loci were consistently detected across years and locations, highlighting their stability, namely, AX-158540908 (2B), AX-158572447 (2A), AX-89483131 (4D), AX-94821207 (7D), and TA004380-0460 (1D). These were identified using BLUPs across all years and environments. Chromosome 2B contains multiple significant loci detected in three populations, indicating a key resistance region. Marker genotypes and the distribution of favorable alleles across the founder and donor panels are shown in Figure S1.
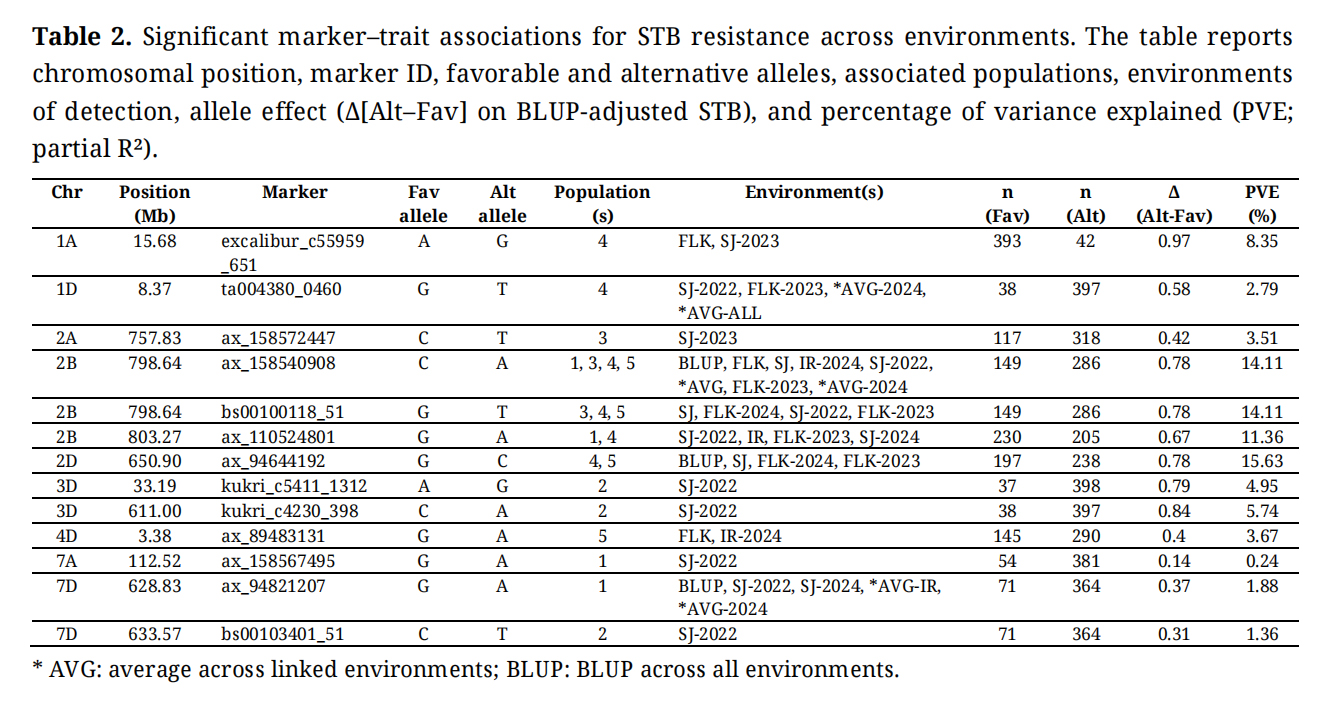 Table 2. Significant marker–trait associations for STB resistance across environments. The table reports chromosomal position, marker ID, favorable and alternative alleles, associated populations, environments of detection, allele effect (Δ[Alt–Fav] on BLUP-adjusted STB), and percentage of variance explained (PVE; partial R²).
The estimated allele effects (Δ[Alt–Fav]) ranged from 0.15 to 0.97 STB units on the BLUP-adjusted scale (Table 2). The percentage of variance explained (PVE) per locus ranged from 0.24% to 15.6%, with a median of 4.95%. Most loci explained between 1–10% of the phenotypic variance, while three loci on chromosomes 2B and 2D showed higher PVE values (11.4–15.6%).
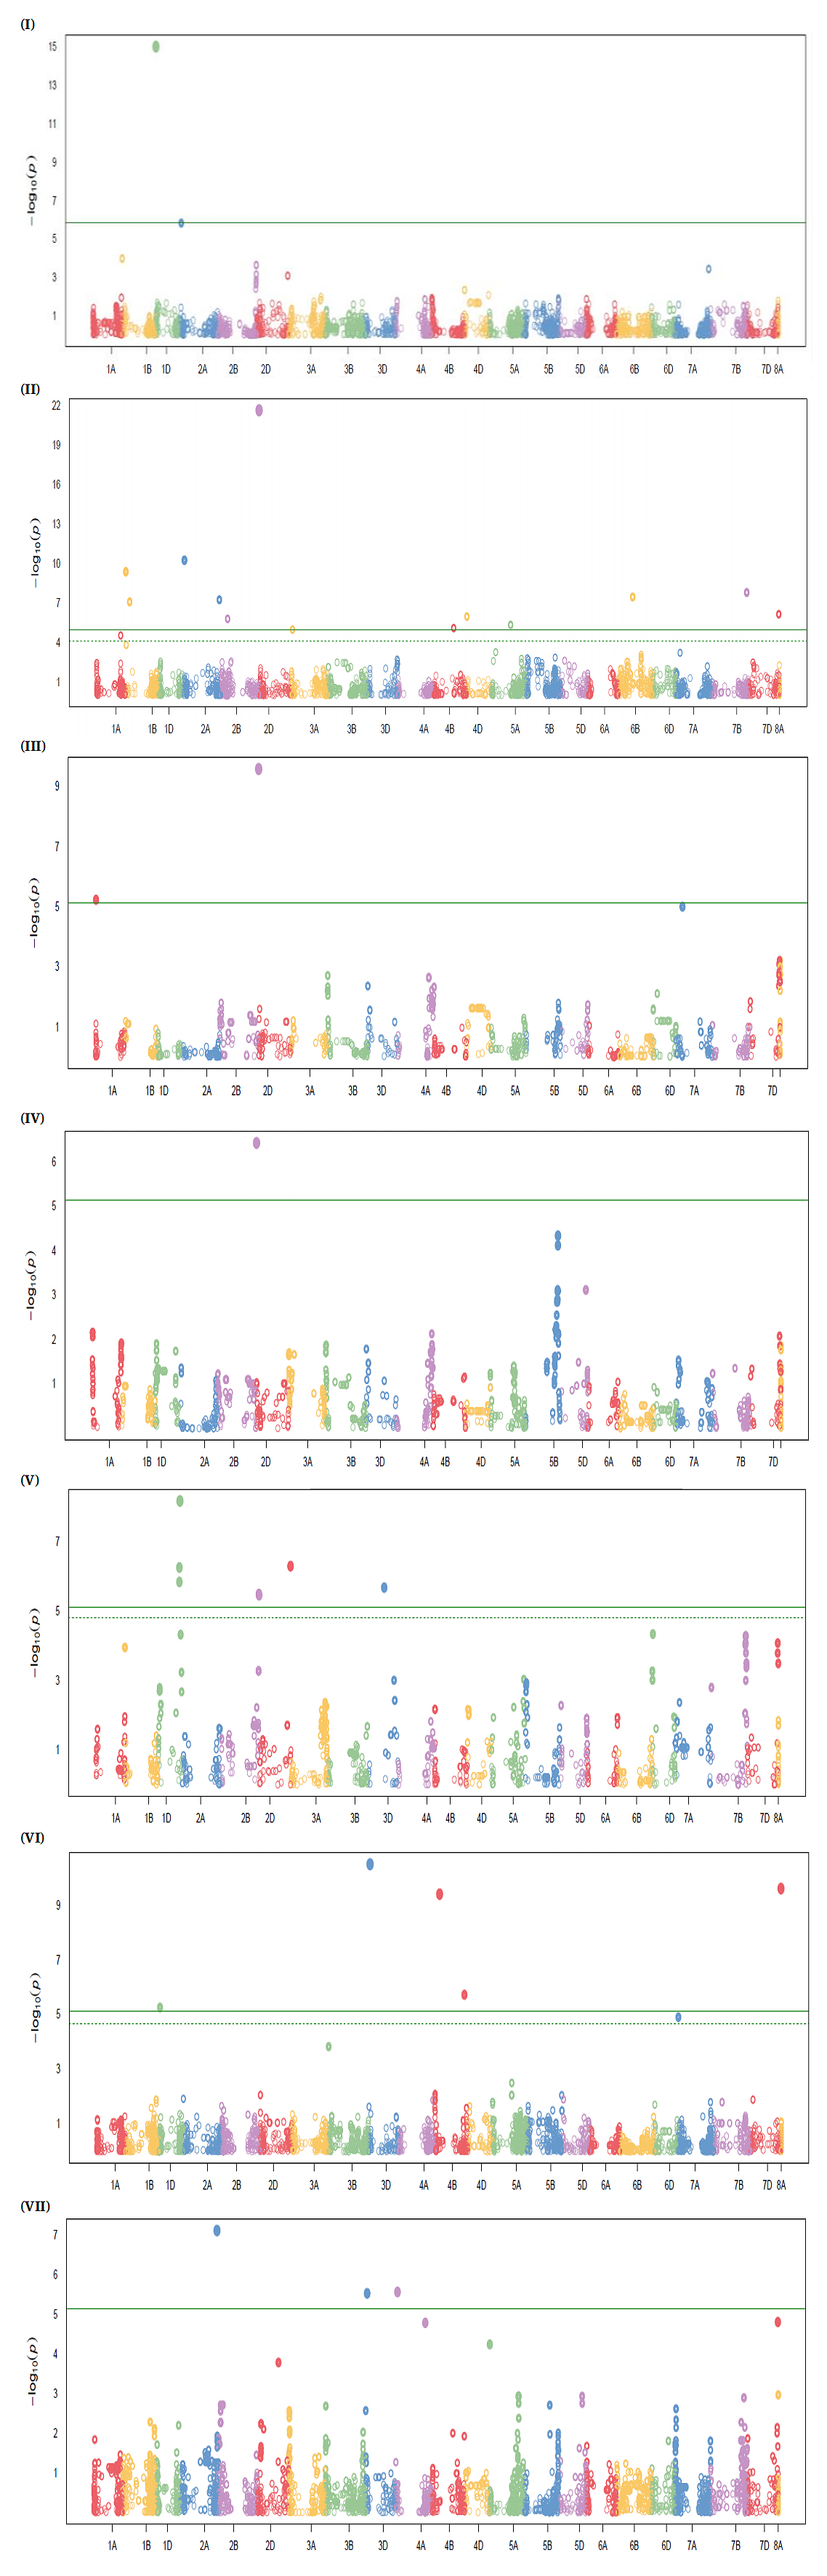 Figure 4. Manhattan plots of genome-wide association study (GWAS) results for STB resistance in the discovery panel. The y-axis represents −log₁₀(p), and the x-axis shows chromosomal position across the 21 wheat chromosomes. The solid horizontal line indicates the Bonferroni significance threshold and the dashed line indicates the false discovery rate (FDR) threshold. (I) Population 4, environment SJ-2023: significant association on chromosome 1A (Excalibur_c55959_651). (II) Entire discovery panel (across-environment BLUPs): significant associations on chromosomes 1D (TA004380-0460), 2A (AX-158572447), 2B (AX-158540908), 4D (AX-89483131), and 7D (AX-94821207). (III) Population 1, environment SJ-2022: significant association on chromosome 7A (AX-158567495). (IV) Population 1, environment SJ-2024: significant association on chromosome 2B (AX-110524801). (V) Population 5 (BLUP analysis): significant associations on chromosomes 2B (BS00100118_51) and 2D (AX-94644192). (VI) Population 2, environment SJ-2022: significant associations on chromosomes 3D (Kukri_c5411_1312) and 7D (BS00103401_51). (VII) Population 2, environment SJ-2022: significant association on chromosome 3D (Kukri_c4230_398).
In Figure 4III, the marker AX-158567495 is positioned on chromosome 7A; its visual placement in the plot reflects marker ordering in the dataset used for plotting and does not affect the reported chromosomal assignment in Table 2.
Several loci corresponded to previously reported resistance regions, including the Stb9/STBWat1 interval on 2B, the distal Stb16q region on 3DL, and the Stb3 region on 7AS. Additional associations on 1A, 2A, and 2D overlapped broader quantitative resistance regions described in European and Nordic panels, while the 4D signal was located within a genomic interval associated with Cougar-derived resistance. The comparison of average STB values for both favorable and alternative alleles across trials for the discovery panel is shown in Figure S1 (left).
Marker ValidationTo evaluate the transferability of the QTL identified in the discovery analysis, all 13 significant SNPs were tested in an independent validation panel of 6,588 elite winter wheat breeding lines evaluated from 2020–2025. STB severity in the validation panel ranged from 1.0 to 8.5 across environments (Figure S2). Twelve markers consistently reduced STB severity, whereas one marker (AX-89483131) showed environment-dependent effects (Table 3).
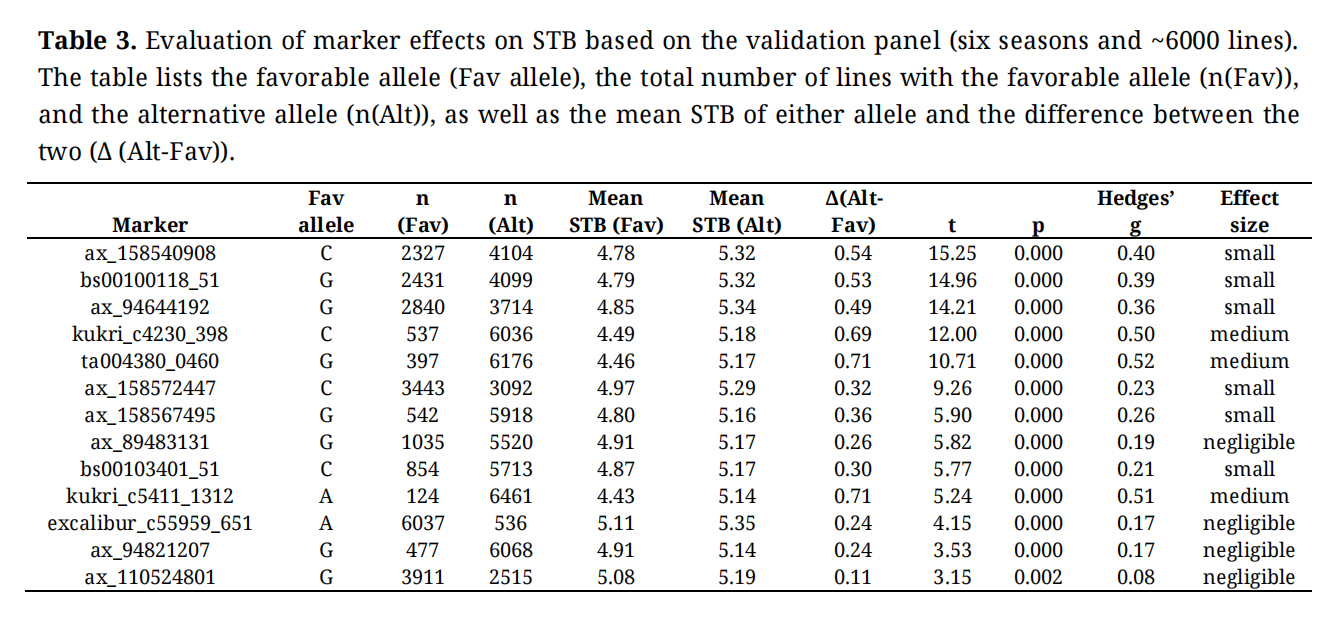 Table 3. Evaluation of marker effects on STB based on the validation panel (six seasons and ~6000 lines). The table lists the favorable allele (Fav allele), the total number of lines with the favorable allele (n(Fav)), and the alternative allele (n(Alt)), as well as the mean STB of either allele and the difference between the two (Δ (Alt-Fav)).
Effect sizes ranged from 0.08 to 0.52 (equivalent to ~0.2–0.7 units on the 1–9 STB scale), and effect directions were fully consistent with those observed in the discovery panel (Table 2).
The strongest and most stable effects were observed for TA004380_0460 (1D), Kukri_c4230_398 (3D), and Kukri_c5411_1312 (3D), each reducing mean STB severity by ~0.69–0.71 units. Several high-effect alleles occurred at low frequencies—for example, Kukri_c5411_1312 was present in only 124 of 6,461 lines, indicating substantial scope for introducing these alleles into elite breeding programs. Overall, these results demonstrate that the majority of loci identified in the discovery analysis retain predictive value when tested across a much broader and independently derived breeding population.
Allele frequencies for all significant markers in both the discovery and validation panels, together with favorable vs. alternative allele contrasts, are shown in Figure S1.
Stacking EffectLines in the validation panel carried between 0 and 11 favorable alleles; however, the majority carried between 3 and 7. STB scores decreased progressively with allele count, with a mean reduction of ~0.18 per additional favorable allele (ANOVA, p < 0.001). This additive relationship between favorable allele count and disease severity is illustrated in Figure 5. This suggests a positive additive effect. A linear mixed model with favorable allele counts as a fixed effect and year as a random effect explained 34.5% of the phenotypic variation in STB (conditional R² = 0.35), of which 5.5% was attributable to allele stacking alone (marginal R² = 0.06). Model diagnostics (QQ plot, residuals versus fitted values, and residual distribution) indicated that the linear assumptions were reasonably met (Figure S4).
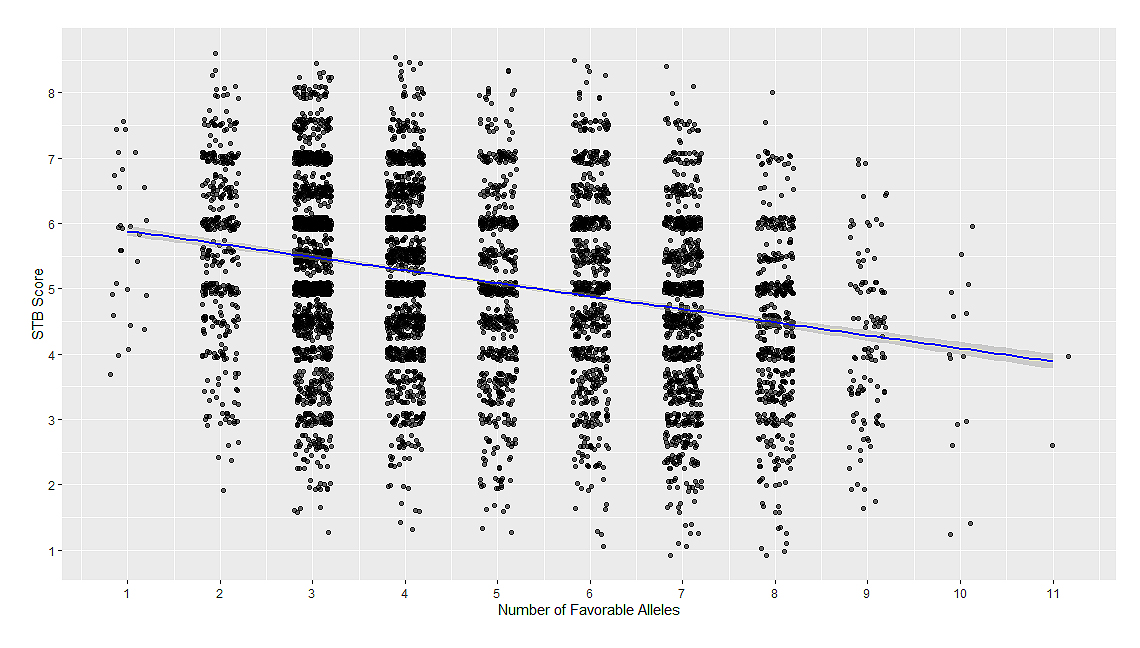 Figure 5. Relationship between favorable alleles counts, and mean STB severity score in the validation panel. The line shows a fitted linear regression.
To assess whether the observed effects of marker stacking could partly reflect indirect influences of plant phenology or height. STB scores from each year were included as separate observations in the linear mixed model, with Year modeled as a random effect to account for environmental variation, as a function of heading date, plant height, and the number of favorable alleles.
The combined model explained 39% of the total variation in STB (R2 = 0.389). Across years, STB severity decreased significantly with later heading (−0.0946 ± 0.0278 SE per day; p = 6.8 × 10⁻⁴), increased plant height (−0.0371 ± 0.0083 SE per cm; p = 7.7 × 10⁻⁶), and with each additional favorable allele (−0.1777 ± 0.0325 SE; p = 4.8 × 10⁻⁸) (Table 4). Model diagnostics indicated mild heteroskedasticity but acceptable collinearity (VIF < 5) and few influential observations (<1 % of cases), confirming that the linear assumptions were met.
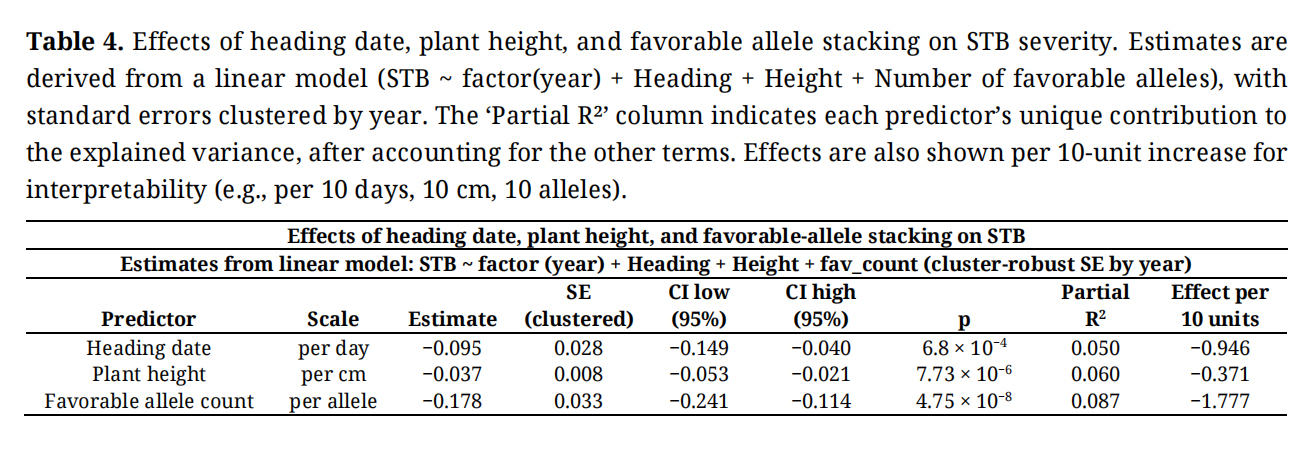 Table 4. Effects of heading date, plant height, and favorable allele stacking on STB severity. Estimates are derived from a linear model (STB ~ factor(year) + Heading + Height + Number of favorable alleles), with standard errors clustered by year. The ‘Partial R²’ column indicates each predictor’s unique contribution to the explained variance, after accounting for the other terms. Effects are also shown per 10-unit increase for interpretability (e.g., per 10 days, 10 cm, 10 alleles).
Partial R2 indicated that, after accounting for year effects, heading and height explained 5.0% and 6.0%, respectively, of the remaining variation in STB, while the number of favorable alleles contributed 8.7% independently of these traits. Year-to-year differences remained the largest source of variance (26%). Pairwise correlations among heading date, plant height, and favorable allele count were low overall (r ≤ 0.05). Partial correlations controlling for year and remaining covariates confirmed no meaningful association between favorable allele count and heading date (r = −0.011, p = 0.40) or plant height (r = −0.017, p = 0.17). Although heading date and plant height were weakly correlated (partial r = −0.040, p = 0.001), the effect size was negligible. Variance inflation factors were low (VIF ≤ 2.1), indicating minimal multicollinearity among predictors. The linear mixed model analyses revealed that later heading and, to a lesser extent, taller plants were associated with reduced STB severity after adjusting for year effects. On average, a 10-day delay in heading corresponded to approximately 0.9 points lower STB score, whereas a 10-cm increase in height corresponded to 0.4 points lower STB.
Model diagnostics indicated no substantial deviations from linearity or influential outliers (Figure S4). Added-variable plots (Figures S5 and S6) showed linear, negative relationships between STB severity and both heading date and plant height, consistent with the regression coefficients reported in Table 4.
Together, these results confirm that the reduction in STB severity from allele stacking cannot be fully explained by correlated phenological or architectural traits. The stacked markers exerted an independent, additive effect on disease resistance beyond later heading and taller canopy structure. The estimated marker effect sizes in both the discovery and validation panels are summarized in Figure 6.
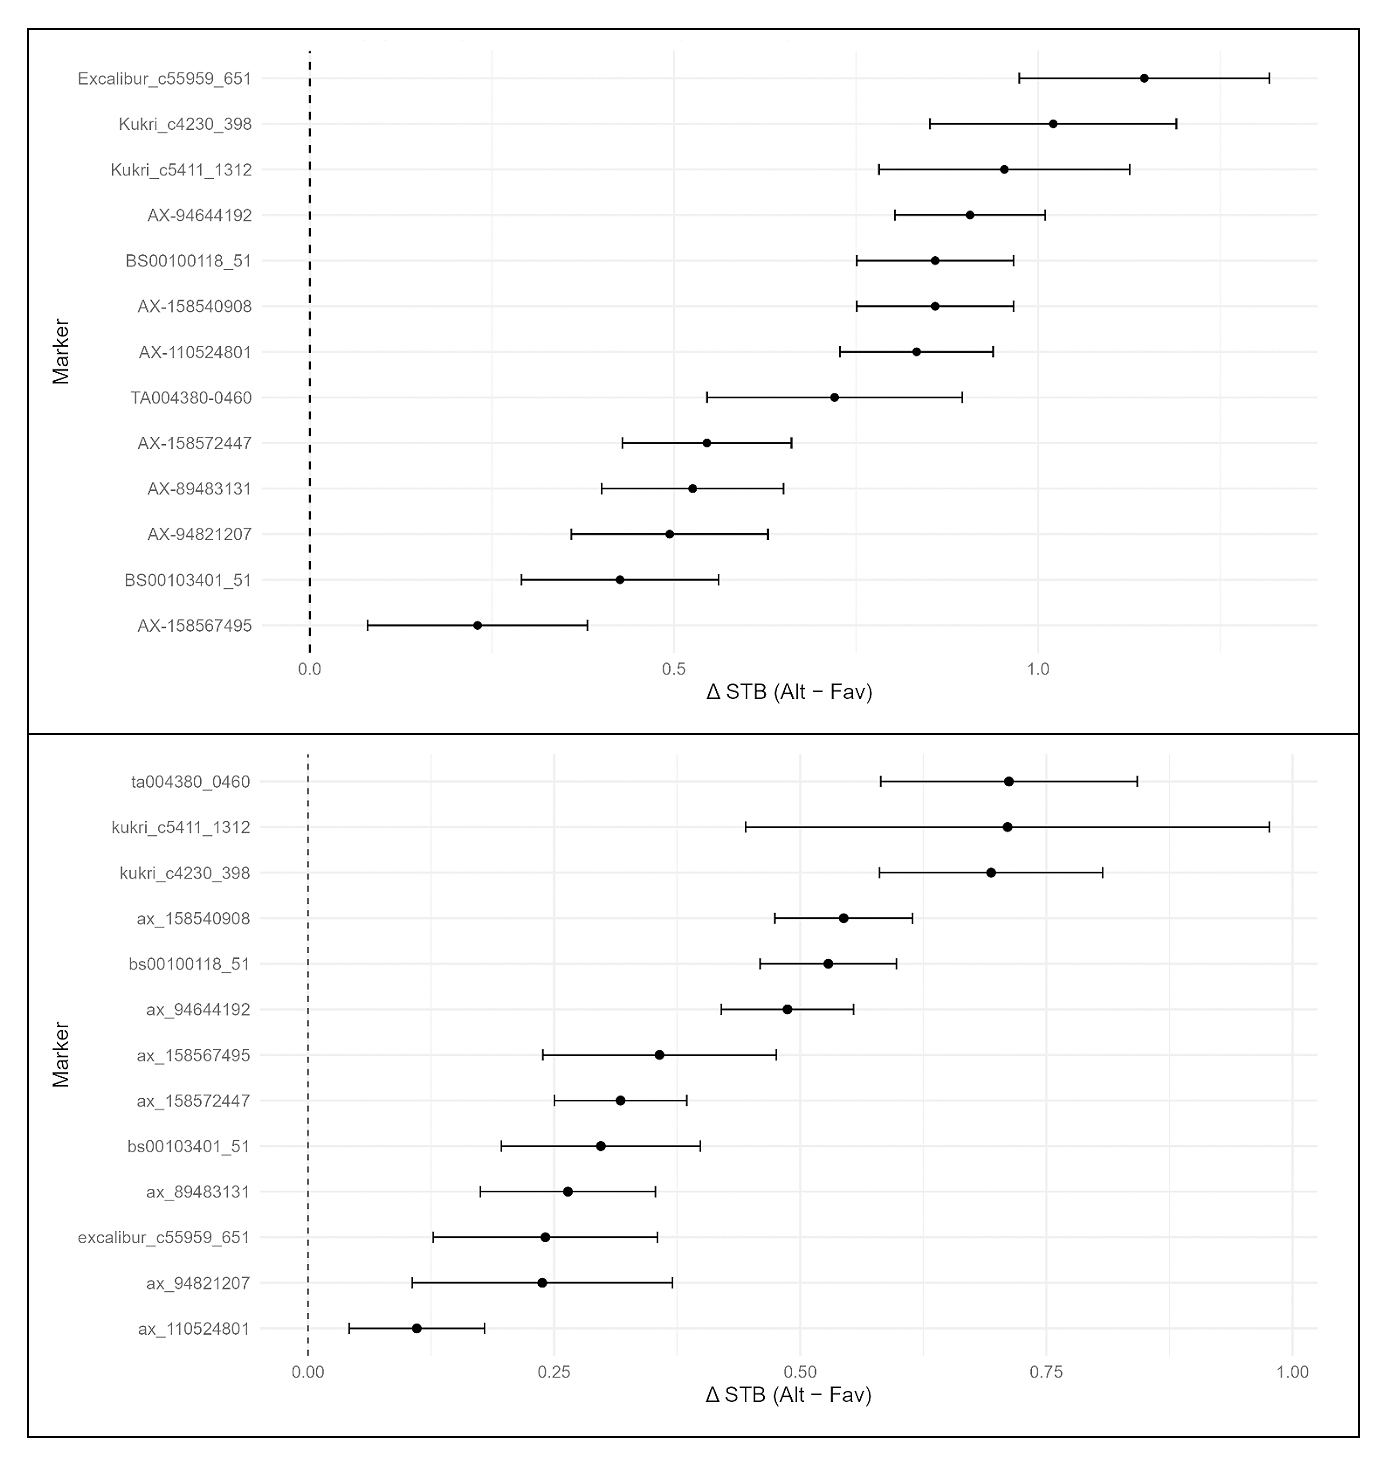 Figure 6. Effect sizes of discovery (top) and validation panel (bottom) for STB resistance-associated markers.
Several loci were consistently detected across environments, while others were environment specific. Unlike previous QTL studies based on exotic germplasm, this work identified and validated markers directly in elite European lines, ensuring immediate breeding relevance. Several recent studies have also targeted STB resistance in elite germplasm panels. For example, genome-wide association mapping in North European winter wheat varieties and breeding lines identified multiple quantitative loci conferring STB resistance, and comparisons among varieties containing several QTL showed improved resistance with stacking [26]. Similarly, the GABI-WHEAT panel of elite European cultivars has been leveraged for STB and other trait mapping in breeder-relevant genetic material [27]. More recent GWAS in large elite bread wheat panels across multiple environments have further expanded the catalogue of STB resistance loci relevant to contemporary breeding germplasm [28]. The validation of all 13 markers across six years and ~6000 unique breeding lines underscores their stability in diverse elite genetic backgrounds. However, frequency analysis of 1185 marketed varieties (genotyped varieties from 2014 to 2025) revealed that most favorable alleles remain rare, highlighting untapped potential for resistance improvement through allele stacking (data not shown).
When phenotyping for STB severity, we observed high correlation between some years and locations. The 2023 drought year highlighted the influence of the environment on phenotyping, with lower and more uncertain disease levels reducing the magnitude of marker effects in some cases. For example, the trial at Flakkebjerg in 2023 suffered from severe drought, leading to the exclusion of several lines (~40%) from STB assessments. Although environmental variation affected disease expression, particularly during the drought year 2023, the stability of marker effects across multiple seasons and locations still underscores the robustness of the dataset.
It is well established that disease levels vary between years and locations, supported for instance by data from several years of Danish national field trials (https://sortinfo.dk/). Other studies have shown that STB disease levels are highly affected by the environment [29–31].We observed some variation of founder variety STB levels across the included seasons and locations (Figure 1), with slightly higher levels identified in the Irish trials, likely due to more optimal climatic conditions for pathogen growth and establishment.
With the exception of AX-89483131, all identified markers gave consistent reductions in disease scores across years and sites (Figure S1), which was observed for both the discovery and validation panels. AX-89483131, associated with a major resistance locus derived from the cv Cougar, showed inconsistent effects in certain years. The data align with its partial breakdown since ~2018–2019, as reported by [8]. Despite this instability, its additive contribution in stacked configurations justified retention.
This section should explain the implication of the results and should place them into a broader context of the current literature. Discussion may contain subheadings to highlight important areas that are expanded on in the main text.
Relationship to Known Resistance LociGWAS revealed 13 QTL for STB resistance on chromosomes 1A, 1D, 2A, 2B, 2D, 3D, 4D, 7A, and 7D. Although the markers identify genomic regions rather than specific causal genes, some are located within coding regions and could be candidates for further study. The 7K marker array covers only ~0.00004% of the 17 Gb T. aestivum genome, with an average spacing of roughly 2.5 Mb between markers. Consequently, many genes fall within the interval tagged by each marker. However, the array was designed to target markers within large linkage blocks that are less prone to recombination during meiosis [32].
Among the most consistent signals were those on 2B, 3DL, and 7A, which fall within well-established resistance regions. The 2B cluster (~798–801 Mb) lies close to Stb9 and the recently described broad-effect locus STBWat1, both defining a major quantitative hotspot repeatedly detected in European and Nordic studies [33–36]. On 3DL, a strong association at 611 Mb corresponds to an adult-plant QTL distal to the cloned Stb16q interval [33,36]. Similarly, the 7A marker (112 Mb) maps within the Stb3 region, a repeatedly detected locus across European and African panels [15,37].
Several other associations were located in regions that recur in multi-environment GWAS. The 1A and 2A loci correspond to broad QTL zones reported in Nordic and Ethiopian panels [26,38], consistent with polygenic resistance rather than major genes. A weaker 1D association likely tags a linked QTL within the broader Stb10 region, whereas the 2D signal (650 Mb) matches low-frequency QTL reported in [34,35]. The 4D locus (3.4 Mb) falls in a sparsely mapped region but overlaps the interval associated with the breakdown of the Cougar-derived resistance used in European breeding [39,40]. Together, these results suggest that most loci detected here coincide with known European resistance regions, while a few, particularly on 2D and 4D, may represent less characterized or recombined sources of quantitative resistance. The moderate marker density of the 7K array limits resolution, but the strong and consistent effects observed across years and environments underscore the utility of these markers as breeder-ready anchors for marker-assisted or genomic selection.
Based on genotypic data on 1185 elite varieties, we found that only one allele was close to fixation (Excalibur_c55959_651-A on 1D at 88%), whereas most favorable alleles remain rare, including TA004380-0460-G (6%), Kukri_c5411_1312-A (4%), and Kukri_c4230_398-C (11%), with intermediate frequencies across the 2B cluster (AX-110524801-G 55%, BS00100118_51-G 41%, AX-158540908-C 39%) (data not shown). Importantly, differences in genetic position and the exotic origin of several earlier studies suggest that the loci identified here may be distinct allelic variants, more directly relevant for European elite germplasm. The observation that only one allele approached fixation (Excalibur_c55959_651-A on 1D, 88%) while most favorable alleles remain rare raises the possibility that strong-effect resistance alleles have not been widely adopted in breeding either because of linkage drag with undesirable traits or because they are less represented in Northern European germplasm pools. This highlights a central challenge for breeding, balancing the introgression of novel resistance loci with the maintenance of agronomic performance. Nonetheless, the rarity of most favorable alleles in commercial germplasm indicates substantial untapped potential for improving resistance through targeted stacking.
Additive Nature of Quantitative ResistanceThe consistent additive reduction in STB severity (~0.18 per favorable allele) supports a polygenic resistance strategy. Each locus contributes modestly, but together they may contribute to more stable resistance relative to single major genes. The linear mixed model with favorable allele counts as a fixed effect and year as a random effect explained 34.5% of the phenotypic variation in STB (conditional R2 = 0.35), of which 5.5% was attributable to allele stacking alone (marginal R2 = 0.06). The moderate yet explanatory power, given the complexity of quantitative resistance, highlights the substantial contribution of these 13 markers while indicating that additional loci and environmental factors also influence STB levels. While diminishing returns may occur beyond a certain number or combination of alleles, the trend remains linear enough to justify stacking as many validated loci as feasible within a breeding program’s genetic constraints.
The distinction between major-gene resistance (MGR) and quantitative resistance (QR) in STB is often blurred. MGR typically involves gene-for-gene interactions conferring strong but potentially race-specific effects, whereas QR is traditionally defined as polygenic, partial resistance governed by multiple loci with small additive effects. In practice, partially eroded major genes may phenotypically resemble minor QTL, and stacking multiple MGR loci can produce quantitatively expressed resistance. Our results likely reflect a continuum between these categories rather than a strict dichotomy, underscoring the importance of combining loci with complementary modes of action.
Similar additive effects of minor QTL have been documented in other crop-pathogen systems, where quantitative resistance emerges from the combined action of multiple small-effect loci [41–43]. An important question is whether the effects observed here represent genuinely broad-spectrum QTLs or whether they could reflect major resistance genes that now contribute only minor effects due to partial adaptation of local Z. tritici populations [44,45]. This distinction has practical implications: broad-spectrum QTL may represent partially eroded major resistance loci whose effectiveness has declined following pathogen adaptation.
The correlations between sites and seasons demonstrate the value of multi-environment validation for quantifying the stability of quantitative resistance. Together, these findings argue that a polygenic resistance strategy based on stacking validated loci is feasible, but also that its long-term success will depend on understanding pathogen evolution and anticipating changes in virulence profiles, rather than relying on ‘blind breeding’ alone.
Environmental Influence and Site-Specific UtilityDisease levels varied across varieties, years and locations (ranging from 1.0 to 8.5, Figure S2). Mean STB severity ranged from 3.7 in 2022 to 5.3 in 2023, with the highest disease pressure recorded at Oak Park in Ireland (mean = 5.3 in 2023). The proportion of plots with high STB scores (≥7) further emphasized these differences: in 2023, 24.4% of the plots at Oak Park exceeded this threshold, compared with 3.1% at Flakkebjerg and 2.5% at Sejet. A similar, though less pronounced, pattern was observed in 2024, where 6.6% of Irish plots had STB ≥ 7, versus 5.2% at Sejet and only 2.3% at Flakkebjerg. The full distribution of STB severity scores (1–9) across years and environments in the discovery panel is shown in Figure S2, while the corresponding yearly distributions for the validation panel at Sejet are shown in Figure S3.
These distributions indicate that the Irish site generally experiences higher disease pressure and a heavier upper tail of severity, likely reflecting a combination of higher rainfall and the earlier establishment of aggressive Z. tritici strains. Such conditions make Oak Park, and Ireland in general, an effective early warning and high-selection-pressure environment for screening elite germplasm. This interpretation is consistent with European-scale monitoring, where Ireland and Great Britain show some of the highest baseline frequencies of key fungicide-resistance alleles in Z. tritici, marking the region as a hotspot for early emergence of both fungicide resistance and potentially virulent pathogen genotypes [46].
Multi-environment testing across years and sites is therefore essential for confirming marker stability under differing pathogen pressures and climatic regimes. The consistent performance of most resistance-associated markers across these environmental contrasts strengthens confidence in their reliability and potential for broad adaptation.
Although visual scoring aligned with UPOV standards provides high-throughput and breeding-relevant phenotyping, limitations should be acknowledged. The 1–9 scale compresses continuous variation into discrete classes, potentially reducing resolution. Visual assessment does not distinguish between latent infection, lesion density, or vertical disease distribution within the canopy. Moreover, assessments were conducted under natural infection rather than controlled inoculation, which may introduce variability in pathogen population composition. However, the multi-year and multi-site design mitigates these limitations and reflects realistic breeding conditions.
Implications for BreedingThe combination of multi-year, multi-site phenotyping, an elite germplasm focus, and subsequent validation delivers markers that are immediately relevant for deployment in marker-assisted selection. Their additive nature means they can also be incorporated into genomic selection pipelines, where effects can be captured as part of polygenic scores. Given the adaptability of Z. tritici, breeding strategies should prioritize stacking these minor-effect loci over reliance on single major genes. This approach reduces the likelihood of resistance breakdown and aligns with integrated pest management principles, particularly under evolving pesticide restrictions. At the same time, it remains possible that some of the minor effects detected here represent residual contributions of major resistance genes that have been partially eroded by pathogen adaptation [36,47,48], rather than truly broad-spectrum QTL.
The observation that several of the strongest-effect markers occur at low frequency in elite material suggests potential trade-offs. One explanation is linkage drag, where resistance alleles are linked to undesirable traits such as reduced yield or agronomic penalties. Negative correlations between STB resistance and yield under fungicide-protected conditions have been reported previously [22,49,50], raising the possibility that such trade-offs have constrained their use in commercial programs. Alternatively, some loci may be more prevalent in germplasm outside of Northern European breeding pools, which would explain their lower representation in the elite lines targeted here. Importantly, while our validation panel captured substantial diversity, it was focused on Northern European material, and thus conclusions about global relevance must remain cautious.
Despite these caveats, the validation panel supported most of the effects observed in the discovery analysis, providing confidence that the identified markers are breeding-relevant. Nevertheless, it is essential to ensure that markers selected for deployment are not only effective against STB but also acceptable agronomically. Resistance loci present in otherwise uncompetitive backgrounds are unlikely to be incorporated widely, regardless of their disease benefits. Future work should therefore focus on integrating resistance loci into elite genetic backgrounds and quantifying their impact on yield, quality, and overall agronomic performance.
The overlap observed between the discovery and validation panels further supports breeding relevance. PCA confirmed their genealogical links, with ~50% of validation lines sharing at least one parent with discovery lines. This relationship inevitably narrows the independent validation, but it also reflects the practical reality of breeding with elite germplasm, where novel loci must ultimately function within closely related material. In this sense, the validation design provides a realistic test of whether identified loci have utility across elite backgrounds, rather than more distantly related landraces or exotic donors.
Disentangling Phenological and Genetic Effects on STBPrevious studies have consistently reported correlations between STB resistance and later heading or increased plant height [51–53]. Such relationships often arise from disease escape, delayed infection timing or microclimatic effects within taller canopies, rather than intrinsic resistance.
Our analysis of the validation panel confirmed modest but significant effects of heading and height on STB, jointly accounting for roughly 11% of phenotypic variation after controlling for the year. However, the number of favorable alleles explained an additional 9% independently, showing that molecular resistance loci exert direct effects not attributable to canopy structure or phenology. While previous studies have documented correlations between STB severity and heading date or plant height [51–53] and several GWAS have reported marker effects in elite germplasm [26,34,35], direct quantitative comparison of standardized effect sizes for resistance loci and escape-related traits within a single large elite breeding panel has been less frequently reported.
This pattern mirrors the findings of [52], who observed consistent negative correlations between heading date and STB but found phenology insufficient to explain all genotypic variation. Similarly, [53] demonstrated through mechanistic modeling that plant height modulates but does not determine epidemic progression. Our results extend this evidence to elite European breeding material, confirming that marker-defined quantitative resistance operates partly independent of developmental escape. From a breeding perspective, this study highlights that combining alleles conferring physiological resistance with favorable phenological backgrounds can provide complementary and more stable field resistance against STB under varying epidemic conditions.
Ultimately, the utility of the markers identified here depends on their ability to contribute meaningful, stable resistance when stacked in elite backgrounds. Future work should aim to finely map the most promising loci, confirm causality where possible, and evaluate their effects in multi-environment yield trials. Combining validated markers with genomic prediction models will be critical to accelerate durable resistance breeding while ensuring that resistance comes without hidden agronomic penalties.
This study identified and validated 13 SNP markers associated with reduced STB severity in elite winter wheat germplasm. Multi-environment GWAS revealed loci stable across three years and three locations, and large-scale validation in an independent breeding panel confirmed consistent additive effects across diverse elite backgrounds. Favorable alleles reduced STB severity by approximately 0.18 units per allele on a 1–9 scale, demonstrating cumulative contributions of marker-defined resistance loci. Several favorable alleles remain underrepresented in commercial germplasm, indicating potential for further genetic gain through targeted stacking. These results provide breeder-relevant markers for marker-assisted and genomic selection aimed at strengthening quantitative resistance to STB in European winter wheat.
The following supplementary materials are available online, Figure S1: Marker allele effect on discovery panel (left) and validation panel (right), Figure S2: Proportion of breeding lines within STB severity score categories (1–9) for each year and location in the discovery panel, Figure S3: Proportion of breeding lines within STB severity score categories (1–9) for each year in the validation panel at Sejet, Figure S4: Diagnostic plots for the linear mixed model assessing the effects of heading date, plant height, and favorable allele count on STB severity. Panels include QQplot of residulas (left), residuals versus fitted values plot (middle) and residuals distribution (right), Figure S5: Partial relationship between heading date and STB after adjusting for plant height and year effects. Added-variable plot showing residual STB (after removing effects of plant height and year) versus residual heading date (adjusted for the same covariates), Figure S6: Partial relationship between plant height and STB after adjusting for heading date and year effects. Added-variable plot showing residual STB (after removing effects of heading date and year) versus residual plant height, Table S1: Founder and donor varieties used in the discovery panel. Each marker is shown at the top, with each respective variety's corresponding allele. Letters in bold are the associated “favorable allele”, Table S2: Founder and donor varieties used in the discovery panel. Each marker is shown at the top, with each respective variety's corresponding allele. Letters in bold are the associated “favorable allele”. Scale for assessment of disease severity in cereals (adapted from [25] and corresponding UPOV scale used in plant breeding and VCU testing (adapted from [24]).
The phenotype data and genotypic data are available upon request. Analysis scripts (R codes) used for GWAS, allele frequency analysis, and figure generation are available upon request. Raw genotype datasets subject to breeding IP are available upon reasonable request under a data-use agreement.
NFV, LNJ, SK, WF, and FB conceived the study and designed the experimental framework. NFV, LNJ, SK, WF, FB and MSH developed the methodology, and WF and NFV carried out the formal analyses and data curation. Field and greenhouse investigations were carried out by NFV. NFV prepared the visualizations and wrote the first draft of the manuscript. All authors NFV, LNJ, SK, WF, and FB contributed to reviewing and editing the manuscript and to the overall conception and interpretation of the work.
The authors declare that they have no conflicts of interest.
We received funding from The Innovation Fund Denmark and Pajbjerg Foundation which both provided economical support to the PhD-project ‘Stacking genes for control of Septoria tritici blotch in wheat.
We extend our sincere thanks to the technical teams at Flakkebjerg, Sejet, and Oak Park for their invaluable assistance throughout this study. At Flakkebjerg, we are especially grateful to Hans-Peter Madsen and Anders Almskou-Dahlgaard for their dedicated management of the field trials, including sowing and spraying. At Sejet, we thank Maiken Fjeldbo Andreasen and Søren Houmann for their support with field trial management, particularly irrigation and spraying, and Mette Kammersgaard for her skilled assistance with DNA extraction and KASP marker analysis. At Oak Park, we acknowledge the essential contributions of David P. Kelly for his dedicated management of the field trials. We also thank Maarit Mäenpää for valuable statistical advice and support, which strengthened the analyses presented in this work.
1.
2.
3.
34.
35.
36.
37.
38.
39.
40.
41.
42.
43.
44.
45.
46.
47.
48.
49.
50.
51.
52.
53.
Vestergård NF, Borum F, Hovmøller M, Kildea S, Jørgensen L, Füchtbauer W. Genome-Wide Identification and Validation of Septoria Tritici Blotch Resistance Alleles in Elite Winter Wheat Germplasm. Crop Breed Genet Genom. 2026;8(1):e260009. https://doi.org/10.20900/cbgg20260009

Copyright © Hapres Co., Ltd. Privacy Policy | Terms and Conditions