Location: Home >> Detail
Crop Breed Genet Genom. 2026;8(2):e260017. https://doi.org/10.20900/cbgg20260017
 ,
Anna-Maria Botha 2 ,
Marlon-Schylor Le Roux 2,*
,
Anna-Maria Botha 2 ,
Marlon-Schylor Le Roux 2,*
1
2
*
Wheat, a globally important staple crop, faces increasing drought-related yield losses which drives the search for new genetic targets to further improve the complex, multigenic trait of drought tolerance. In a previous study we reported the upregulation of the Serine protease inhibitor (Serpin)-Z2B protein correlated with increased drought tolerance in mutant wheat line BIG 8-1. In this study we investigate the physio-morphological changes in wheat leaves in response to water deficit stress, within BIG 8 and SST wheat lines, in correlation to changes in Serpin-Z2B gene expression. Physio-morphological and cellular imaging identified a consistent trend in declining performance, with limited resolution to identify outliers based on single traits. Principal component analysis assessed the multivariate profiles of all wheat lines and identified several outlier wheat lines, BIG 8-1 and SST 027 SA1, that maintained distinct profiles under stress which were selected for further investigation. Gene expression analysis of the candidate lines through RT-qPCR and SqPCR identified upregulation in Serpin-Z2B under early water deficit stress. The results show that while Serpin-Z2B upregulation cannot be directly linked to superiority in an individual trait, it is correlated with lines that maintained distinct multivariate profiles and suggests that Serpin-Z2B may contribute to early stress response regulation. These results support previous findings and while causality cannot be confirmed, they support the rational to further investigate Serpin-Z2B for functional validation, as a future selection marker of drought tolerance in wheat.
ANOVA, analysis of variance; CAF, central analytical facilities; EMS, ethyl menthane sulfonate; FFA, formaldehyde alcohol acetic acid; PBS, phosphate-buffered saline; PCA, principal component analysis; PCR, polymerase chain reaction; RCL, reactive centre loop; RT-qPCR, real time quantitative polymerase chain reaction; SA, sodium azide; Serpin, serine protease inhibitor; SNP, single nucleotide polymorphism; sqPCR, semi-quantitative polymerase chain reaction; TAE, tris-acetate
Wheat (Triticum aestivum L.), a member of the Poaceae family, is one of the world’s most important staple crops, with annual production exceeding 789 million tonnes [1,2]. Global population growth and competition for arable land continue to increase pressure on food security [3,4]. This strain on food security is further intensified by stagnating yield gains in major wheat-growing regions, largely due to climate change, with drought representing the most severe constraint [5]. Water deficit stress in plants, resulting from environmental drought conditions, affects approximately 75% of global wheat production areas, disrupting wheat’s structural integrity, cellular homeostasis, ability to maintain normal biological functionality and consequently its ability to develop and properly fill grain [6–9].
To address climate-related risks, both conventional breeding and advanced genetic technologies are being applied to wheat improvement [6,10]. In South Africa, the agricultural company Syngenta (previously Sensako) has developed several elite commercial wheat lines, known as SST lines, with improved disease and drought tolerance through conventional breeding methods [11]. However, the lines were further enhanced through random mutagenesis. Mutagenesis allows for the identification and creation of novel gene targets and gene alleles for use in crop improvement [12–14]. It has been utilized in the creation of 276 registered wheat mutant varieties (https://nucleus.iaea.org/sites/mvd). We have previously demonstrated the benefits of random mutagenesis by means of either sodium azide (SA) or ethyl methane sulfonate (EMS) derived mutant wheat lines, such as RYNO3639 and BIG 8, which possess varying degrees of improved drought tolerance and display unique phenotypic characteristics [15,16]. These two lines were further characterized by a proteomic approach to evaluate the mutant wheat lines BIG 8 and BIG 8-1 under water deficit stress [15,16], leading to the confirmation of an upregulation in several proteins, including Serpin-Z2A and Serpin-Z2B, in correlation to improved drought tolerance. These findings have prompted further investigation into the regulatory mechanisms governing serpin expression.
Serine protease inhibitors (serpins) are a family of proteins that fulfill defensive and regulatory roles within wheat through their inhibition of serine and cystine protease enzymes [17,18]. Serpins act as competitive substrates to target serine and cystine proteases, irreversibly inhibiting their function through a suicide substrate mechanism by forming covalent bonds to the protease following catalytic cleavage by the protease enzyme [19,20]. The functionality and specificity of serpins is targeted around a reactive centre loop (RCL) which mimics the target substrate of a protease and facilitates the covalent bonding of the serpin to the protease once cleaved. Broad spectrum studies by Dong et al. (2023) [21], and Ferreria et al. (2023) [22] have identified a positive correlation between the upregulation of several serpin genes and abiotic stress responses. The serpin protein family have been identified as promising targets for improving drought tolerance in wheat, as demonstrated by [16,21,23]. Benbow et al. (2019) [17] and García-Molina et al. (2019) [24] identified upregulated transcription of Serpin-Z2B under drought stress in correlation to improved drought tolerance.
To further evaluate the potential of serpins such as Serpin-Z2B as targets for crop improvement, this study utilized a combined physio-morphological and gene expression analysis approach. This will serve as a pilot study to expand upon previous findings and determine if there is sufficient evidence to warrant further in-depth study of serpins, utilizing gene modification methods such as CRISPR, for improving water deficit stress tolerance in wheat. The aim of this study was to assess the degree of water deficit stress tolerance of several SST and BIG 8 wheat lines in relation to changes in gene expression patterns of Serpin-Z2B. We hypothesize that serpins act as regulators of stress response mechanisms through their protease inhibition mechanism and that a maintained or upregulation of serpin gene expression under early water deficit stress correlates to improved drought tolerance.
The study utilised twelve wheat lines comprising three commercial SST cultivars, SST 027, SST 877, and SST 0147, together with their respective mutant derivatives generated through SA or EMS mutagenesis. The parental lines were supplied by Sensako, now Syngenta South Africa. Detailed breeding pedigrees, protocols, and selection criteria for the SST material were not disclosed by the supplier, as such information is commonly considered proprietary within commercial breeding programs.
In addition to the SST material, the study included the wheat lines BIG 8 and BIG 8-1, which were independently generated laboratory mutants derived from EMS mutagenesis of the commercial BIG cultivar [16]. These lines were developed and maintained within the Cereal Genomics Laboratory at Stellenbosch University. The BIG germplasm is genetically and developmentally distinct from the SST germplasm and was therefore treated as a separate group throughout the study.
All comparisons and statistical analyses were performed between parental lines and their corresponding mutant derivatives, ensuring that observed differences were evaluated within shared genetic backgrounds.
All plants were sampled at a uniform chronological age of 60 days post-germination. At the time of sampling, plants had reached approximately the late tillering phase, with developmental status described using the Zadoks scale (approximately stages 15–23) [25]. The Zadoks scale was used as a descriptive reference rather than as a strict synchronization criterion, as inherent genotypic differences in growth rate resulted in minor variation in developmental progression among wheat lines. Standardizing sampling by plant age ensured consistent exposure time prior to drought induction while allowing biologically relevant growth-rate variation to be retained for comparative drought-response assessment.
For each wheat line, fifteen plants were grown across five 4 kg pots (10 cm × 10 cm × 15 cm), containing a 1:1 mixture of sand and crusher dust, under greenhouse conditions at the Welgevallen Experimental Farm, Stellenbosch University, South Africa. Plants were maintained under natural light with day–night temperatures of 23 ± 3 °C. A randomized block design was employed, with one block per parental line and its associated mutants, during growth and sampling [16].
Plants were subjected to a 21-day drought trial. Water deficit stress was induced by withholding irrigation for 14 days, reducing available soil moisture to below 1% to simulate severe and sustained drought conditions, as previously described by [16]. This was followed by a 7-day recovery period with daily morning watering, ending on day 21. Well-watered control samples were collected at day 0. Data collection was performed at 7-day intervals (days 0, 7, 14, and 21). Unless otherwise stated, all physiological, cellular, and molecular analyses were conducted on the sub-flag leaf, and no plant was sampled more than once to avoid confounding effects of destructive sampling on plant performance.
Physio-Morphological DataFlag leaf length (cm), flag leaf width at the widest point (cm), and plant height from the base to the highest point (cm) were measured at 7-day intervals beginning at day 0 (days 0, 7, 14, and 21). Stomatal conductance and chlorophyll fluorescence were recorded as indicators of physiological performance under water deficit stress [26,27]. All measurements were obtained in triplicate (technical replicates, n = 3) from three wheat plants per line selected according to the randomized block design (biological replicates, n = 3).
Abaxial stomatal conductance (mmol/m2s) was measured on the center of the selected plant’s second largest leaf, sub-flag leaf, using a porometer (model SC-1, Decagon Devices Inc., Pullman, WA, USA) following the manufacturer’s instructions. Chlorophyll fluorescence was measured using a dark adaptation protocol on the sub-flag leaf. Chlorophyll fluorescence was measured as the normalized parameter Fv/Fm which is a ratio of variable fluorescence (Fv) to maximal fluorescence (Fm) with Fv being calculated as maximal fluorescence minus minimal fluorescence (Fm-Fo). The leaf was fixed with a dark adaptation clip for 15 min prior to data collection using a Chlorophyll Fluorometer (model OS-30P, Opti-Sciences Inc., Hudson, NH, USA) following the manufacturers protocol.
Under prolonged and severe water deficit stress (day 14 and beyond), quantitative morphological and physiological measurements were increasingly constrained by extensive leaf rolling, tissue collapse, and senescence, which reduced measurement accuracy and increased the likelihood of artefactual variation; therefore, data interpretation under these conditions focuses on comparative trends rather than absolute trait values.
Cell Morphology DataWhole leaf samples, sub-flag leaf (second largest fully expanded leaf), were collected from each wheat line per sampling date and fixed overnight in FFA (formaldehyde alcohol acetic acid) solution (250 mL ethanol 100%, 25 mL glacial acetic acid, 50 mL formaldehyde 40%, 175 mL distilled water) and stored at 4 °C.
Following fixation, 2 cm transverse sections were excised from the central region of each leaf blade, rinsed in phosphate-buffered saline (PBS), and subjected to fluorescent staining. Sections were stained with Propidium Iodide (1:100) for 2 min, followed by Calcofluor White (0.1%) for 2 min, as previously described [28–30].
Stained cross-sections were then fixed vertically to a cuvette and visualized at 20× objective magnification using a confocal microscope (LSM 780, AxioObserver) following standard operators’ guidelines and operators program ZEISS ZEN 3.7 (Carl Zeiss Microscopy GmbH, Jena, Germany). Visualization consisted of capturing 20 individual images of a sample at different depths decreasing by intervals of 3 µm to create a Z-stack. Visualization was achieved by exiting the sample with two consecutive tracks of lasers of wavelengths 633 nm and 405 nm at 1% intensity in track 1 and wavelength 561 nm at 1% intensity in track 2. Subsequent light emissions following excitation were recorded in 8 Bit bit-depth at wavelengths 411–474 (Calcofluor White), 666–758 (Chlorophyll) and 570–650 (Propidium Iodide) [31].
Extended depth-of-field images were generated using orthogonal projections in ZEISS ZEN 3.7 and used to quantify relative cell area (µm2), mean chlorophyll fluorescence intensity, and mean Propidium Iodide fluorescence intensity of individual spongy mesophyll cells. Approximate cell volume was calculated from measured cell area assuming an approximately spherical cell geometry, using established geometric relationships [32]:
Formula (1) for the calculation of approximate cell area and volume.
Gene Sequencing and SNP IdentificationTo confirm the identity and sequence conservation of the Serpin-Z2B gene prior to expression analysis, genomic amplification and sequencing were performed for all twelve wheat lines included in this study using genomic DNA extracted from whole leaf tissue collected under control conditions (day 0).
Approximately 100 mg of frozen tissue was ground and used for DNA extraction. Total DNA was extracted using a Qiagen DNeasy Plant Mini Kit (plant tissue protocol; Qiagen, Venlo, the Netherlands) following the manufacturer’s recommended protocol. DNA was eluted in 100 μL filtered water (Milli-Q type 1 Ultrapure Water) and quantified with a Nanodrop ND-2000 spectrophotometer (v3.0.1) following manufacturer’s instructions (Nanodrop Technologies, Wilmington, DE, USA). Serpin-Z2B was amplified by polymerase chain reactions (PCR) using the Z2B_NEST primer pair designed on the Serpin-Z2B reference gene (Genbank accession number Y11486.1) with the NCBI’s primerBLAST (https://www.ncbi.nlm.nih.gov/tools/primer-blast/) tool that utilizes the primer3 platform (Table 1). All PCRs were optimized in a T100 thermo-cycler (Bio-Rad) in 50 µL reactions using Phusion High-Fidelity DNA Polymerase (ThermoFisher Scientific F631S, Waltham, MA, USA) with an annealing temperature of 63 °C. Following amplification, the fragment of interest was isolated through gel electrophoresis, band excision and purification using a GeneJET Gel Extraction kit (Thermo Scientific, Waltham, MA, USA) according to the manufacturer’s specifications. The amplified products were seperated by gel electrophoresis using a 1% agarose gel (SeaKem® LE Agarose, Basel, Switzerland) made using 1× Tris-acetate (TAE) buffer, pH 8. The gel was run at 90 V (Bio-Rad PowerPac 1000) for 60 min in 1× TAE buffer, pH 8. Purified PCR products were then sequenced using Sanger sequencing by the Central Analytical Facilities (CAF) at Stellenbosch University. Raw sequences were clipped on both ends to remove ambiguous or poor-quality reads in FinchTV (v1.4.0). Clipped sequences were then imported into CLC Sequence Viewer (version 7.6.1) where the forward and reverse sequences for each gene were aligned to the reference sequence Y11486.1 using the built-in alignment tools with the parameters for gap open cost set to 15.0 and the gap extension cost set to 2.0. Alignments were then assessed for single nucleotide polymorphisms (SNPs).
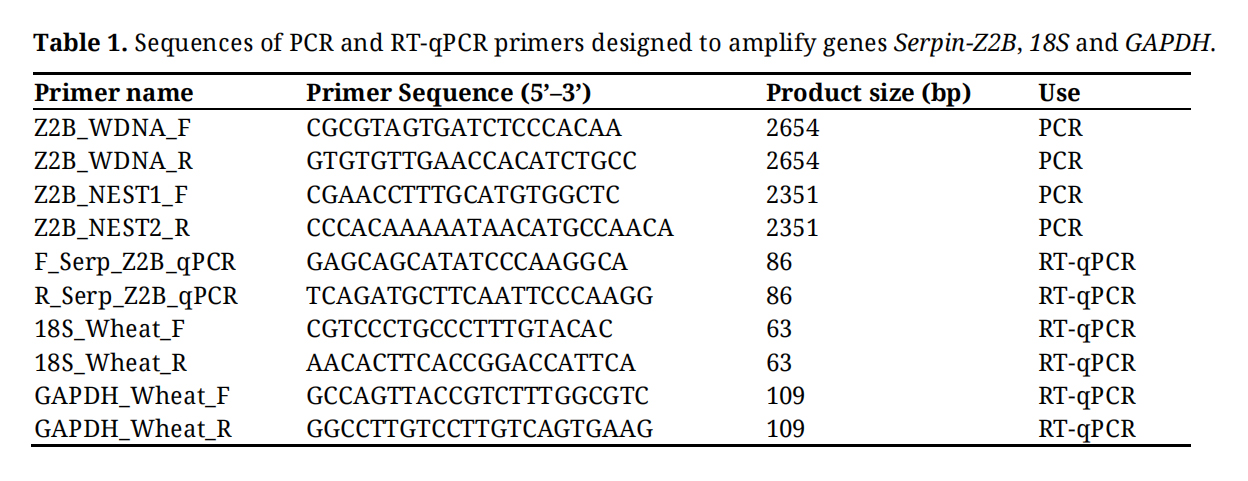 Table 1. Sequences of PCR and RT-qPCR primers designed to amplify genes Serpin-Z2B, 18S and GAPDH.
Four wheat lines (BIG 8, BIG 8-1, SST 027, and SST 027 SA1) were selected for real-time quantitative PCR (RT-qPCR) and semi-quantitative PCR (sqPCR) analysis based on their multivariate divergence in the integrated physio-morphological and cellular PCA, representing contrasting parental–mutant backgrounds under early water deficit stress. These lines were included as a targeted exploratory subset rather than a comprehensive twelve-line transcriptional screen. Whole leaf samples were collected from the wheat plants on 7-day intervals beginning at day 0 of the drought trial (0, 7, 14, 21) using the above-mentioned randomized block design. Samples were frozen in liquid nitrogen immediately after collection and stored at −80 °C. Approximately 80 mg of powdered tissue was used for each RNA extraction. Total RNA was extracted using a Qiagen RNeasy Plant Mini Kit (Total RNA plant tissue protocol: Qiagen) following the manufacturer’s recommended protocol. RNA was eluted in 30 µL RNase free water. RNA quality and quantity were measured using an RNA ScreenTape assay conducted by CAF at Stellenbosch University. Extracted RNA was stored at −80 °C for subsequent analysis. RNA was reverse transcribed to single-stranded cDNA using the SensiFAST cDNA Synthesis Kit (Bioline) following the manufacturer’s protocol. Volume of extracted RNA added to each sample was calculated based on RNA concentration (ng/µL) per sample. The cDNA synthesis conditions were 25 °C for 10 min, 42 °C for 15 min, 48 °C for 15 min, 85 °C for 5 min and then hold at 4 °C until stored at −80 °C. Synthesized cDNA samples were then submitted to CAF at Stellenbosch University for Qubit quantification. Following cDNA synthesis, Serpin-Z2B gene expression was quantified using RT-qPCR as described below.
Primers were designed for RT-qPCR and sqPCR amplification of the genes Serpin-Z2B (Y11486.1), 18S (AH001810.2) and GAPDH (NC_003070.9) using NCBI’s primerBLAST (https://www.ncbi.nlm.nih.gov/tools/primer-blast/) which utilizes the primer3 platform (Table 1). For RT-qPCR a five-point, 2.5-fold serial dilution of BIG 8 Day 0 samples was used to produce a standard curve. A CFX96 Real-Time System (Bio-Rad) was used to perform the RT-qPCR analysis. The RT-qPCR reactions were set up as follows: 400 nM of each primer, 1× concentration of SensiFAST Probe No-ROX Mix, 2 ng sample DNA and nuclease free water up to 10 μL as per manufacturer’s specifications. Reactions consisted of an initial denaturing step of 95 °C for 3 min, followed by 40 cycles of 95 °C for 10 s, 30 s at a relevant annealing temperature depending on the primer pair, 72 °C for 30 s. A melt curve analysis was also performed for each reaction to identify non-specific amplification. The Serpin-Z2B gene expression results were normalized against the reference genes 18S and GAPDH according to [33].
For sqPCR, PCR amplification was performed using a T100 thermo-cycler (Bio-Rad) in 10 µL reactions using GoTaq G2 (Promega M7841). The PCR reactions were set up as follows: 300 nM of each primer, 200 µM of each dNTP, 1× concentration of Colorless GoTaq reaction buffer, 2 ng sample DNA and nuclease free water up to 10 μL as per manufacturer’s specifications. Reactions consisted of an initial denaturing step of 94 °C for 2 min, followed by 38 cycles of 94 °C for 15 s, 15 s at an annealing temperature of 62 °C, 72 °C for 15 s, a final extension step at 72 °C for 5 min and a final holding step at 4 °C. The Serpin-Z2B gene expression results were normalized against the reference gene 18S. The amplified products were visualized by gel electrophoresis against a 1 kb plus DNA ladder (New England Biolabs N3200L), using a 2.5% agarose gel (SeaKem® LE Agarose) made using 1× Tris-acetate (TAE) buffer, pH 8. The gel was run at 80 V (Bio-Rad PowerPac 1000) for 80 min in 1× TAE buffer, pH 8. Band intensity was calculated and quantified relative to the ladder band intensities using BioRad Image Lab (v6.0.1) according to the manufacture’s specifications.
Statistical AnalysisGraphPad Prism 9.4.1 (Dotmatics, Boston, MA, USA) was used for statistical analysis and graph plotting. For all physio-morphological and gene expression data a fitted full model two-way ANOVA was performed on grouped data with a Geisser-Greenhouse correction to test for significant differences between selected wheat lines and degrees of water deficit stress, represented by days of drought, with level of significance set at p ≤ 0.05. The model assumptions for ANOVA (homoscedasticity and normality of the residuals) were tested for using a homoscedasticity plot and Shapiro-Wilk test (significance set at p ≤ 0.05), respectively. Tukey’s multiple comparisons tests were also performed between parental wheat lines and their respective mutant lines to assess differences over the course of the drought trial (significance set at p ≤ 0.05).
PCA plots were generated using R Studio (R console version 4.3.1 and RStudio version 2025.5.0.496) and the packages “factoextra”, “corrr: Correlation in R”, “ggplot2”, “ggcorrplot” and “FactoMineR”. All physio-morphological and cell morphology traits were first combined into a single multi-factored data frame for each sample date (0, 7, 14, 21). Following this data normalization was performed followed by the generation of a correlation matrix and Scree plot for each sample day’s dataset. Lastly a PCA biplot of variables and individuals was plotted for the dataset of each sample day [34,35].
Twelve wheat lines were grown under greenhouse conditions for 60 days, reaching approximately the late tillering stage (Zadoks’ scale 15–23) [25]. Baseline phenotypic characterization was conducted under optimal growing conditions prior to the imposition of water deficit stress (Table 2). Morphological assessments revealed statistically significant variation among the twelve wheat lines, primarily in flag leaf length and plant height, while flag leaf width showed no significant differences (Table 2).
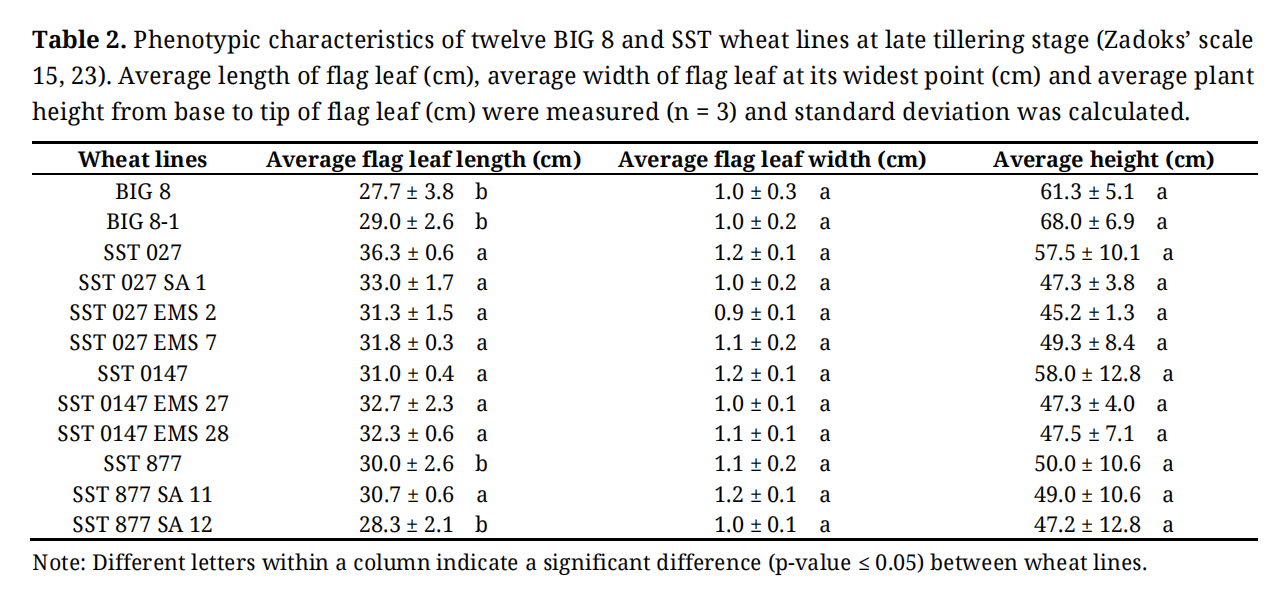 Table 2. Phenotypic characteristics of twelve BIG 8 and SST wheat lines at late tillering stage (Zadoks’ scale 15, 23). Average length of flag leaf (cm), average width of flag leaf at its widest point (cm) and average plant height from base to tip of flag leaf (cm) were measured (n = 3) and standard deviation was calculated.
The BIG 8 parental line and its mutant derivative exhibited significantly shorter flag leaves compared with several SST lines (p ≤ 0.05) and showed a trend toward greater plant height. Among the SST material, the parental lines SST 027 and SST 0147 tended to be taller than their respective mutant derivatives, and SST 027 also exhibited longer flag leaves relative to its mutants. Most SST lines showed minimal variation in flag leaf length, with the exception of SST 877 and SST 877 SA 12, which displayed significantly shorter flag leaves (p ≤ 0.05). No significant differences in flag leaf width were observed across the wheat lines.
Following baseline characterisation, all twelve BIG 8 and SST wheat lines were subjected to a controlled 21-day drought trial under greenhouse conditions (Figure 1). Soil moisture levels declined rapidly, falling from an average of 4.2% to below 1% by day 2, marking the onset of water deficit stress. By day 7, all wheat lines exhibited visible stress symptoms, including leaf wilting and rolling. At this time point, SST 0147 and SST 877 lines showed pronounced leaf browning, rolling, and senescence, whereas the BIG 8 lines exhibited comparatively reduced leaf browning and rolling. The SST 027 lines displayed intermediate responses, characterised by moderate leaf browning and senescence.
By day 14, all wheat lines were severely desiccated and exhibited extensive leaf senescence, and no line showed notable recovery following seven days of re-watering (day 21). These observations indicate differential early-stage responses to water deficit stress among wheat lines, which informed subsequent physiological, cellular, and molecular analyses.
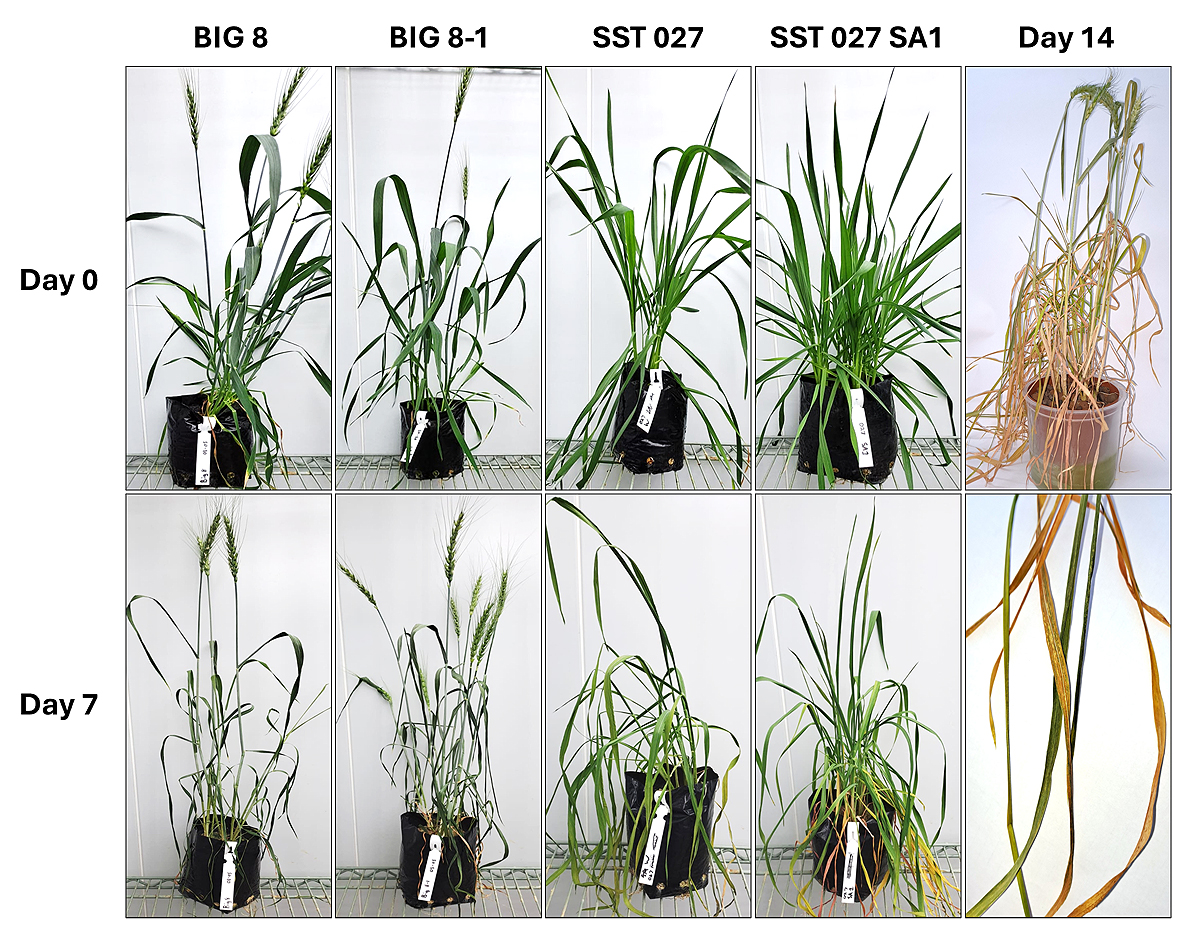 Figure 1. Representative images of selected wheat lines (BIG 8, BIG 8-1, SST 027, and SST 027 SA1) under well-watered conditions (Day 0), early water deficit stress (Day 7), and severe water deficit stress (Day 14). Progressive stress symptoms become increasingly evident with prolonged drought exposure, most prominently at Day 14, where pronounced leaf wilting, rolling, chlorosis, and senescence are observed.
Photosynthetic performance under water deficit stress was assessed by measuring the theoretical maximum efficiency of photosystem II (Fv/Fm) in leaf mesophyll cells (Figure 2). This parameter was used to evaluate the extent to which water deficit stress affected the integrity and functionality of the photosynthetic apparatus across parental wheat (BIG 8, SST 027, SST 887, SST 0147) lines and their respective mutant derivatives (Figure 2).
Two-way ANOVA revealed significant effects of drought duration (time), genotype, and genotype–time interaction on Fv/Fm values (p ≤ 0.05). Under well-watered conditions (day 0), several genotype-specific differences were observed. In the SST 027 group, the mutant lines SST 027 SA 1 and SST 027 EMS 2 exhibited significantly lower Fv/Fm values compared with the parental line (p ≤ 0.05), whereas SST 027 EMS 7 showed higher Fv/Fm relative to the parental line at day 7 (p ≤ 0.05). Within the SST 0147 group, both SST 0147 EMS 27 and SST 0147 EMS 28 displayed significantly higher Fv/Fm values than the parental line at day 0 (p ≤ 0.05), and SST 0147 EMS 28 maintained higher Fv/Fm at day 7 (p ≤ 0.05).
Despite these genotype-specific differences at early time points, all wheat lines exhibited a pronounced decline in Fv/Fm by day 14 of drought stress, consistent with severe impairment of photosynthetic activity and the onset of senescence. This convergence of Fv/Fm values at later stages indicates that prolonged water deficit stress imposed a dominant physiological constraint across all genotypes.
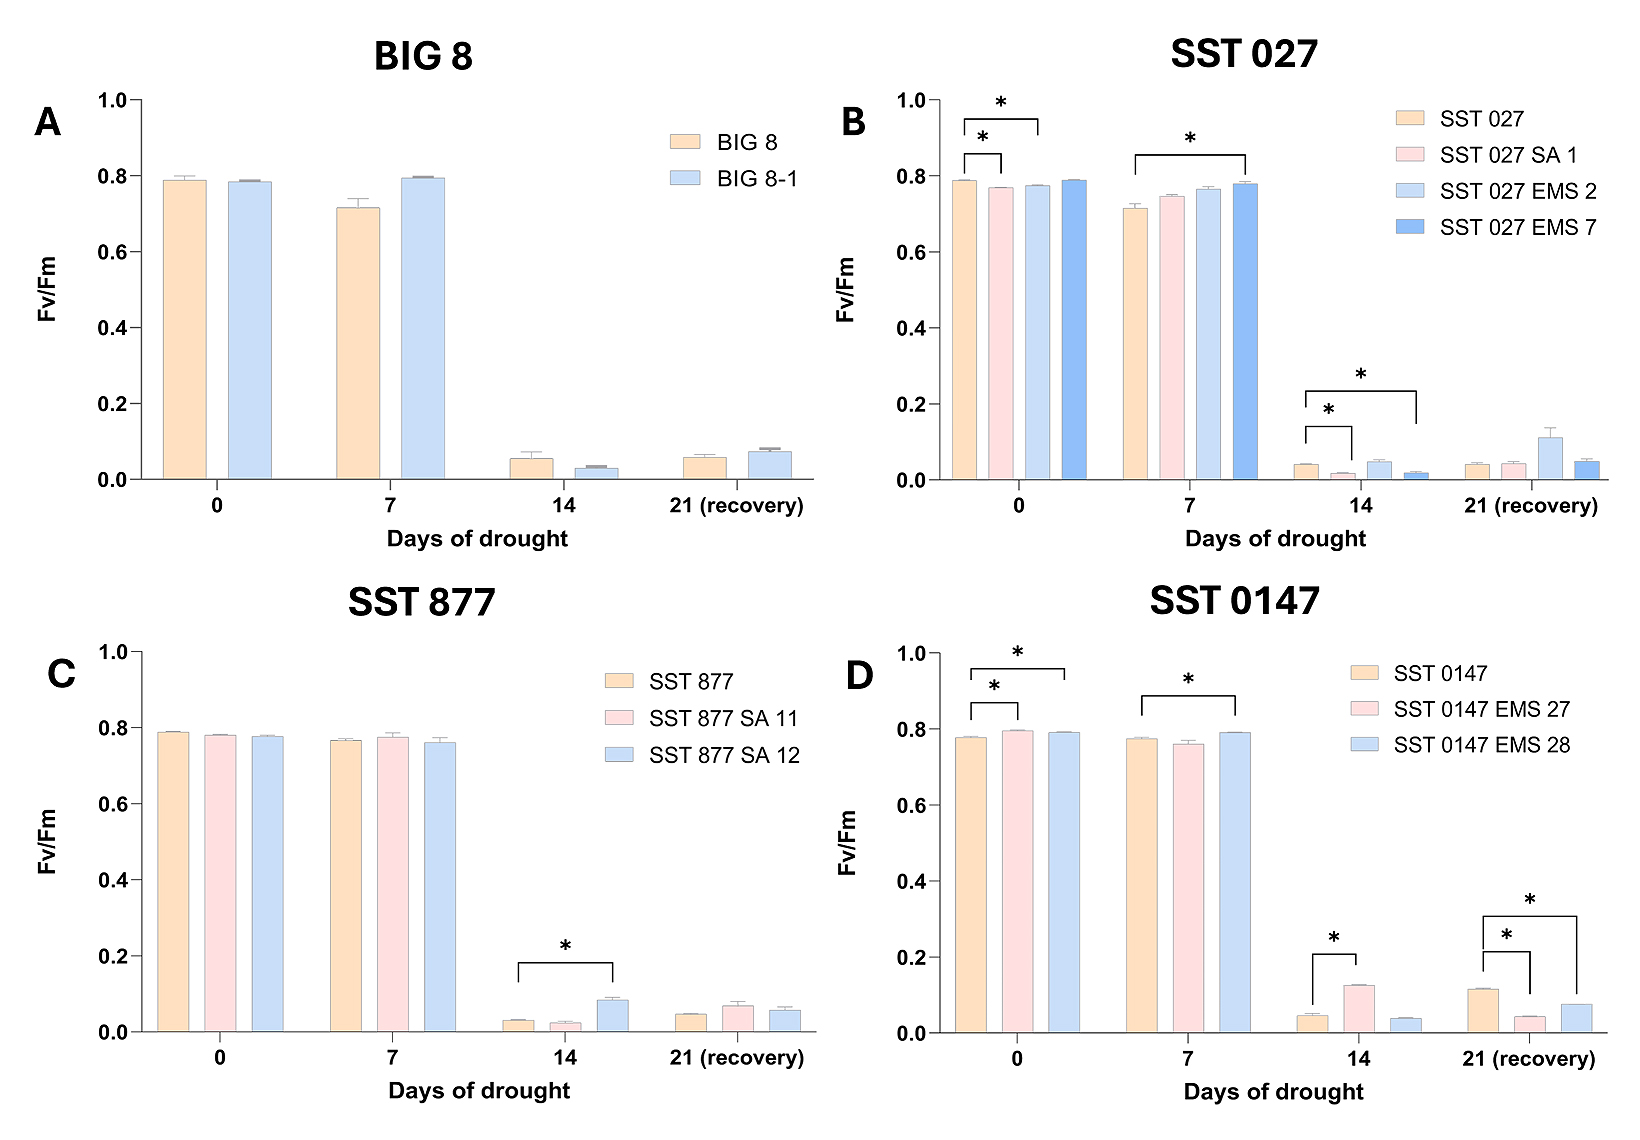 Figure 2. Theoretical photosynthetic efficiency (Fv/Fm) of the leaves of 12 selected BIG 8 and SST wheat lines under water deficit stress. Data points were measured at 7-day intervals during a drought trial beginning at day 0. Wheat lines are grouped according to parental lines and their derived mutant lines. Multiple comparison analysis was performed across grouped wheat lines at the different time points and significant differences (p-value ≤ 0.05) are denoted with a ‘*’. A–BIG 8 lines, B–SST 027 lines, C–SST 877 lines and D–SST 0147 lines.
To further investigate physiological responses associated with the observed decline in photosynthetic efficiency, stomatal conductance of water vapour (mmol/m2s) was measured throughout the drought trial as an indicator of stomatal regulation and potential transpiration capacity (Figure 3).
All wheat lines exhibited a rapid and significant reduction in stomatal conductance by day 7 of water deficit stress, after which conductance values remained low through day 14 and the recovery period (day 21). Two-way ANOVA indicated significant effects of drought duration (time), genotype, and genotype–time interaction (p ≤ 0.05).
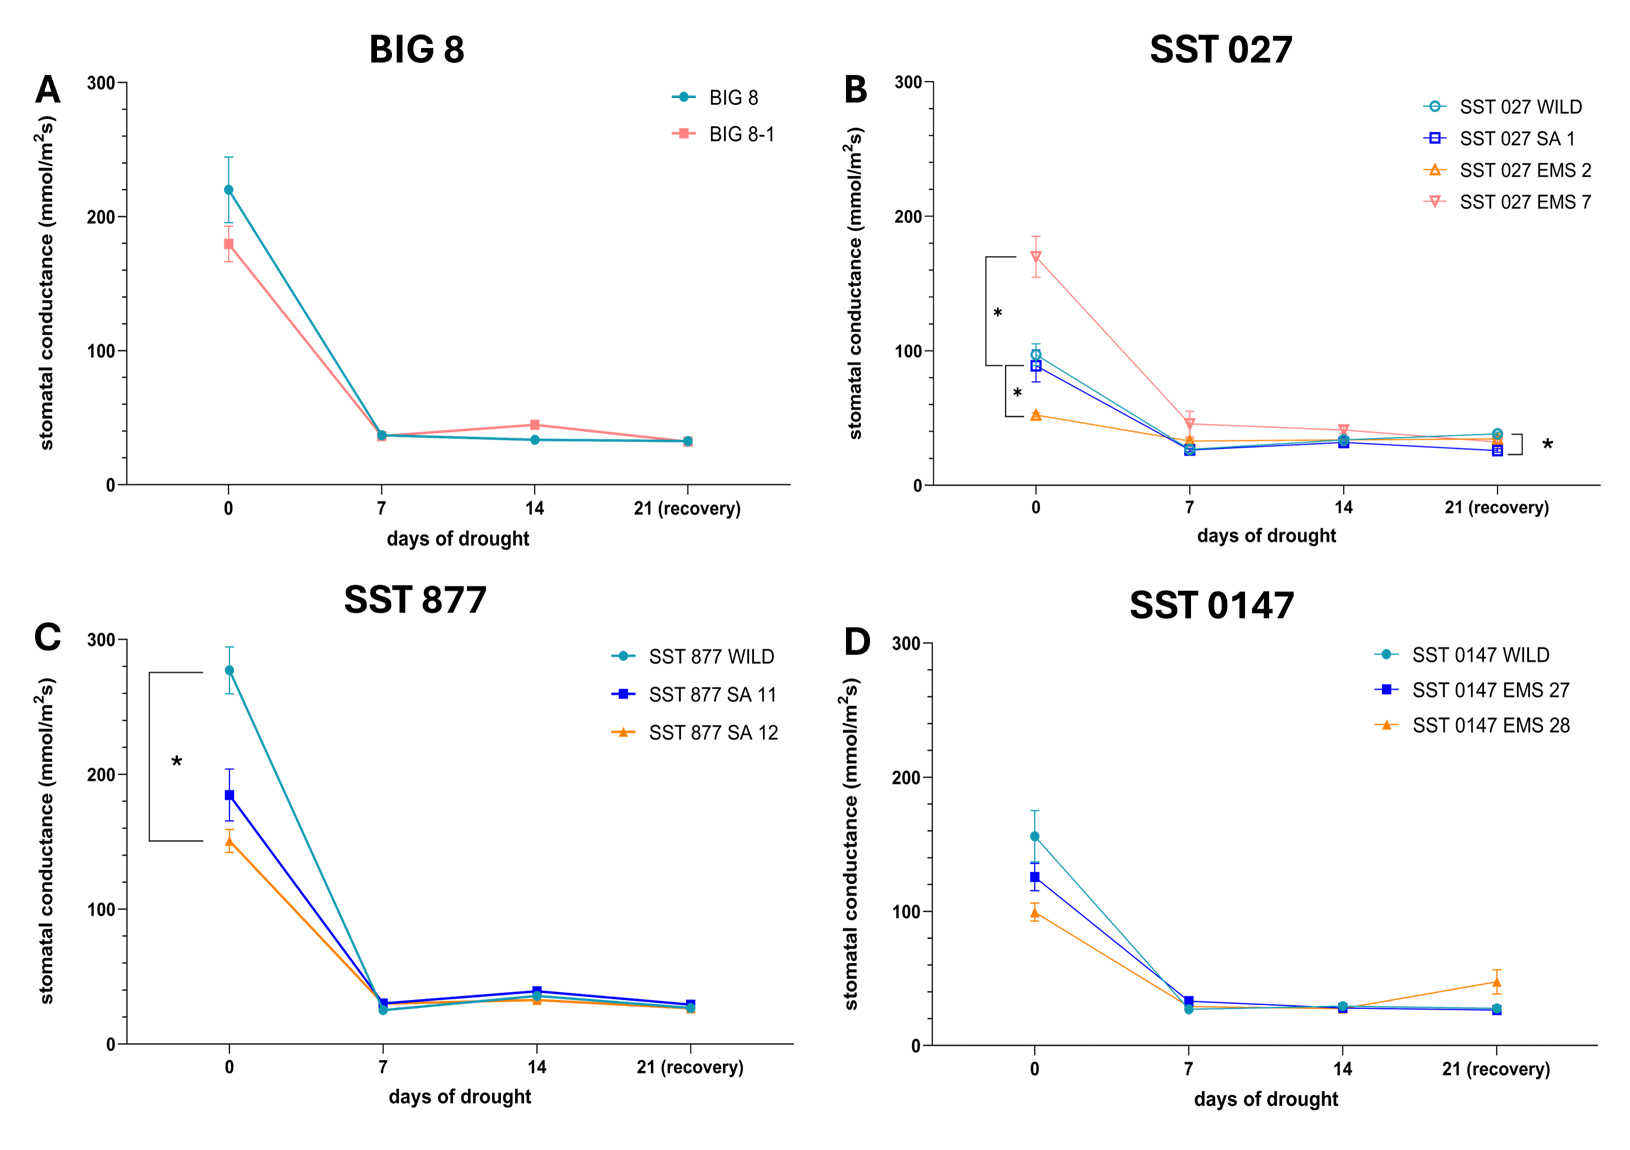 Figure 3. Stomatal conductance (mmol/m2s) of the leaves of 12 selected BIG and SST wheat lines under water deficit stress. Data points were measured at 7-day intervals during a drought trial beginning at day 0. Wheat lines are grouped according to parental lines and their derived mutant lines. Multiple comparison analysis was performed across grouped wheat lines at the different time points and significant differences (p-value ≤ 0.05) are denoted with a ‘*’ A–BIG 8 lines, B–SST 027 lines, C–SST 877 lines and D–SST 0147 lines.
Genotype-specific differences in stomatal conductance were primarily observed under well-watered conditions (day 0). Within the SST 027 group, SST 027 EMS 2 displayed significantly lower stomatal conductance than the parental line, whereas SST 027 EMS 7 exhibited higher conductance (p ≤ 0.05). SST 027 SA 1 showed significantly reduced stomatal conductance relative to the parental line at day 21 (p ≤ 0.05). In the SST 877 group, SST 877 SA 12 exhibited significantly lower stomatal conductance than the parental line at day 0 (p ≤ 0.05). No significant differences were detected between SST 0147 and its mutant derivatives across the drought trial. Similarly, no significant differences were observed between BIG 8 and BIG 8-1 at any time point.
The rapid and largely uniform decline in stomatal conductance across genotypes indicates a conserved stomatal closure response to water deficit stress. As stomatal density, aperture size, and epidermal anatomical parameters were not quantified in this study, direct mechanistic linkage between stomatal conductance differences and underlying cellular structure cannot be established. Given the convergence of stomatal conductance values under prolonged stress, subsequent cell morphology analyses were undertaken to determine whether structural cellular responses contributed to variation observed among genotypes under severe water deficit conditions.
Cell Morphology Ultrastructural ChangesBecause drought-driven reductions in photosynthetic efficiency and stomatal conductance reflect integrated whole-leaf function and do not localise the underlying tissue injury, confocal microscopy was used to assess whether water deficit stress was accompanied by spatially resolved changes in leaf tissue organisation, chloroplast-associated fluorescence, and cell wall structure within mesophyll cells (Figure 4; Figure S1). Chlorophyll fluorescence (green, 591 nm) was used as an indicator of mesophyll and chloroplast integrity, Propidium Iodide (red, 610 nm) highlighted cell walls, and Calcofluor White (blue, 443 nm) counterstained cellulose.
Under well-watered conditions (day 0), all wheat lines exhibited intact tissue architecture, characterised by well-defined cell walls, strong chlorophyll fluorescence, and uniform cellulose staining (Figure 4, day 0). By day 7 of water deficit stress, early ultrastructural changes were evident across wheat lines, including reduced chlorophyll fluorescence, cell compression, and partial disruption of chloroplast structure. While these changes were observed in all genotypes, BIG 8 and BIG 8-1 maintained comparatively more intact tissue organisation at this stage, with SST 027 displaying ultrastructural features most similar to the BIG 8 material (Figure 4, day 7).
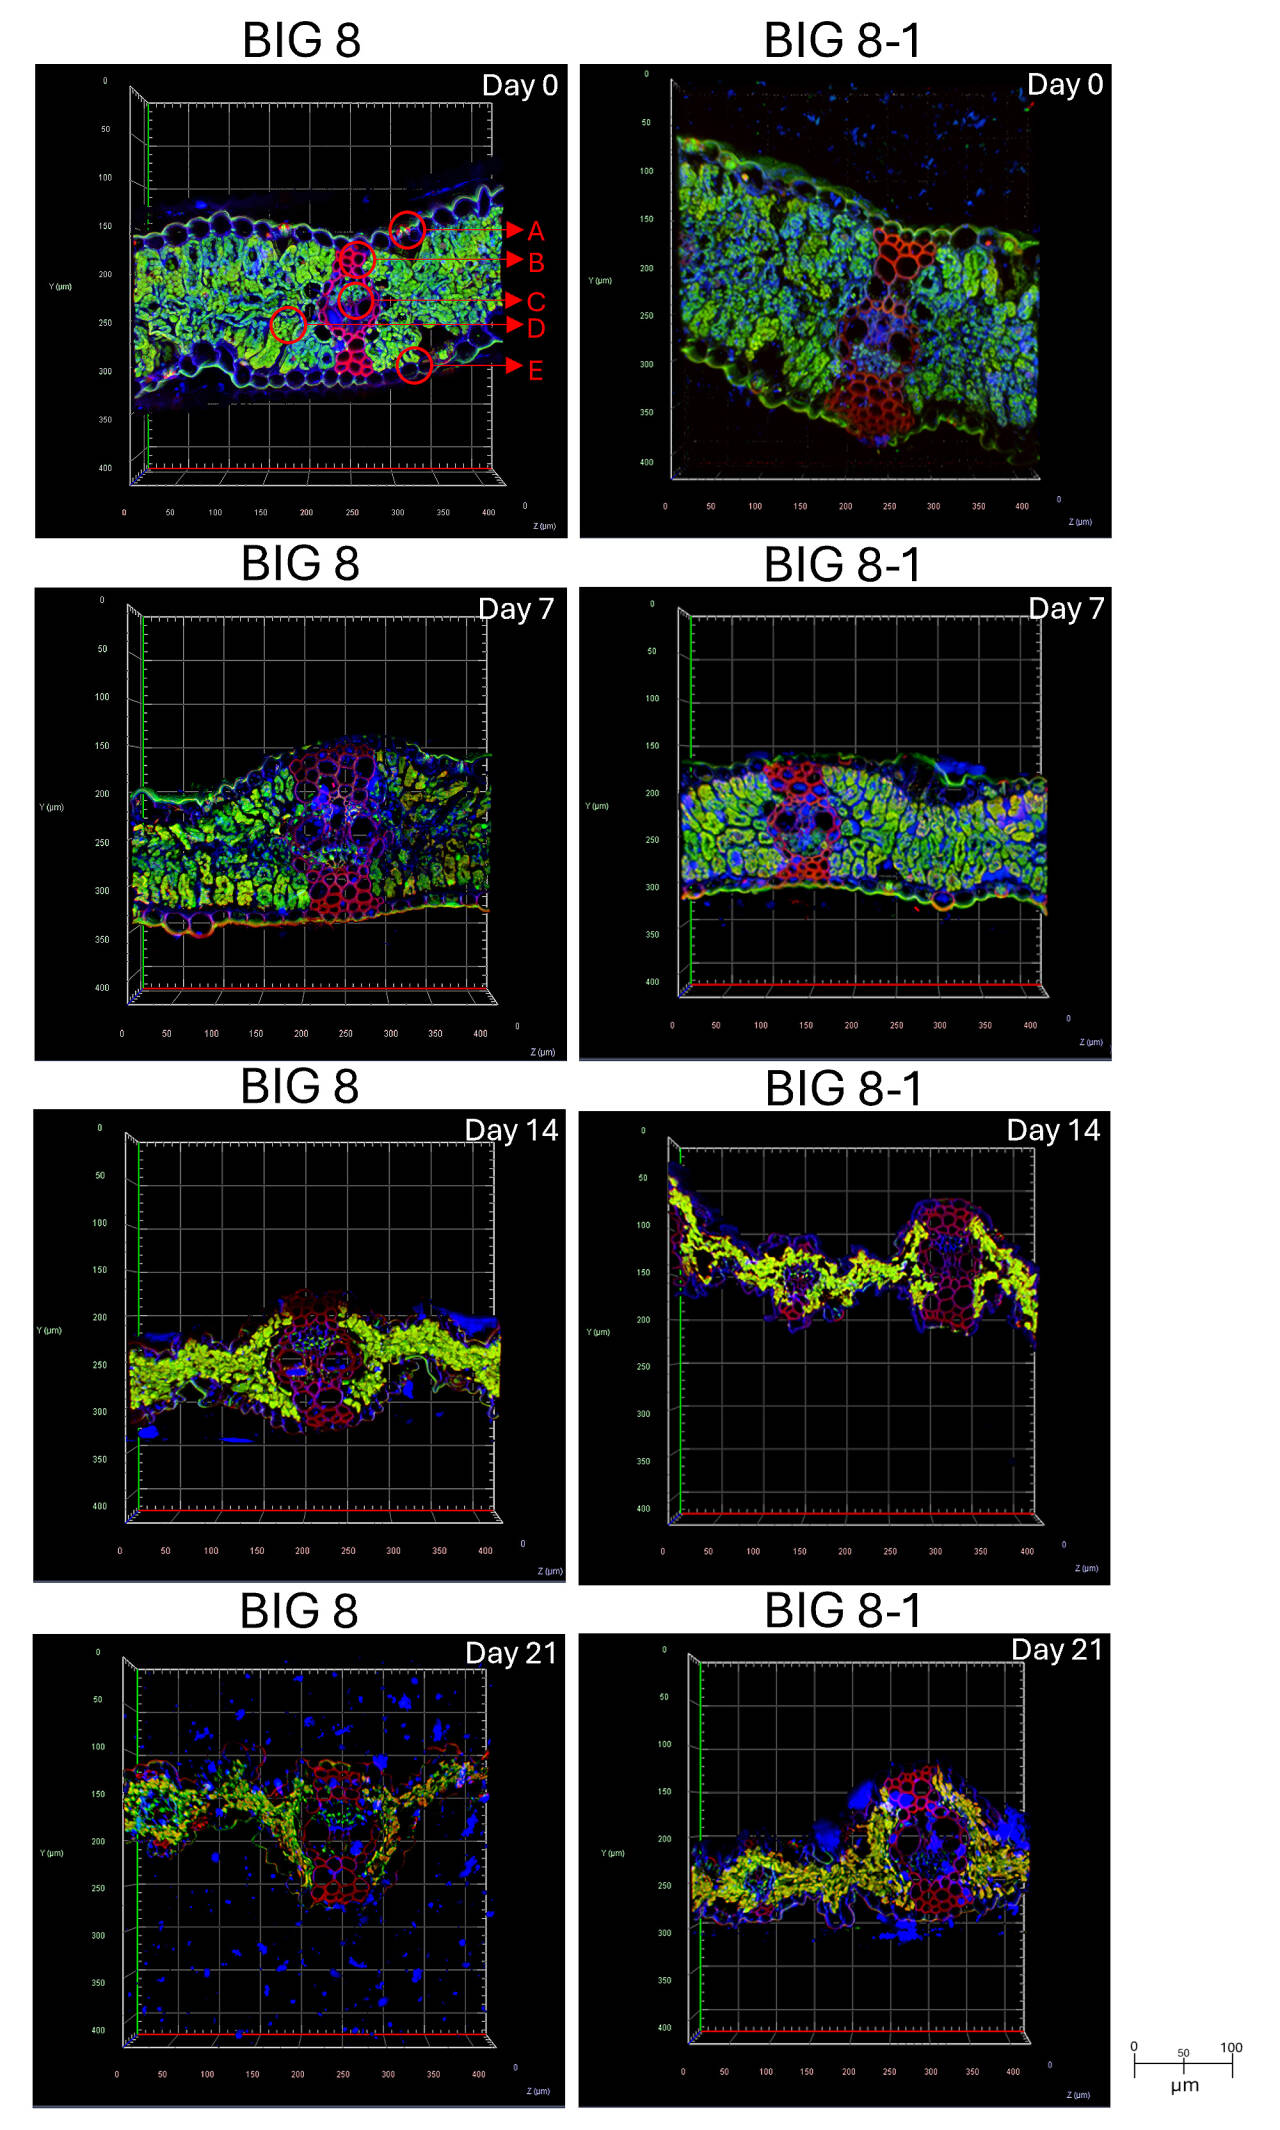 Figure 4. Confocal microscopy images of FFA treated BIG 8 wheat leaf cross-sections under water deficit stress. Images were generated at 20× objective magnification utilizing captured light emissions of 591 nm, 610 nm and 443 nm; visualizing the fluoresces of chlorophyll (green), propidium iodide (red) and calcofluor white (blue) respectively. Images were captured at days 0, 7, 14, and 21 of a drought trial. In Big 8 Day 0: A–Stomatal opening and guard cells. B–Vascular bundle. C–Phloem cells. D–Spongy mesophyll cells. E–Epidermal cells.
By day 14, prolonged water deficit stress resulted in severe ultrastructural disruption across all wheat lines, including extensive tissue deformation, pronounced chloroplast degradation, loss of chlorophyll fluorescence, and disorganization of cell walls. At this stage, ultrastructural differences between genotypes were less distinct, reflecting convergence of cellular damage under severe stress conditions (Figure S1, day 14). Following rehydration (days 15–21), minimal recovery was observed in any wheat line; chlorophyll fluorescence remained low and structural damage to cell walls persisted, indicating largely irreversible cellular injury (Figure 4, day 21).
To quantitatively assess whether the ultrastructural changes observed by confocal microscopy, particularly cell compression and tissue deformation, were accompanied by measurable alterations in cellular size, average spongy mesophyll cell volume (µm³) was calculated.
Change in Cell VolumeTo quantitatively assess whether the ultrastructural changes observed by confocal microscopy were accompanied by measurable alterations in cellular size, average spongy mesophyll cell volume (µm³) was calculated from measured average cell area (µm²) for each wheat line across the drought trial (Figure 5). Statistical comparisons were performed between parental lines and their respective mutant derivatives over time.
Two-way ANOVA revealed that drought duration (time) and genotype–time interaction had significant effects on cell volume (p ≤ 0.05), whereas genotype alone was not a significant factor. Multiple comparison tests indicated no significant differences between parental lines and their corresponding mutants at individual time points during the drought trial. Across all wheat lines, cell volume decreased progressively from day 0 to day 14, reflecting increasing cellular dehydration as water deficit stress intensified. Several wheat lines exhibited significant reductions in cell volume over time (p ≤ 0.05) (Figure 5).
These quantitative reductions in cell volume are consistent with the ultrastructural observations of cell compression, tissue deformation, and loss of turgor visualised by confocal microscopy, indicating that drought-induced cellular shrinkage represents a common structural response across genotypes rather than a genotype-specific trait.
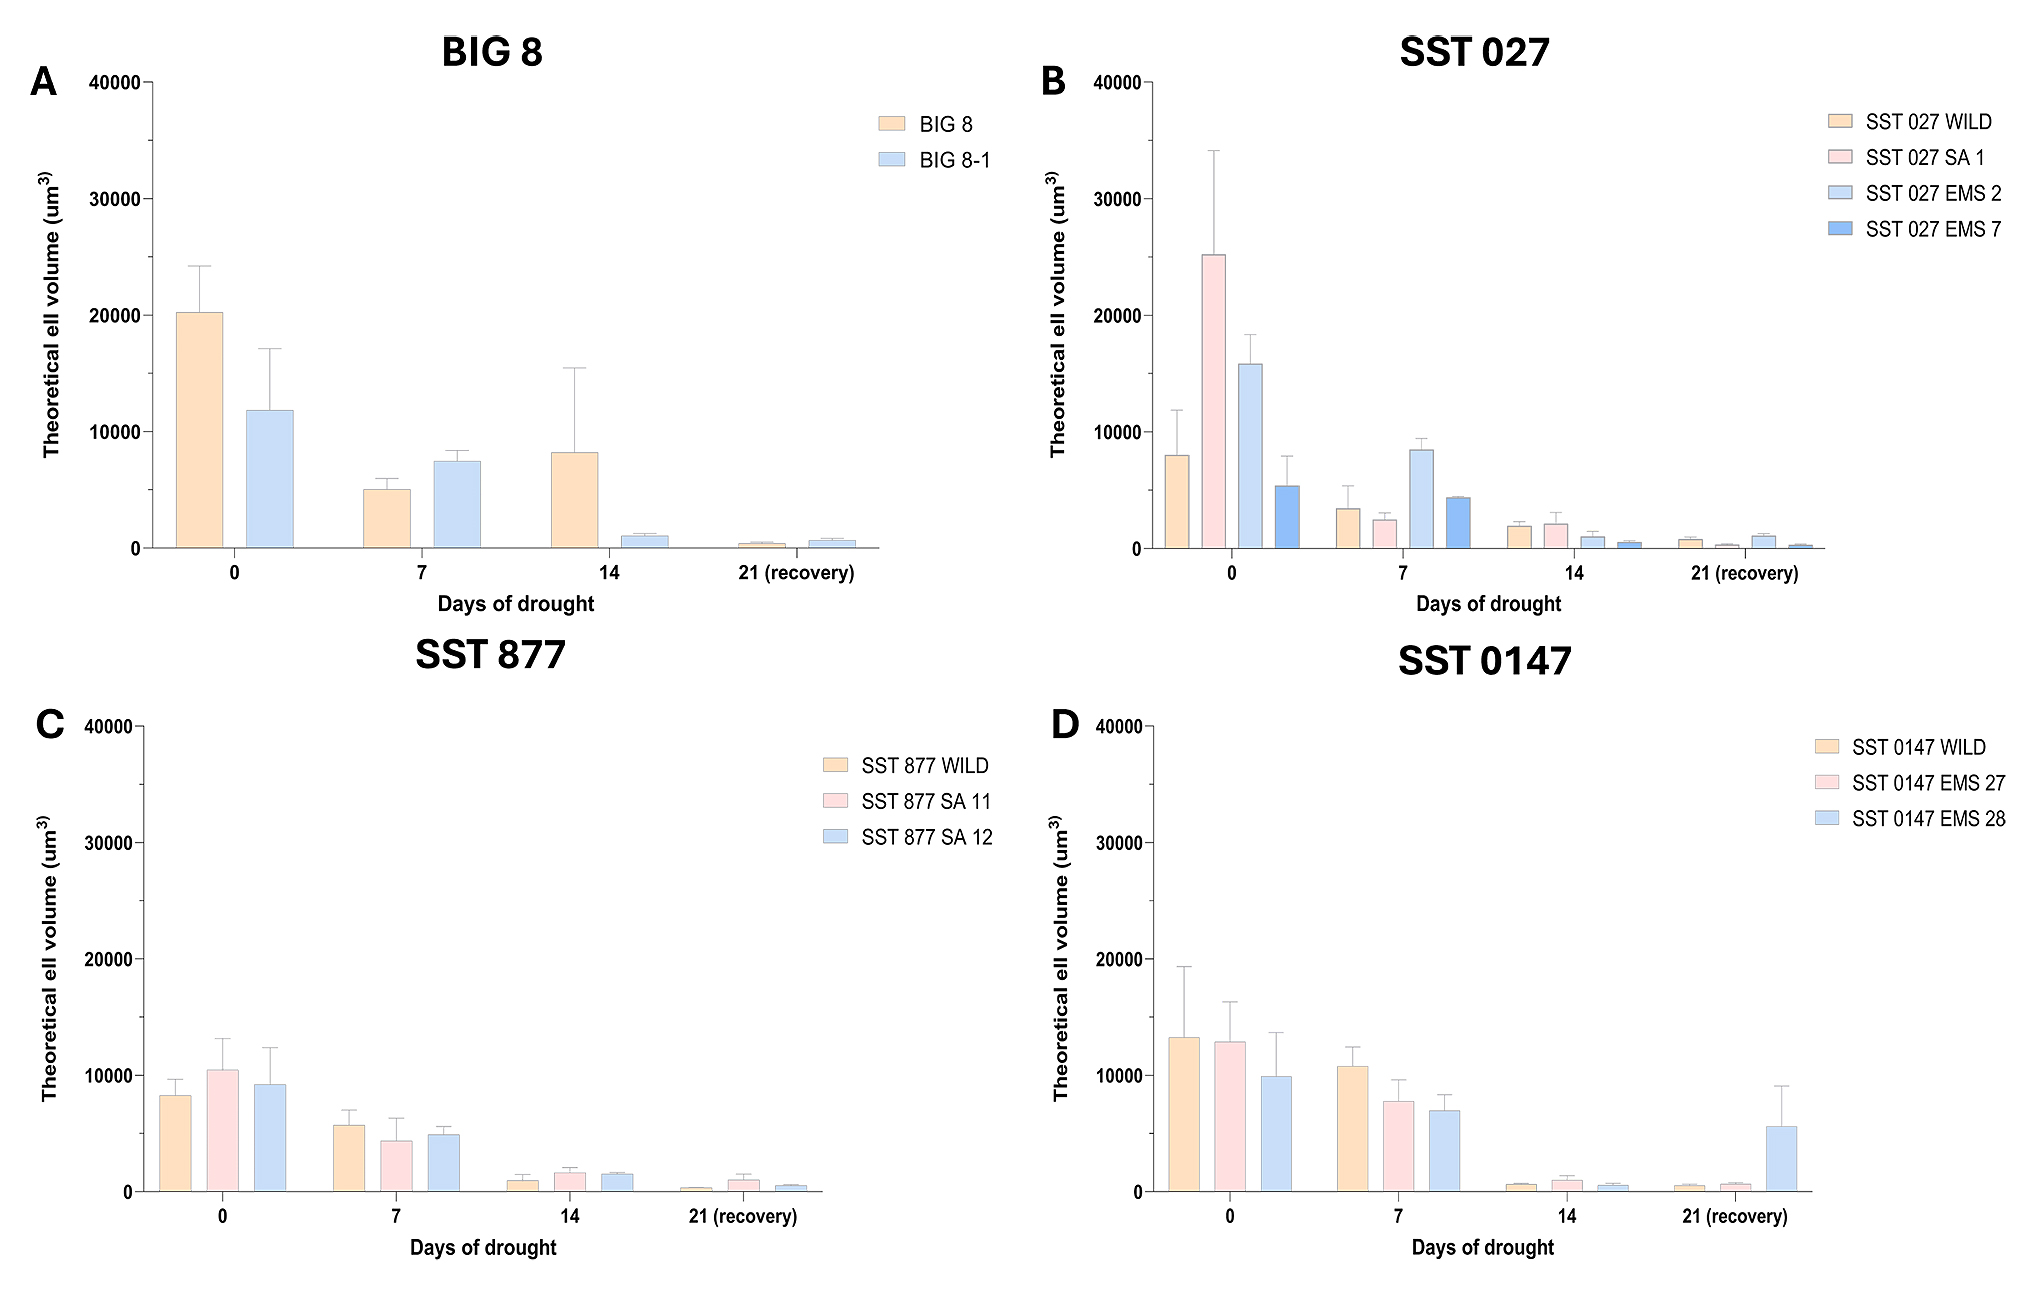 Figure 5. Theoretical cell volume (µm3) of wheat leaf spongey mesophyll cells of the 12 selected BIG and SST wheat lines under water deficit stress. Data points were measured at 7-day intervals during a drought trial beginning at day 0. Wheat lines are grouped according to parental lines and their derived mutant lines. Multiple comparison analysis was performed within wheat lines across time points and significant differences (p-value ≤ 0.05) are denoted with a ‘*’. A–BIG 8 lines, B–SST 027 lines, C–SST 877 lines and D–SST 0147 lines.
The results from the physio-morphological and cell morphology assessments were integrated using principal component analysis (PCA) to compare all twelve selected wheat lines (Figure 6, Figure S5). The analysis included average leaf width (cm), average leaf length (cm), average plant height (cm), photosynthetic efficiency (Fv/Fm), stomatal conductance of water vapour (mmol/m2s), spongy mesophyll cell volume (µm³), and mean fluorescence intensities of chlorophyll, Propidium Iodide, and Calcofluor White measured within leaf mesophyll cells. Separate scree plots, PCA plots, and biplots were generated for each sampling time point (Figures S2–S5). The first two principal components explained 69.3%, 56.2%, 51.9%, and 66.4% of the total variance at days 0, 7, 14, and 21, respectively.
Under well-watered conditions (day 0), PCA revealed partial separation between parental wheat lines and their corresponding mutant derivatives. Parental lines BIG 8, SST 877, and SST 027 occupied regions of the ordination space associated with higher values for photosynthetic efficiency and morphological traits, whereas SST 0147 clustered closer to its mutant derivatives, indicating comparatively reduced contribution of these variables under control conditions. Among mutant lines, BIG 8-1, SST 027 EMS7, and SST 877 SA11 occupied regions overlapping with their respective parental lines, reflecting similar multivariate trait combinations at day 0.
Under early water-deficit stress (day 7), increased dispersion of wheat lines was observed across the PCA space. Parental lines BIG 8, SST 0147, and SST 877 remained associated with vectors related to photosynthetic efficiency and cellular traits, while SST 027 shifted toward regions associated with reduced physiological contributions. Mutant derivatives BIG 8-1 and SST 0147 EMS28 occupied positions closer to their parental backgrounds, whereas SST 027 EMS7 and SST 027 EMS2 separated along distinct axes, indicating genotype-specific multivariate responses to early drought stress. SST 0147 EMS27 showed minimal displacement relative to its control position, suggesting limited early response in the integrated trait space.
Under severe water-deficit stress (day 14), most wheat lines clustered near the origin of the PCA space, indicating reduced multivariate separation under prolonged drought conditions (Figure 6). Parental lines BIG 8 and SST 027, together with mutant lines BIG 8-1 and SST 027 SA1, remained separated from the central cluster. At this stage, separation among genotypes was driven primarily by cellular and fluorescence-related variables, including mesophyll cell volume and chlorophyll-associated fluorescence intensities, while whole-plant physiological traits such as stomatal conductance and plant height contributed less to overall variance.
Under early recovery conditions (day 21), PCA revealed renewed dispersion of wheat lines, with parental lines and their mutant derivatives forming partially overlapping clusters. SST 0147 EMS28 was positioned distinctly from both its parental line and other genotypes, indicating a divergent multivariate profile during recovery relative to the drought-stressed state.
Overall, PCA analysis demonstrates that genotype-associated variation is most pronounced under well-watered and early stress conditions, while severe drought stress results in convergence of integrated physio-morphological and cellular traits across wheat lines, followed by partial re-diversification during recovery.
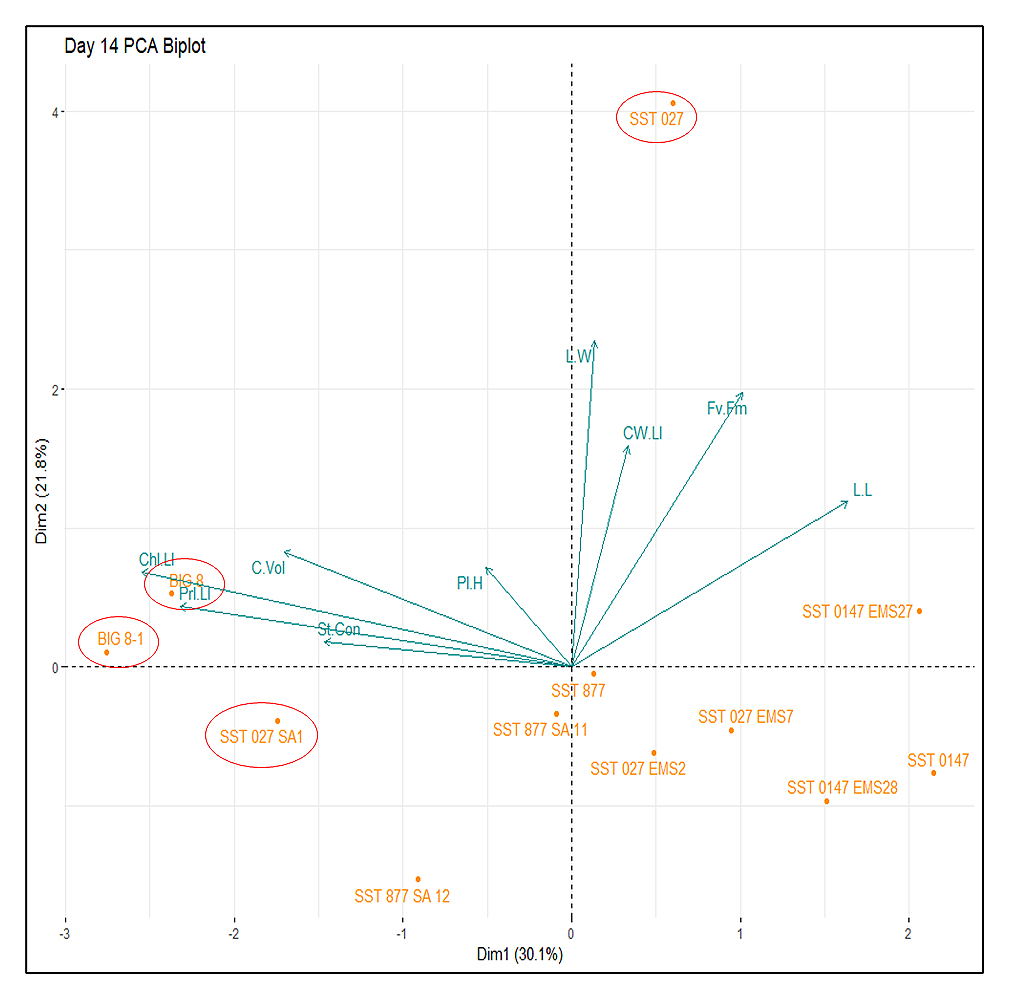 Figure 6. Principal component analysis (PCA) biplot of several plant physiological variables measured across several wheat lines under severe water-deficit stress induced by a 14-day drought trial. Variables: Fv/Fm–Theoretical efficiency of photosystem II, St.Con–Stomatal conductance of water vapor (mmol/m2s), C.Vol–theoretical volume of leaf mesophyll cells (µm3), Chl.LI–mean light intensity of chlorophyll measured within leaf mesophyll cells, CW.LI–mean light intensity of Calcofluor White measured within leaf mesophyll cells, PI.LI–mean light intensity of Propidium Iodide measured within leaf mesophyll cells, L.L–Length of flag leaf (cm), L.W–Width of flag leaf (cm), Pl.H–Plant height (cm). Significant outlier wheat lines from the primary cluster are circled in red.
The Serpin-Z2B gene was amplified and sequenced from all twelve wheat lines using PCR and Sanger sequencing to confirm gene identity and sequence conservation prior to expression analysis (Figure S6). Sequence alignments were compared among all wheat lines and against the Serpin-Z2B reference sequence (GenBank accession Y11486.1) (Figures S6 and S8). No sequence polymorphisms were detected within the amplified Serpin-Z2B coding region that would be predicted to alter transcriptional output or protein sequence. Based on this confirmed sequence conservation, primers were designed for downstream RT-qPCR and sqPCR analyses of Serpin-Z2B expression.
Gene Expression AnalysisAs described in the Materials and Methods, four wheat lines were selected for targeted Serpin-Z2B expression analysis: the parental lines BIG 8 and SST 027, and their respective mutant derivatives BIG 8-1 and SST 027 SA1 (Figure 6). These lines were selected to represent contrasting multivariate response profiles under early drought stress rather than to infer relative drought tolerance. Gene expression was assessed under control conditions (day 0) and early water deficit stress (day 7) using RT-qPCR and sqPCR (Figures 7), with normalization against the reference genes 18S and GAPDH.
RT-qPCR analysis revealed significant effects of genotype and genotype–time interaction on Serpin-Z2B expression when normalized against 18S, and significant effects of genotype, time, and genotype–time interaction when normalized against GAPDH (two-way ANOVA, p ≤ 0.05). Under control conditions (day 0), no significant differences in Serpin-Z2B expression were detected between parental lines and their corresponding mutant derivatives. Under early drought stress (day 7), both SST 027 and SST 027 SA1 exhibited significant upregulation of Serpin-Z2B expression relative to their control levels (p ≤ 0.05), with SST 027 SA1 showing significantly higher expression than SST 027 when normalized against GAPDH (p ≤ 0.05).
In contrast, BIG 8 displayed reduced Serpin-Z2B expression under drought stress, while its mutant derivative BIG 8-1 showed a significant upregulation relative to the parental line (p ≤ 0.05). Notably, SST 027 SA1 maintained elevated Serpin-Z2B expression across both control and drought conditions compared with SST 027, indicating a consistent genotype-associated difference in expression magnitude. The relative magnitude of Serpin-Z2B upregulation in SST 027 SA1 differed when normalized against 18S compared with GAPDH, indicating that expression estimates were influenced by reference gene normalization while overall stress-induced upregulation remained evident.
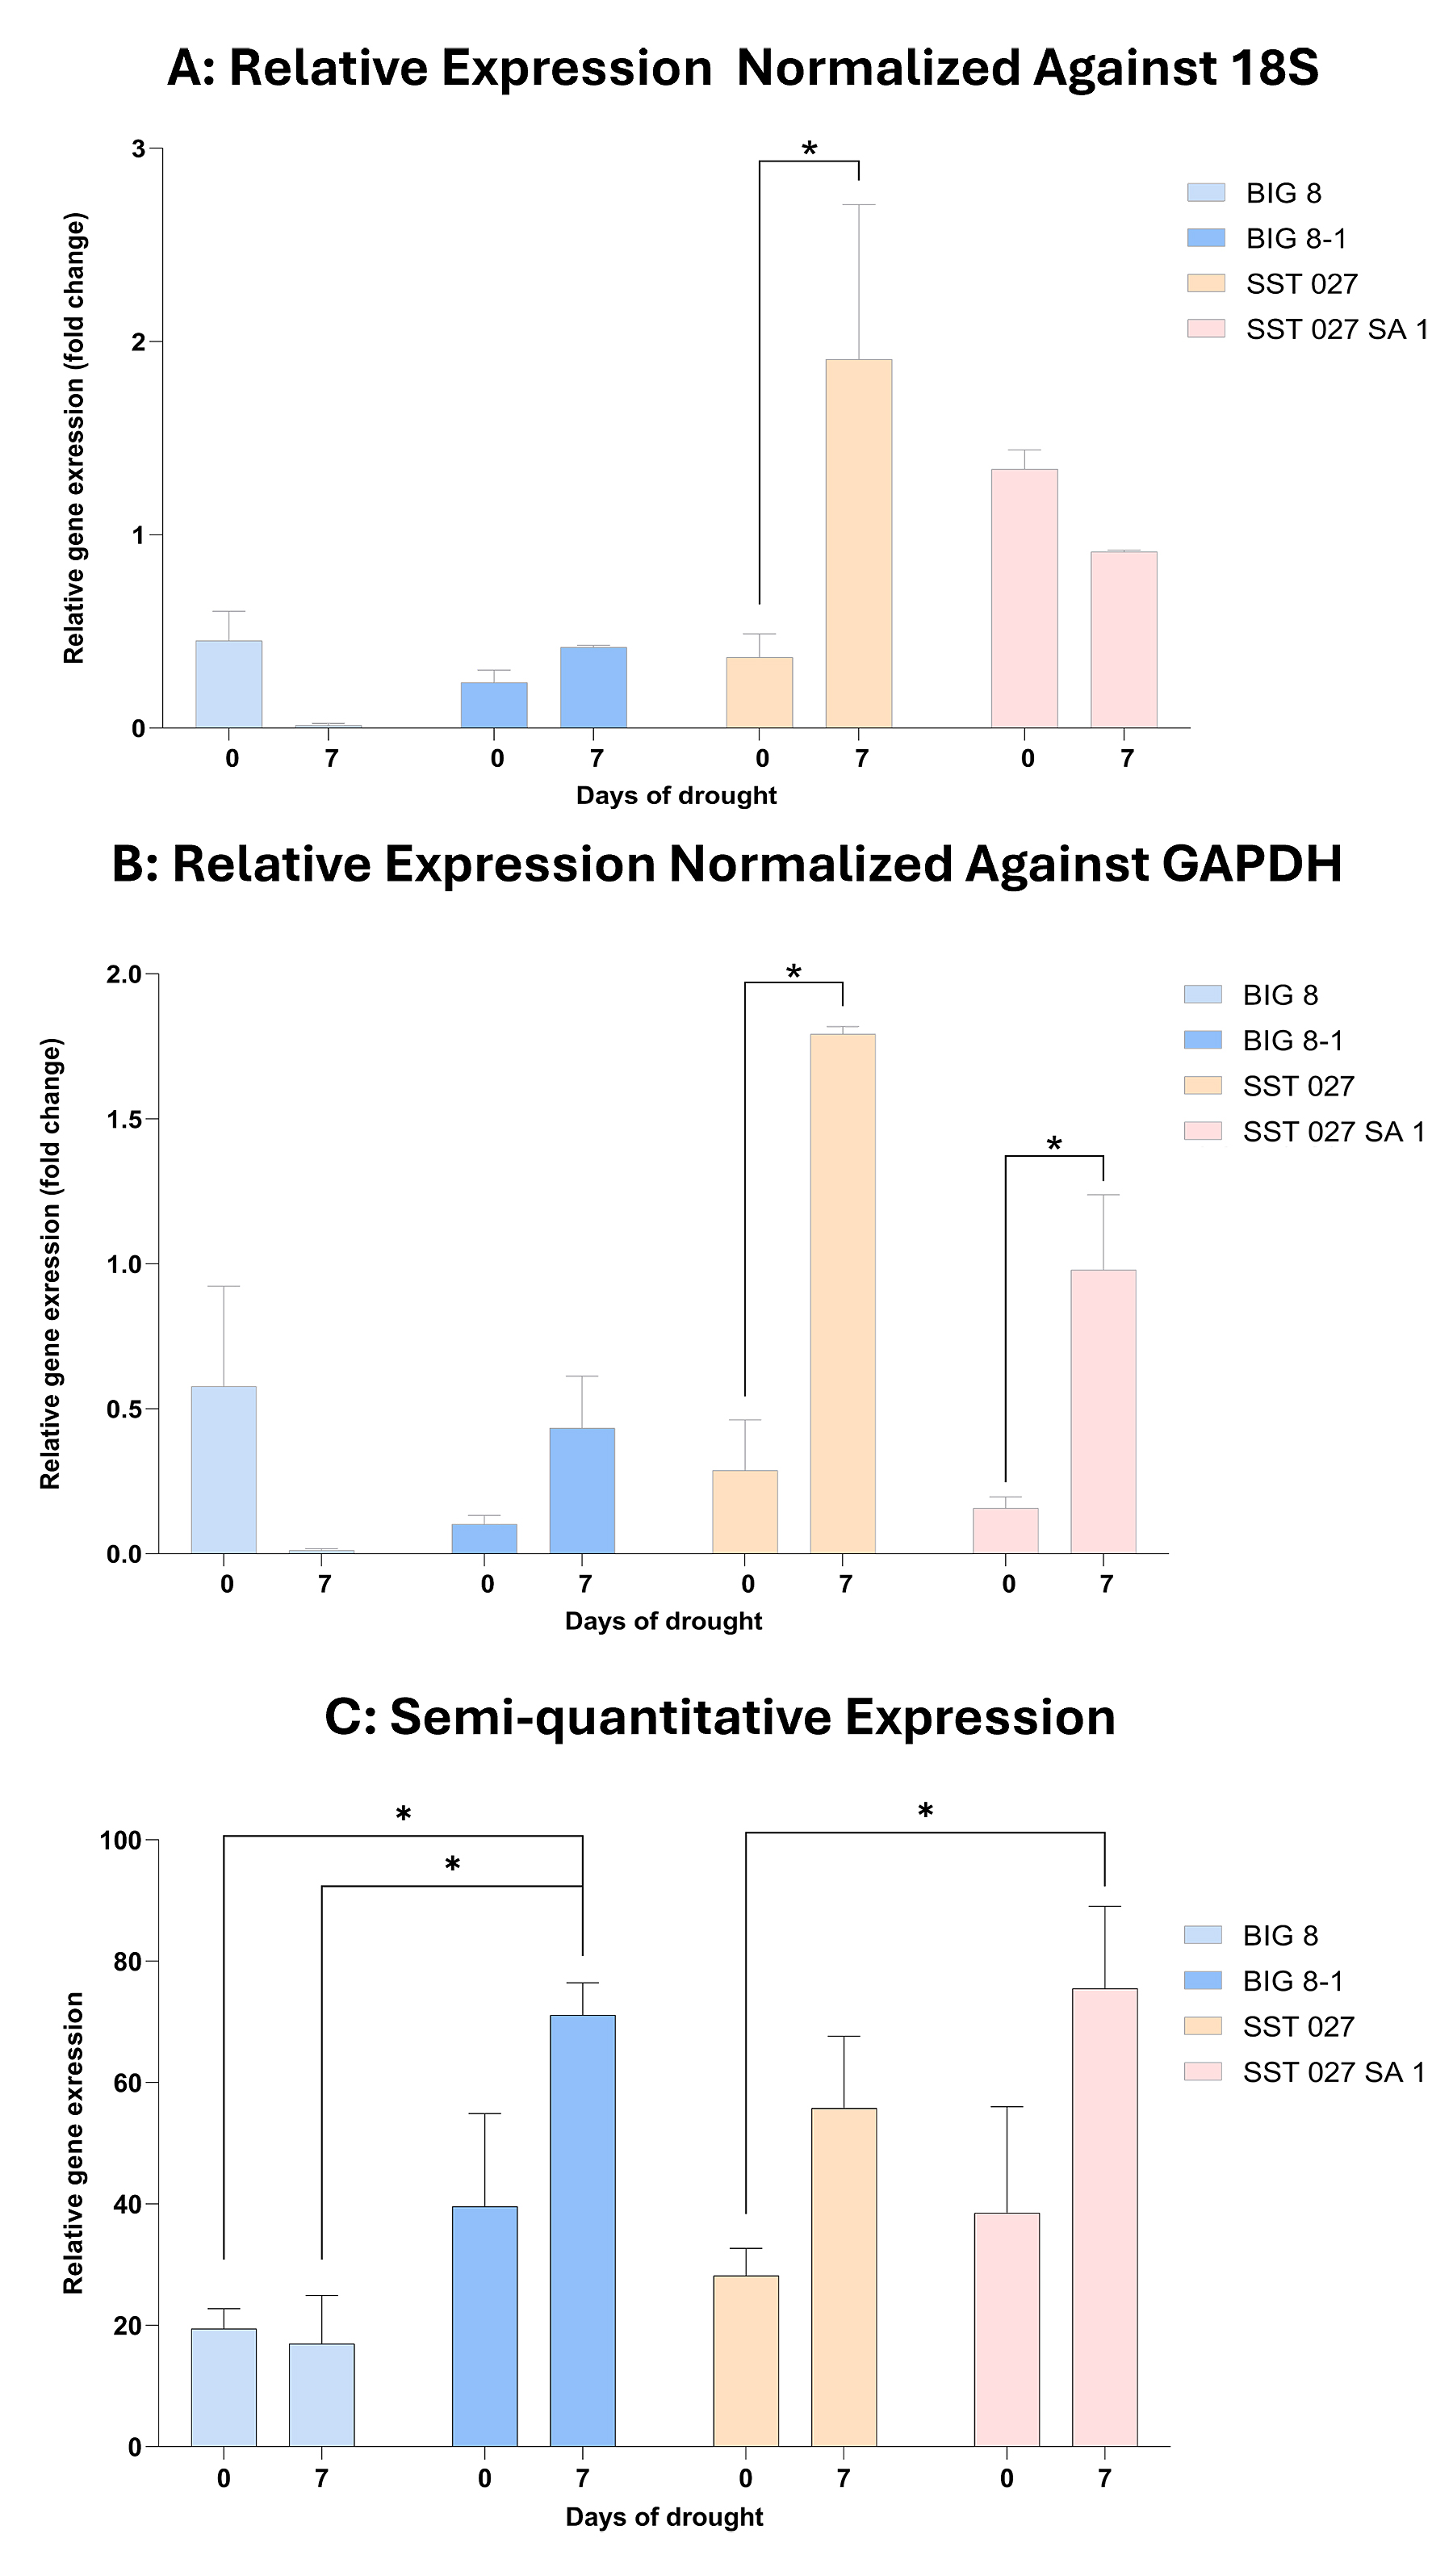 Figure 7. Relative (RT-qPCR) and semi-quantitative Serpin-Z2B gene expression in the leaves of the BIG 8, BIG 8-1, SST 027 and SST 027 SA 1 wheat lines under water deficit stress. Data points were measured at day 0 and day 7 of a drought trial. Multiple comparison analysis was performed within wheat lines at different time points and significant differences (p-value ≤ 0.05) are denoted with a ‘*’. Relative Serpin-Z2B gene expression is normalized against the reference genes 18S (A) and GAPDH (B). Semi-quantitative Serpin-Z2B gene expression is normalized against the reference gene 18S (C).
Semi-quantitative PCR analysis supported the RT-qPCR findings. In the BIG 8 pair, significant genotype and genotype–time effects were detected (p ≤ 0.05), with BIG 8-1 showing increased Serpin-Z2B expression under drought stress relative to BIG 8. In the SST 027 pair, time had a significant effect on Serpin-Z2B expression (p ≤ 0.05), with both genotypes showing stress-induced upregulation.
Overall, Serpin-Z2B expression varied across genotypes and sampling time points, with differential transcriptional responses observed between parental lines and their mutant derivatives under early water deficit stress. Under well-watered conditions, expression levels were comparable between most parental and mutant backgrounds. Following drought exposure, shifts in relative expression patterns became evident, resulting in altered expression hierarchies between parental lines and their corresponding derivatives. Across both RT-qPCR and semi-quantitative PCR analyses, these stress-induced expression differences were consistently detected, indicating genotype-specific transcriptional responses to water deficit stress.
Drought tolerance in wheat is a complex, multigenic trait that emerges from coordinated regulation of physiological, cellular, and molecular processes rather than from single gene effects. Consequently, identifying individual genetic contributors to drought adaptation remains challenging, particularly when phenotypic differences are subtle or context dependent [36–38]. In the present study, we adopted an integrative framework combining physio-morphological measurements, cellular imaging, multivariate analysis, and targeted gene expression assessment across commercial and chemically induced mutant wheat lines. The primary objective was not to establish mechanistic gene function, but to evaluate whether previously reported Serpin-Z2B upregulation [16] could be reproducibly associated with drought responsive phenotypes across multiple genetic backgrounds under controlled water deficit stress.
Interpretation of Physiological ResponsesInitial phenotypic characterization of the twelve SST and BIG 8 wheat lines revealed minor differences in plant height and average leaf length (Table 2). BIG 8 backgrounds were generally taller with smaller leaves relative to SST lines. Although some parental SST lines showed non-significant trends toward increased height compared to their respective mutants, elevated standard deviations among biological replicates limited statistical sensitivity [39]. Such variability likely reflects natural differences in seed germination timing and developmental progression, a known constraint in drought phenotyping studies [40,41].
Leaf size and plant stature are frequently discussed in relation to drought adaptation [42]. Reduced leaf area can limit transpiration surface exposure and improve heat dissipation, potentially contributing to improved performance under water limitation [43,44]. Conversely, reduced leaf size may constrain photosynthetic capacity and yield, reflecting a functional trade off [45]. Similarly, dwarfism has been associated with improved drought tolerance in wheat [46], although genotype and environmental context strongly influence this relationship. In the present study, however, these morphological traits alone were insufficient to clearly discriminate drought response profiles among lines.
Photosynthetic efficiency represents a central indicator of plant performance under abiotic stress [40,47]. The photosynthetic pathway is highly sensitive to disruption by water deficit stress, and maintenance of photosystem integrity has been linked to improved drought resilience [48–50]. Measurement of Fv/Fm (Figure 2) revealed only minor baseline differences under well-watered conditions. Under prolonged stress, however, all lines exhibited a significant decline in photosynthetic capacity by day 14, consistent with previous findings [16]. By days 14 and 21, severe leaf rolling, senescence, and tissue collapse limited accurate quantification and precluded fine scale discrimination among genotypes (Figure 1). Importantly, this collapse was uniform across backgrounds, indicating that under severe stress the dominant physiological signal was systemic decline rather than genotype specific divergence.
Water regulation dynamics were further assessed through stomatal conductance measurements on sub flag leaves at uniform chronological age (Figure 3). Although sampling was standardized, minor developmental differences were observed, with BIG 8 and BIG 8-1 progressing more rapidly toward reproductive transition relative to SST backgrounds. Because developmental stage influences stomatal conductance [51,52], absolute values may partially reflect leaf ontogeny. Despite this, stomatal conductance declined significantly across all genotypes by day 7 (p ≤ 0.05), and no sustained genotype separation was maintained under prolonged stress. Stomatal closure is a well-established drought response that reduces water vapor diffusion while restricting carbon assimilation [53]. The uniform decline observed here suggests that water deficit imposed a dominant regulatory effect that superseded baseline developmental heterogeneity.
Integration of Cellular ObservationsCellular imaging provided structural context to these physiological responses. Confocal microscopy revealed (Figure 4, Figure S1) significant reductions in mesophyll cell volume (Figure 5) over time (p ≤ 0.05), reflecting progressive cellular dehydration. Loss of turgor pressure and disruption of osmotic gradients are known consequences of water deficit stress and contribute to tissue degradation and senescence [43,54,55]. Severe degradation of chlorophyll integrity within spongy mesophyll tissue paralleled the decline in Fv/Fm, reinforcing the coupling between structural integrity and photosynthetic performance. Although stomatal conductance and cellular dehydration are functionally linked within whole plant water relations, the present dataset remains correlative. Stomatal density, aperture size, and hydraulic parameters were not directly quantified. The parallel decline in stomatal conductance and cell volume therefore reflects coordinated systemic water limitation rather than evidence of genotype specific divergence in water use efficiency. Importantly, no genotype demonstrated clear maintenance of cellular water status under severe stress. Taken together, the physiological and cellular data indicate a broadly shared trajectory of declining performance under progressive water deficit, with limited resolution to define definitive drought tolerant outliers using single parameter analysis.
Multivariate IntegrationTo improve discriminatory power across a multifaceted trait such as drought response, principal component analysis was performed (Figure 6, Figure S2–S5) [34]. PCA integrates phenotypic, physiological, and cellular variables into composite axes that capture the dominant sources of variance within the dataset and have been widely applied in wheat breeding contexts to evaluate complex stress-related traits [35]. In the present study, variables incorporated into the analysis included morphological measurements (Table 2), stomatal conductance (Figure 3), photosynthetic efficiency (Figure 2), and mesophyll cell volume (Figure 5), thereby allowing assessment of coordinated trait behavior rather than isolated parameters.
Under well-watered conditions (day 0) and early water deficit stress (day 7), genotypes were dispersed across the PCA space without clear directional clustering, indicating that baseline trait variation and early stress responses were not sufficient to produce distinct multivariate grouping (Figure S5). By day 14, corresponding to severe water deficit stress, most lines converged toward the origin of the PCA biplot (Figure 6). This convergence reflects a reduction in overall variance among integrated traits and is consistent with the uniform physiological decline observed in photosynthetic efficiency, stomatal conductance, and cellular integrity across genotypes. In other words, prolonged stress imposed a dominant constraint that diminished multivariate separation.
A subset of lines remained positioned away from the central cluster under severe stress. This spatial separation reflects maintenance of distinct multivariate trait profiles relative to the collapsing majority. However, given the absence of sustained superiority in individual physiological parameters, this divergence should be interpreted cautiously. Within this study, PCA serves as an exploratory framework for visualizing integrated trait relationships and identifying candidates for further investigation, rather than as a quantitative ranking system or definitive indicator of enhanced drought tolerance.
Positioning of Serpin-Z2B Within the Integrated FrameworkPrevious proteomic analysis identified differential accumulation of Serpin-Z2A and Serpin-Z2B in the BIG 8-1 wheat line during early water deficit stress [16], providing the basis for targeted transcriptional evaluation in the present study. Serpin proteins act as irreversible inhibitors of serine and cysteine proteases and are implicated in the regulation of proteolytic activity during plant development and stress adaptation [17]. Upregulation of serpin genes in response to abiotic stress has been reported across multiple plant systems, suggesting a conserved association between protease inhibition and stress exposure [21,22].
Our previous work demonstrated that the mutant line BIG 8-1 exhibited enhanced drought-associated performance relative to its parental background, supported by proteomic evidence indicating differential accumulation of stress-responsive proteins, including Serpin-Z2A and Serpin-Z2B during early water deficit stress [16]. Building on these findings, the present study extends the analysis to integrated physio-morphological, cellular, and transcriptional responses under controlled drought conditions. Serpin proteins act as irreversible inhibitors of serine and cysteine proteases and are implicated in the regulation of proteolytic activity during plant development and stress adaptation [17], with upregulation reported across multiple plant systems under abiotic stress [21,22]. Clear superiority of individual genotypes was not consistently resolved across single traits in the current dataset; instead, multivariate analysis revealed distinct response profiles, particularly in BIG 8-1 and SST 027 SA1, supporting the concept that drought tolerance is a complex, systems-level trait.
Nonetheless, Serpin-Z2B expression was examined in lines that maintained distinct multivariate trait profiles under severe water deficit, as identified by PCA (Figure 6). Gene expression analysis was performed using both RT-qPCR and sqPCR (Figure 7), normalized against 18S and GAPDH reference genes previously validated for wheat expression studies [56]. Under early water deficit stress, BIG 8-1, SST 027, and SST 027 SA 1 exhibited upregulation of Serpin-Z2B, whereas BIG 8 showed downregulation. Importantly, these transcription patterns emerged during early stress, prior to the widespread physiological collapse observed at later stages [57,58].
When considered alongside the integrated phenotypic data, Serpin-Z2B upregulation was not associated with singular superiority in individual physiological parameters, such as stomatal conductance or photosynthetic efficiency, which declined across all lines under severe stress. Rather, its expression aligned with lines that maintained comparatively distinct multivariate profiles during progressive stress exposure. This contextual positioning suggests that Serpin-Z2B may contribute to early stress associated regulatory processes within the broader drought response network, consistent with reported roles of serpins in stress induced proteostasis [21,22], while remaining within a correlative interpretative framework. These transcriptional differences should be interpreted within the context of the integrated dataset, as physiological and ultrastructural responses did not consistently distinguish a superior genotype under terminal drought stress.
LimitationsGene expression measurements displayed variability across biological replicates, consistent with inherent plant to plant and tissue level heterogeneity under water deficit conditions [59]. In controlled drought experiments of moderate scale, such biological dispersion influences statistical sensitivity when detecting subtle transcriptional differences among genotypes [60,61]. Despite variation in magnitude, directional expression patterns were maintained across replicates, supporting the robustness of the observed trends.
Reference gene expression exhibited partial fluctuation under severe stress, reflecting disruption of cellular homeostasis during prolonged dehydration. Although 18S and GAPDH are widely validated for wheat gene expression analyses [56], complete stability under extreme abiotic stress conditions is biologically uncommon. Utilization of multiple reference genes enhanced normalization stability within this experimental framework.
Serpin-Z2B amplification was characterized by relatively high Ct values, indicating low basal transcript abundance. Low expression targets inherently provide reduced quantitative dynamic range during RT-qPCR analysis [62,63]. Concordant directional outcomes between RT-qPCR and sqPCR analyses strengthen confidence in the transcriptional patterns reported.
The experimental framework integrated phenotypic and transcriptional association analyses under controlled drought conditions, and interpretation is therefore limited to associations identified within this system. Functional perturbation approaches, including gene knockout or overexpression strategies, were not incorporated in the present study. Sampling was conducted at defined stress intervals (Day 0, 7, 14, 21) to capture key physiological transition stages, whereas continuous temporal profiling was not undertaken. Within these defined parameters, the findings provide structured evidence for association and candidate prioritization rather than direct mechanistic validation.
Future ValidationWithin the integrated physiological, cellular, and multivariate framework, early Serpin-Z2B upregulation was detected in selected wheat lines that maintained distinct multivariate profiles under progressive water deficit. No single physiological or cellular parameter independently discriminated against drought tolerant from susceptible genotypes, and prolonged stress resulted in a largely uniform decline in performance across backgrounds. These findings support the initial hypothesis that Serpin-Z2B expression associates with early drought response dynamics within an integrated phenotypic framework rather than acting as a singular determinant of drought tolerance. The consistent early transcriptional upregulation observed in selected lines positions Serpin-Z2B as a candidate component within a broader proteostasis and stress response network, in agreement with prior proteomic and abiotic stress reports. This work therefore serves as a screening and hypothesis refining investigation. Although causality cannot be inferred, the reproducible expression patterns provide a clear rationale for prioritizing Serpin-Z2B for future functional validation within wheat drought response research However, based on the current experimental framework, the evaluated mutant lines require further validation before being conclusively considered as superior candidates for terminal drought-stress breeding.
The following supplementary materials are available in the attached supplementary files, Figure S1: Confocal microscopy images of FFA treated SST wheat leaf cross-sections under water deficit stress. Images were generated at 20× objective magnification utilizing captured light emissions of 591 nm, 610 nm and 443 nm utilizing the fluoresces of chlorophyll (green), propidium iodide (red) and calcofluor white (blue). Images were captured at day 0, 7 14 and 21 of a drought trial; Figure S2: Scree plots generated for BIG and SST lines during PCA analysis, A–Day 0, B–Day 7, C–Day 14 and D–Day 21; Figure S3: PCA plots of variables for BIG and SST lines generated during PCA analysis, A–Day 0, B–Day 7, C–Day 14 and D–Day 21; Figure S4: PCA plots of individuals for BIG and SST lines generated during PCA analysis, A–Day 0, B–Day 7, C–Day 14 and D–Day 21; Figure S5: PCA biplots of individuals and variables for BIG and SST wheat lines generated during PCA analysis, A–Day 0, B–Day 7, C–Day 14 and D–Day 21., Figure S6: Sequence Alignments; Figure S7: Serpin-Z2B gene fragments, 2300 base pairs, separated by gel electrophoresis on 1% agarose gel and visualized using GelRed staining dye. PCR products were separated against a 1 kb Plus DNA ladder (NEB) in lane L. Lanes 1-12 contain PCR products from all 12 wheat lines (BIG 8, BIG 8-1, SST 027, SST 027 SA1, SST 027 EMS2, SST 027 EMS7, SST 877, SST 877 SA11, SST 877 SA12, SST 0147, SST 0147 EMS27 and SST 0147 EMS28). Lane NTC (No template control) is a negative control; Figure S8: Nucleotide sequence alignment centered around the RCL coding region, highlighted but the arrow from 3052-3124bp, between 3040-3140bp against the Serpin-Z2B reference gene NC_057808.1 and the Serpin-Z2B gene sequences isolated from the 12 BIG and SST wheat lines; Table S1: Wheat lines assessed within this study; Table S2: Table reporting the significant differences, according to multiple comparison analysis, between parental wheat lines and their mutations, at which time points they differ, and whether the mutant line performed better (+) or worse (−) than the parental line.
The dataset of the study is available from the authors upon reasonable request.
Conceptualization, M-SLR and A-MB; methodology, DA and M-SLR; software, DA and M-SLR; validation, DA, M-SLR and A-MB; formal analysis, DA; writing original draft preparation, DA; writing review and editing, M-SLR and A-MB; visualization, DA; supervision, M-SLR and A-MB; project administration, M-SLR; funding acquisition, A-MB. All authors have read and agreed to the published version of the manuscript.
The authors declare no conflicts of interest.
This research was funded by the South African Winter Cereal Industry Trust, grant number WCT2024/SUMO, and the National Research Fund (NRF) grant (TTK240402211612).
The authors expressed their sincere gratitude to Sensako (PTY.) Ltd. (now SYNGENTA South Africa) for the provision of the parental wheat BIG8 and SST lines.
1.
2.
3.
4.
5.
6.
7.
8.
9.
10.
11.
12.
13.
14.
15.
16.
17.
18.
19.
20.
21.
22.
23.
24.
25.
26.
27.
28.
29.
30.
31.
32.
33.
34.
35.
36.
37.
38.
39.
40.
41.
42.
43.
44.
45.
46.
47.
48.
49.
50.
51.
52.
53.
54.
55.
56.
57.
58.
59.
60.
61.
62.
63.
Allsopp D, Botha A-M, Le Roux M-S. Characterization of Physio-/Cell-Morphological and Serpin-Z2B Expression under Water Deficit Stress in Wheat. Crop Breed Genet Genom. 2026;8(2):e260017. https://doi.org/10.20900/cbgg20260017.

Copyright © Hapres Co., Ltd. Privacy Policy | Terms and Conditions