Location: Home >> Detail
Crop Breed Genet Genom. 2026;8(4):e260026. https://doi.org/10.20900/cbgg20260026
 ,
Jo-Yi Yen 2 ,
Yun-Che Hsu 2 ,
Hsiu-Yi Chou 2 ,
Assaf Eybishitz 2,*
1
2
*
Tomato leaf curl New Delhi virus (ToLCNDV) is a prominent bipartite begomovirus responsible for significant yield reductions in tomato crops throughout tropical and subtropical environments, notably across India. Although tomato breeding lines carrying multiple tomato leaf curl (Ty) resistance loci are widely deployed, their effectiveness under intense ToLCNDV related begomovirus pressure remains poorly documented. In the present study, 11 tomato lines (comprising nine WorldVeg breeding lines and two controls) representing distinct reported Ty marker profiles were assessed at an established disease hotspot in Varanasi, India, under natural whitefly vector exposure. Disease incidence and severity were evaluated at six time points (21 to 126 days post-transplanting, DAT), and the area under the disease progress curve (AUDPC) was calculated. Statistical analysis revealed highly significant variation among lines for all assessed epidemiological metrics (P < 0.001). At 126 DAT, the susceptible control exhibited 100% incidence and 99.44% severity, whereas seasonal mean severities of single-locus lines ranged from 7.22% (Ty-1) to 49.17% (Ty-2). Notably, four advanced lines—AVTO 2065, AVTO 2044, AVTO 2067, and AVTO 2064—harbouring reported Ty-2 + Ty-3/Ty-3a + ty-5 marker combinations demonstrated marked disease suppression (mean severity 0.19%–1.76%; AUDPC 18–193 %·days), outperforming the Ty-2 and Ty-3 lines and the susceptible control. Molecular assays confirmed the presence of partial DNA-A sequences closely matching ToLCNDV in symptomatic plant material. Because the study relied on natural vector inoculation and breeding-record marker designations over a single growing season, these preliminary findings suggest that the top-performing lines are potential parental germplasm for breeding tomato leaf curl disease resistance in India, pending marker validation, controlled bioassays, and multi-location trials.
Tomato (Solanum lycopersicum L.) is one of the most widely grown vegetable crops worldwide, cultivated across diverse agroclimatic zones. Global output has reached approximately 186 million metric tons harvested from 4.91 million hectares [1]. India is among the leading producers, harvesting 20.7 million tons from 0.83 million hectares (nearly 11% of global production), yet its average yield (24.5 t/ha) lags behind the world average [2]. Viral pathogens, particularly begomoviruses, are a major biological constraint and consistently compromise tomato cultivation in tropical and subtropical regions.
Tomato leaf curl New Delhi virus (ToLCNDV), a bipartite begomovirus transmitted by the whitefly Bemisia tabaci, is a major cause of tomato yield loss in India and adjacent tropical regions. Infection causes stunting, leaf curling, chlorosis and reduced fruit set [3–6], and the disease spreads rapidly through whitefly movement and infected plant material [7,8]. Host resistance is a cornerstone of integrated disease management, but its expression in the field depends on viral population dynamics, vector exposure, microclimate and host genetic background. Six major resistance loci, Ty-1 to Ty-6, have been identified in tomato; they derive from different wild species and differ in resistance spectrum and inheritance [5,9–13].
The Ty loci differ substantially in genomic origin, chromosomal location, and mechanisms of action. Ty-1 and Ty-3 are allelic variants on chromosome 6 that encode RNA-dependent RNA polymerases facilitating transcriptional gene silencing [14]; extensive allelic variation at these loci occurs across diverse tomato germplasm [15]. Ty-2, introgressed from Solanum habrochaites, maps to chromosome 11 [9,16], whereas Ty-4 and Ty-6 reside on chromosomes 3 [17] and 10 [18], respectively. The recessive allele ty-5 corresponds to a mutation within the mRNA surveillance gene Pelota [19]. Because individual resistance genes frequently confer only partial or isolate-dependent protection, plant breeding programs routinely pyramid multiple loci within single genotypes [10,20–22].
Many studies of these loci were based on the monopartite Tomato yellow leaf curl virus (TYLCV) and related begomoviruses [14,15,20,23]. In contrast, ToLCNDV has a bipartite genome [24], affects crop production across diverse regions [25,26], and co-occurs within begomovirus complexes in Indian tomato crops [27]. Comprehensive field evaluations of multi-locus Ty combinations under high ToLCNDV pressure in India remain limited. While gene pyramiding studies by Kumar et al. (2019) [21] and Prasanna et al. (2015) [22] offer important insights, the specific contribution of the recessive ty-5 locus within Ty-2 + Ty-3/Ty-3a genetic backgrounds under open-field conditions in India requires further empirical evaluation.
Disease expression in the field is strongly influenced by viral evolution, vector exposure, and microclimate, so tomato leaf curl disease severity in India fluctuates markedly between seasons and locations [28,29]. Nevertheless, field screening at established disease hotspots is widely used in breeding programs to evaluate advanced breeding lines under natural disease pressure, as it integrates host susceptibility, vector dynamics, and diverse viral strains under realistic cultivation conditions [10,30,31]. Standardized visual severity scales [30,32], together with epidemiological indices such as area under disease progress curve (AUDPC) and apparent infection rates [4,33,34], enable rigorous quantitative comparisons among entries. However, because inoculum loads and viral strain compositions cannot be controlled under open-field conditions, such datasets quantify disease progression but cannot establish the causal contribution of individual Ty loci or the long-term durability of resistance.
Prior research examining Ty-mediated disease resistance has predominantly used controlled greenhouse inoculations with specific viral isolates. The present study complements these approaches with a replicated open-field evaluation of advanced breeding lines exposed to natural vector-borne disease pressure at a high-incidence hotspot. The main objectives were (i) to characterize field phenotypic responses (disease incidence, severity, and spatial-temporal progress) of tomato lines representing distinct reported Ty marker profiles; (ii) to identify promising candidate lines for subsequent marker validation, controlled bioassays, and multi-location field trials; and (iii) to identify the begomovirus associated with symptomatic plant leaf samples by PCR and sequencing.
An open-field trial was conducted in Varanasi, Uttar Pradesh, India, from September 2023 through February 2024, coinciding with peak whitefly populations and maximal disease pressure. Located in the eastern Gangetic plain, the site experiences ambient temperatures between 5.7 °C and 41.1 °C and mean annual precipitation of 800–1000 mm. Eleven tomato lines were evaluated (Table 1), comprising nine fixed F8 WorldVeg inbred lines derived from marker-assisted selection programs (AVTO 2011, AVTO 0301, AVTO 2044, AVTO 2045, AVTO 2064, AVTO 2065, AVTO 2066, AVTO 2067, and VIO 59341) alongside two control cultivars. The controls were Kashi Aman (developed by ICAR-IIVR, Varanasi), an adapted cultivar featuring the S. chilense derived Ty-3 introgression that confers resistance under Gangetic plain environments [22], and AVTO 9708 (‘Tanya’), an elite line lacking known Ty loci that served as the susceptible baseline, reflecting natural vector inoculation pressure rather than poor agronomic adaptation [35]. Lines were classified into seven marker groups (GN0–GN6) according to historical breeding records: no reported locus (GN0), Ty-1 (GN1), Ty-2 (GN2), Ty-3 (GN3), Ty-2 + Ty-3/Ty-3a (GN4), Ty-2 + Ty-3/Ty-3a + ty-5 (GN5), and ty-5 + Ty-6 (GN6). These classifications reflect pedigree documentation and were not independently verified by genotyping in this study. Ty-1 and Ty-3 are allelic variants at the same locus.
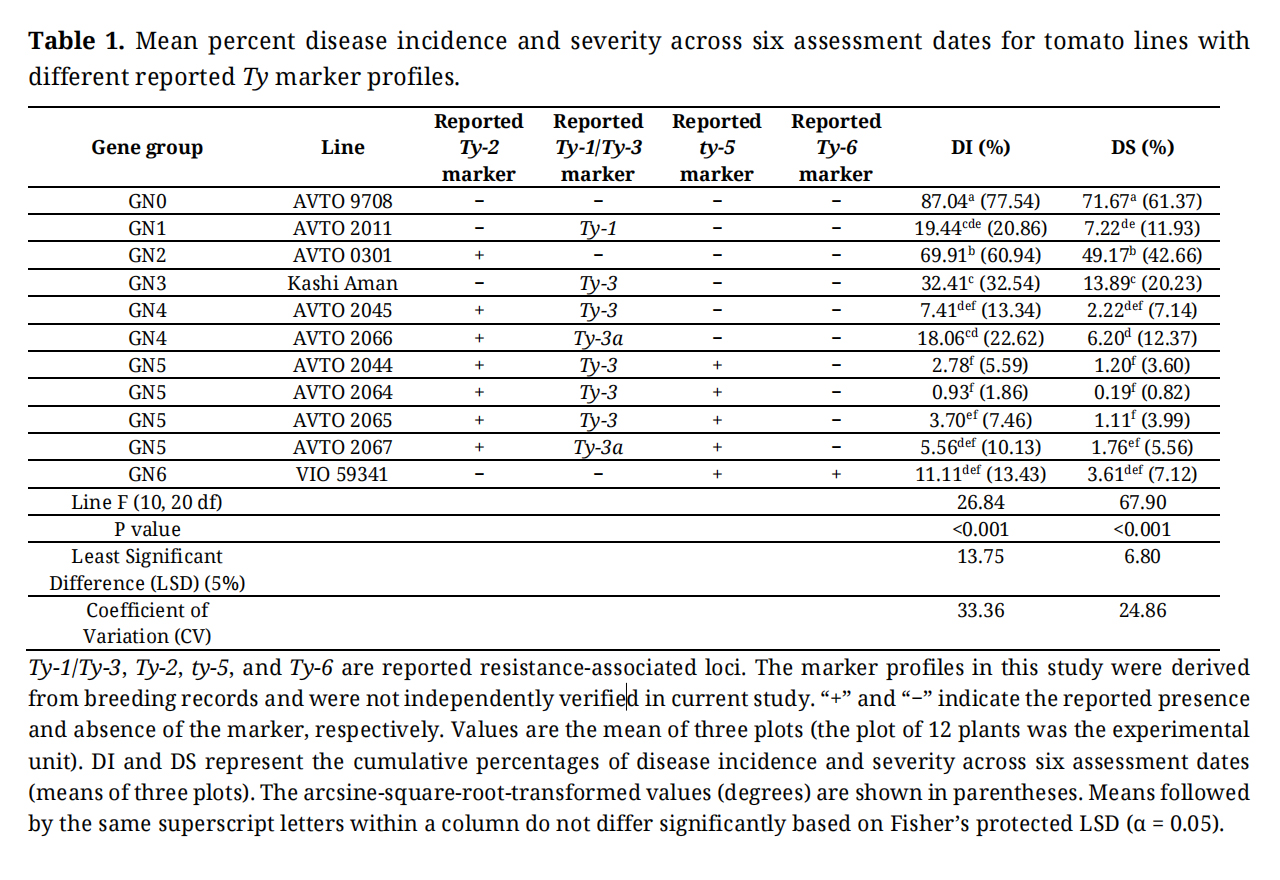 Table 1. Mean percent disease incidence and severity across six assessment dates for tomato lines with different reported Ty marker profiles.
Detailed marker specifications for Ty-1, Ty-2, Ty-3/Ty-3a, ty-5, and Ty-6 are provided in Table S1. Two pairs of related sister inbred lines (AVTO 2044/AVTO 2045 and AVTO 2066/AVTO 2067) share ancestry and were selfed to the F8 generation (Table S2). The lines within each pair differ in reported ty-5 presence; however, because near-isogenicity was not verified, these pairs were examined only descriptively.
Field Site and Experimental DesignThe trial used a randomized complete block design (RCBD) with three blocks (replications). Each block contained all 11 lines, randomized across plots, giving 33 plots in total. Each plot comprised 12 plants (36 plants per line; 396 evaluated in total) in a 7.2-m row, with 0.60 m intra-row spacing and 0.90 m inter-plot spacing, and blocks were separated by 1.5-m buffer zones. Randomization was used to mitigate spatial heterogeneity in whitefly pressure and natural viral inoculum. Standard cultural and management practices were applied. No artificial inoculation or vector release was performed; all plants were exposed to natural inoculum and free-moving whitefly populations.
The experimental unit was the 12-plant plot; individual plant observations were subsamples used to generate plot-level metrics, and statistical inference was restricted to plot-level values. Evaluated factors included line (11 levels), replication block (three levels), and repeated assessment date (six dates at 21-day intervals, from 21 to 126 days post-transplanting, DAT). Epidemiological response parameters included cumulative percent disease incidence (PDI), percent disease severity (PDS), and AUDPC; the apparent infection rate (r) and coefficient of determination (R2) were derived strictly as descriptive parameters. Leaf samples for virus identification were collected from symptomatic plants at 63 DAT.
Disease AssessmentDisease incidence and severity scores were recorded at 21-day intervals, beginning 21 days after transplanting and continuing at 42, 63, 84, 105, and 126 DAT.
Disease severity was scored for each plant on a six-class scale (0–5) based on Friedmann et al. (1998) [32].
0:
1:
2:
3:
4:
5:
The complete raw field data on disease incidence and severity are presented in Table S3.
Epidemiological metrics were quantified on a cumulative basis. Plot-level cumulative percentage disease incidence (PDI) was the percentage of evaluated plants (N = 12) per plot displaying visible symptoms by or before each assessment date; plants identified as infected remained classified as diseased in all subsequent evaluations, ensuring monotonic non-decreasing trends. Percent disease severity (PDS) was derived from the highest visual score assigned to each plant up to the assessment date, expressed relative to the theoretical maximum score across all 12 plants of each plot, including symptom-free plants. Cumulative scoring reflects the maximum disease expression reached by each plant and removes artifacts caused by transient grade 1 symptoms, which were not retained at later assessments in 6 of the 2376 plant-by-assessment observations.
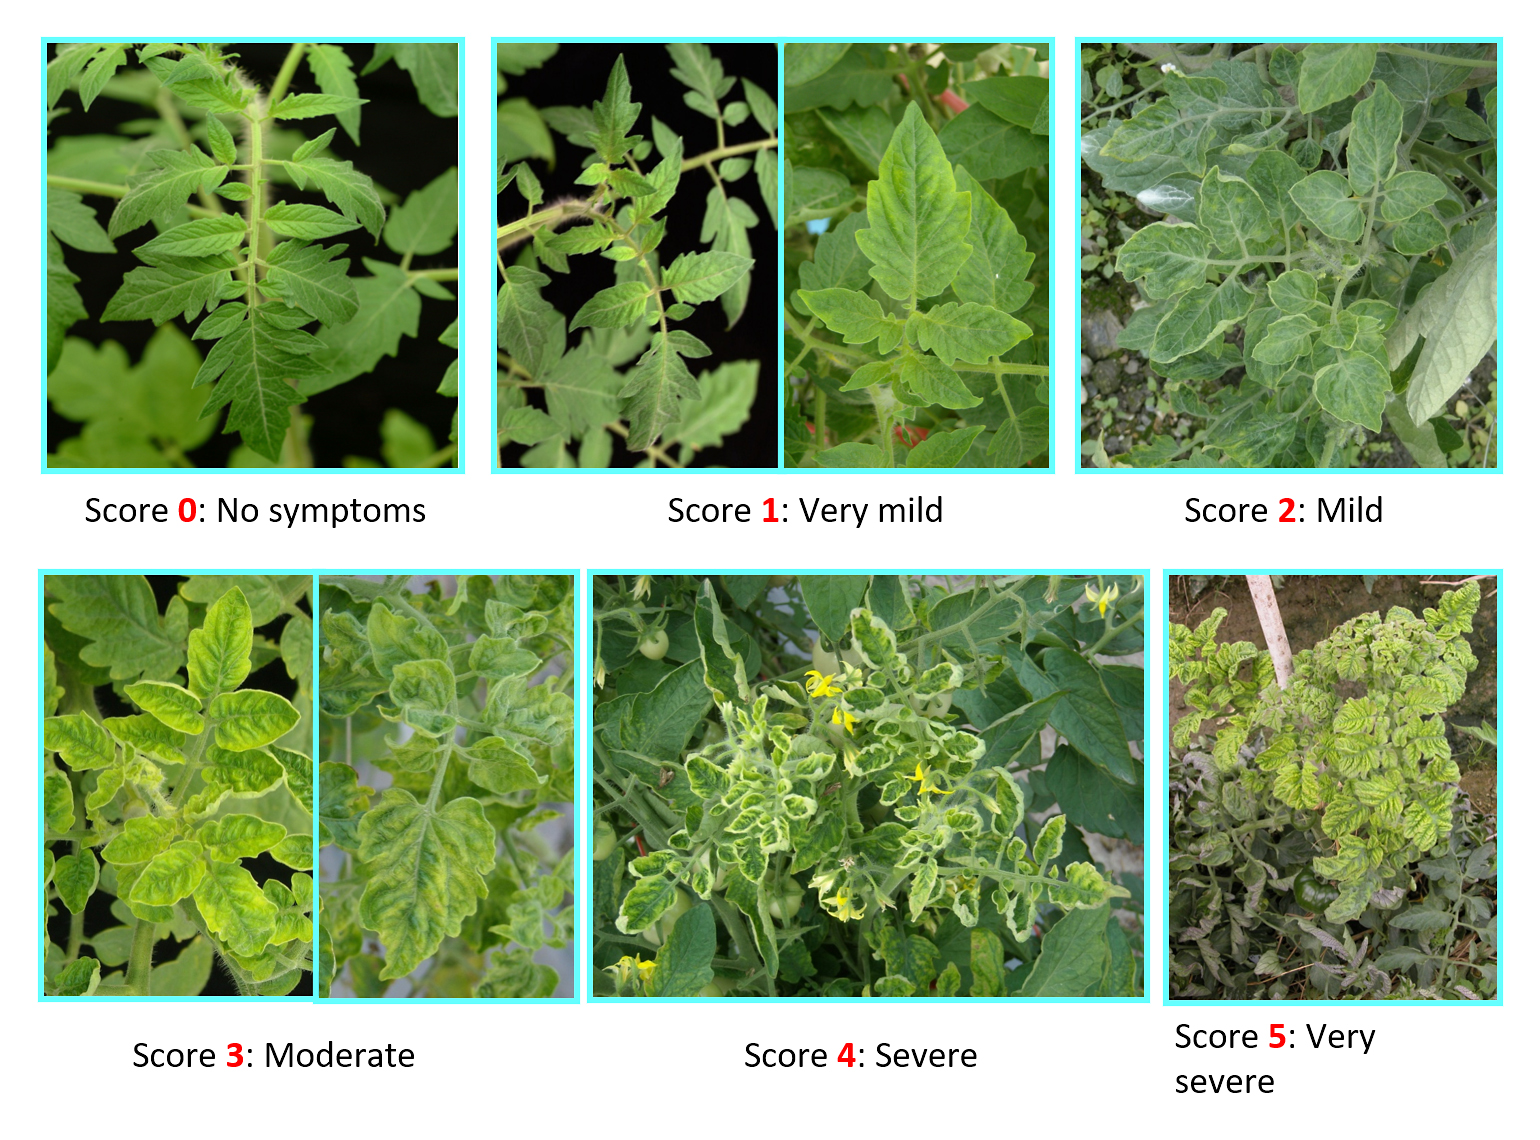 Figure 1. Representative disease severity grades (0–5) displaying typical visual symptoms in tomato lines under field pressure from ToLCNDV-related begomovirus.
Plot-level AUDPC values were calculated from cumulative severity progression profiles by standard trapezoidal integration across all six assessment dates. AUDPC integrates overall disease magnitude over the 105-day window from the first to the last observation and is reported in %·days. Relative AUDPC (rAUDPC) was computed by dividing plot AUDPC by the maximum possible value (100% × 105 days).
Statistical AnalysisPercent Disease Incidence (I): Plot-level disease incidence was calculated according to Madden and Hughes (1999) [36]:
where x is the cumulative number of symptomatic plants in a plot by or before the evaluation date and N is the total number of evaluated plants per plot (N = 12).
Percent Disease Severity (S): Disease severity was estimated using the formula proposed by Chiang et al. (2017) [37]:
where xi is the highest disease severity grade recorded for a plant up to and including the assessment date, ni is the number of plants exhibiting cumulative grade i, N is the total number of evaluated plants per plot (12), and Xmax is the maximum disease scale score (5).
Area Under the Disease Progress Curve (AUDPC): AUDPC was calculated for each experimental plot using the trapezoidal method [38–40]:
where Yi is the disease severity proportion at observation i and ti is the corresponding evaluation time (DAT). With evaluations at 21, 42, 63, 84, 105, and 126 DAT, the integration period spanned 105 days. The AUDPC was determined at the plot level before entry means were calculated [41].
Apparent Infection Rate (r): Apparent infection rate (r) was calculated as a descriptive epidemiological parameter [33]. For each line, the mean plot-level cumulative disease severity curve was transformed using the logit function, ln[x/(1 − x)], and regressed against DAT. Because proportions of 0% or 100% make the logit transformation undefined, a 0.5-count continuity correction was applied to proportions derived from 180 possible severity units (36 plants × a maximum score of 5). The resulting slope is reported as r (day−1). The apparent infection rate was not used for inferential comparisons among lines [34]. The equation used is:
where r is the apparent infection rate, t1 and t2 are evaluation timepoints, and x1 and x2 represent infection proportions at t1 and t2, respectively.
Coefficient of Determination (R2): The coefficient of determination (R2) was derived from the line-level logit regression used to estimate r. It serves as a descriptive metric of the proportion of temporal variation explained by the fitted linear model [42]:
Statistical Models and InferenceExperimental Unit and Data Structure: The trial followed an RCBD with 11 lines and three blocks (33 plots in total) [42]. All inferential analyses used 33 plot-level values per assessment date (198 plot-by-date records). Three models addressed complementary questions: Model 1 compared lines on each assessment date and for the seasonal means; Model 2 tested whether disease progression over time differed among lines (line × date interaction); and Model 3 compared lines for season-long integrated disease (AUDPC).
Data Transformation: Percentage data bounded between 0% and 100% (PDI and PDS) were arcsine-square-root-transformed before analysis, y = arcsin(√(p/100)), expressed in degrees [43]. LSD values and coefficients of variation (CVs) are given on the transformed scale, whereas untransformed arithmetic means are reported to aid biological interpretation.
Model 1: RCBD Analysis of Plot-Level PDI and PDS. For each assessment date and for the seasonal plot means, transformed plot values were analyzed with the fixed-effects RCBD model:
where yij is the transformed value of the plot of line i in block j, μ is the overall mean, τi is the effect of the ith line (i = 1–11), βj is the effect of the jth block (j = 1–3), and εij is the plot error, assumed independent and distributed N(0, σ2) [42]. The degrees of freedom were 10 for line, 2 for block, 20 for error, and 32 in total.
Model 2: Repeated-Measures Analysis of Disease Progression. Because each plot was assessed six times (21, 42, 63, 84, 105 and 126 DAT), observations within a plot were not independent. The full plot-by-date dataset for PDI and PDS was therefore analyzed with a linear mixed model [44]:
in which line (τi), block (βj), assessment date (δk, six levels), and the line × date interaction ((τδ)ik) were fixed effects and the plot pij ~ N(0, σ2p) was a random effect nested within block, generating a compound-symmetric within-plot covariance structure. εijk ~ N(0, σ2) is the within-plot residual. Because the design is balanced, this model is equivalent to a split-plot-in-time analysis of variance in which line and block are tested against the plot (whole-plot) error and date and line × date are tested against the within-plot residual. The degrees of freedom were 10 for line, 2 for block, 5 for date, 50 for line × date, 20 for whole-plot error, and 130 for within-plot error. Sphericity was assessed using the pooled within-plot covariance matrix, and the Greenhouse–Geisser (GG) correction was applied to the date and line × date F-tests [45].
Model 3: Plot-Level AUDPC Analysis. Plot-level AUDPC values were analyzed with Model 3 after square-root transformation to meet the assumptions of normality and homogeneity of variance. It presents untransformed means with mean-separation letters derived from the transformed analysis. Model 3 used the same fixed-effects RCBD structure as Model 1 (line 10 df, block 2 df, error 20 df).
Mean Separation and Model Diagnostics: Fisher’s protected LSD at α = 0.05 was applied only after a significant overall line F-test [42]. For every RCBD model, residuals were checked for normality (Shapiro–Wilk test [46]), homogeneity of variance among lines (median-centered Levene’s test [47]) and heteroscedasticity (Breusch–Pagan test [48]), and residual-versus-fitted and normal quantile–quantile plots were inspected. Because cumulative disease measures are zero-inflated at the earliest assessments, line effects were also corroborated with distribution-free procedures [49]: restricted permutation tests in which transformed plot values were permuted among lines within blocks (4999 permutations) and Friedman rank tests blocked on replication [50]. The line × date interaction was corroborated by permuting assessment-date labels within plots (2000 permutations).
Software. All analyses were performed in R version 4.4.2 [51] using stats::aov and stats::lm for the RCBD models, nlme::lme for the linear mixed model [44], car::leveneTest [52] and lmtest::bptest [53] for the variance diagnostics, and agricolae::LSD.test [54] for protected mean separation, with purpose-written code for the cumulative scoring, trapezoidal AUDPC, GG correction, and permutation tests.
Virus Detection, Cloning and SequencingSymptomatic leaf samples were collected from all lines at the third assessment (63 DAT) to detect and identify the begomovirus associated with the disease in the trial. Each of the three replications was sampled separately because disease development was not uniform among them. Cloning and sequencing were outsourced to Nucleome Informatics (Hyderabad, India). Total DNA was extracted from leaf tissue with a NucleoSpin Plant II Mini kit (MN, Düren, Germany) according to the manufacturer’s instructions, and DNA quality and integrity were checked before PCR.
Begomovirus DNA was initially detected by PCR using a begomovirus-specific degenerate primer pair [55] targeting a partial region encompassing the intergenic region (IR) and V2 gene of DNA-A, consisting of the forward primer 5′-GCATCTGCAGGCCCACATBGTYTTHCCNGT-3′ and reverse primer 5′-GATTTCTGCAGTTDATRTTHTCRTCCATCCA-3′. PCR amplification was performed using EmeraldAmp® GT PCR Master Mix and PrimeSTAR® GXL DNA Polymerase (R50B, Takara Bio Inc., Kusatsu, Japan). Amplification was carried out with an initial denaturation at 94 °C for 3 min, followed by 35 cycles of denaturation at 94 °C for 30 s, annealing at 58 °C for 30 s, and extension at 72 °C for 1 min, and a final extension at 72 °C for 5 min. The amplified products were separated by 1% agarose gel electrophoresis and visualized using a gel documentation system. For molecular identification of the infecting begomovirus, symptomatic samples were further analyzed using three degenerate primer pairs, PAL1v1978B/PAR1c715H, CRNDv30/CRNDc1181, and CRv301/CRc1152, targeting the regions of begomovirus DNA-A encompassing the IR and V2 gene. The resulting approximately 1.5-kb PCR products were separated by agarose gel electrophoresis, and bands of the expected size were excised and purified using a NucleoSpin Gel and PCR Clean-up Mini kit (MN, Düren, Germany). The purified amplicons were cloned into the pCR™8/GW/TOPO™ TA cloning vector using a pCR™8/GW/TOPO™ TA Cloning Kit (Invitrogen), following the manufacturer’s instructions, and transformed into TOP10 Escherichia coli competent cells. Recombinant colonies were screened by colony PCR using the M13 primer pair. Three positive colonies containing the expected insert were selected for plasmid DNA isolation using a NucleoSpin Plasmid Mini kit (MN, Düren, Germany).
Recombinant plasmids were sequenced by the Sanger method with the M13 primer pair. Because the outsourced workflow did not retain records linking each intermediate sample clone to its colony identifier, a complete sample-to-clone chain could not be reconstructed. To support sequence integrity, all target clones were sequenced independently in both directions. Raw reads, chromatograms, and consensus sequences are presented in File S1. The 1.5-kb sequences were compared with the NCBI nucleotide database by BLASTn to identify the closest begomovirus matches.
Robust natural disease pressure enabled clear discrimination among the evaluated lines, including the controls Kashi Aman and AVTO 9708. Fixed-effects RCBD analysis of seasonal plot means revealed highly significant variation among lines for both disease incidence (F10,20 = 26.84, P < 0.001) and disease severity (F10,20 = 67.90, P < 0.001). Block effects were non-significant for incidence (F2,20 = 0.55, P = 0.587) and marginal for severity (F2,20 = 3.31, P = 0.057) (Table 1). Model diagnostics confirmed appropriate residual behaviour (Shapiro–Wilk P = 0.259 and 0.387; Levene P = 0.992 and 0.977), with line differences further substantiated by restricted permutation tests (P < 0.001) and non-parametric Friedman tests (P = 0.008 and 0.005). Line effects also remained highly significant at every assessment date (Tables 2 and 3).
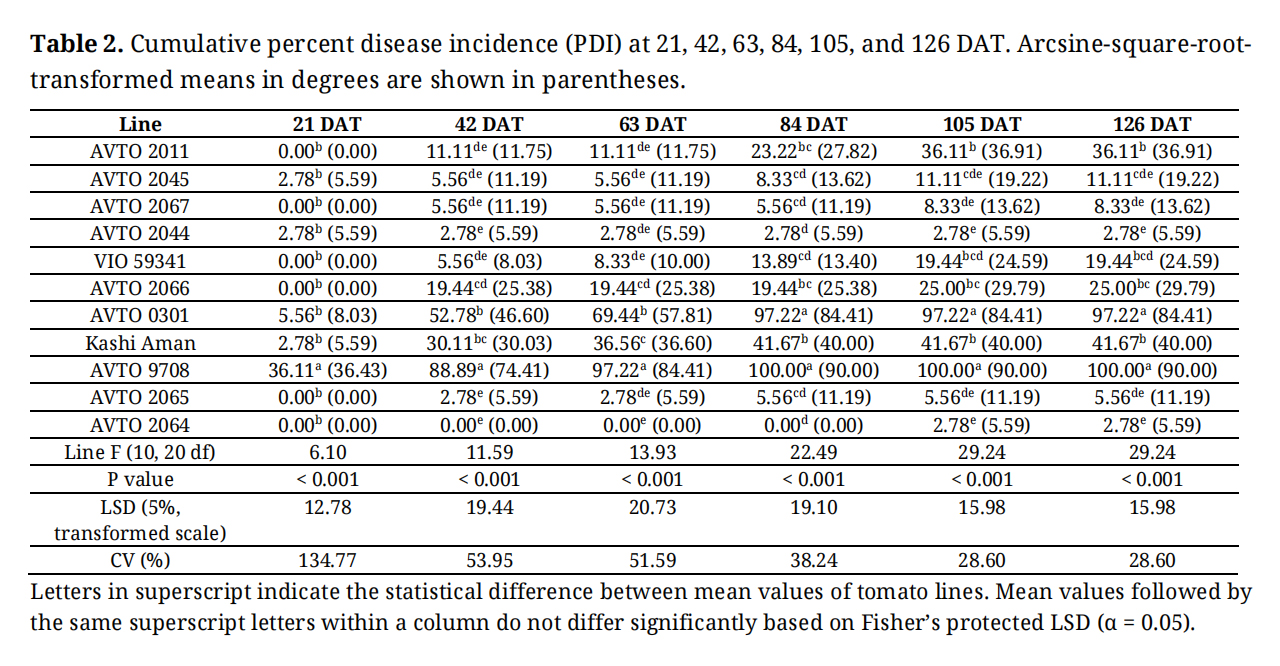 Table 2. Cumulative percent disease incidence (PDI) at 21, 42, 63, 84, 105, and 126 DAT. Arcsine-square-root-transformed means in degrees are shown in parentheses.
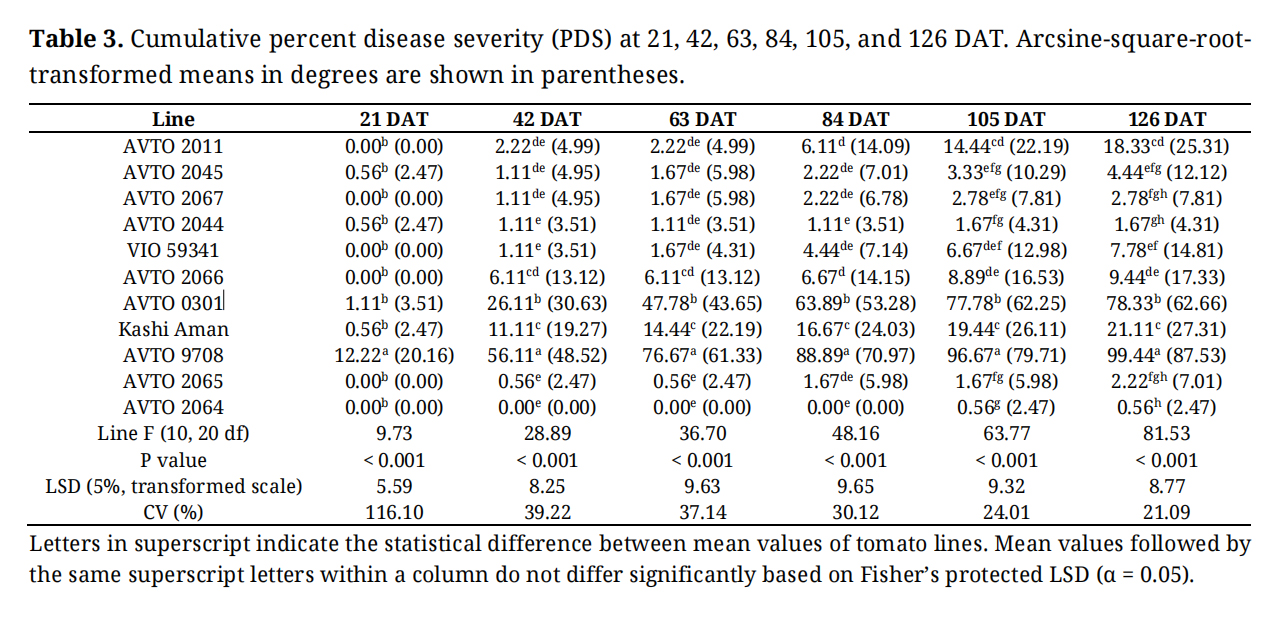 Table 3. Cumulative percent disease severity (PDS) at 21, 42, 63, 84, 105, and 126 DAT. Arcsine-square-root-transformed means in degrees are shown in parentheses.
The tomato lines were categorized into seven marker groups (GN0–GN6) according to reported Ty gene profiles (Table 1), treating Ty-3 and Ty-3a as allelic variants. These classifications summarize historical breeding records rather than verified genotypes or experimental treatments. Because most groups comprise single lines (except GN4 with two and GN5 with four), group responses are confounded with host genetic background.
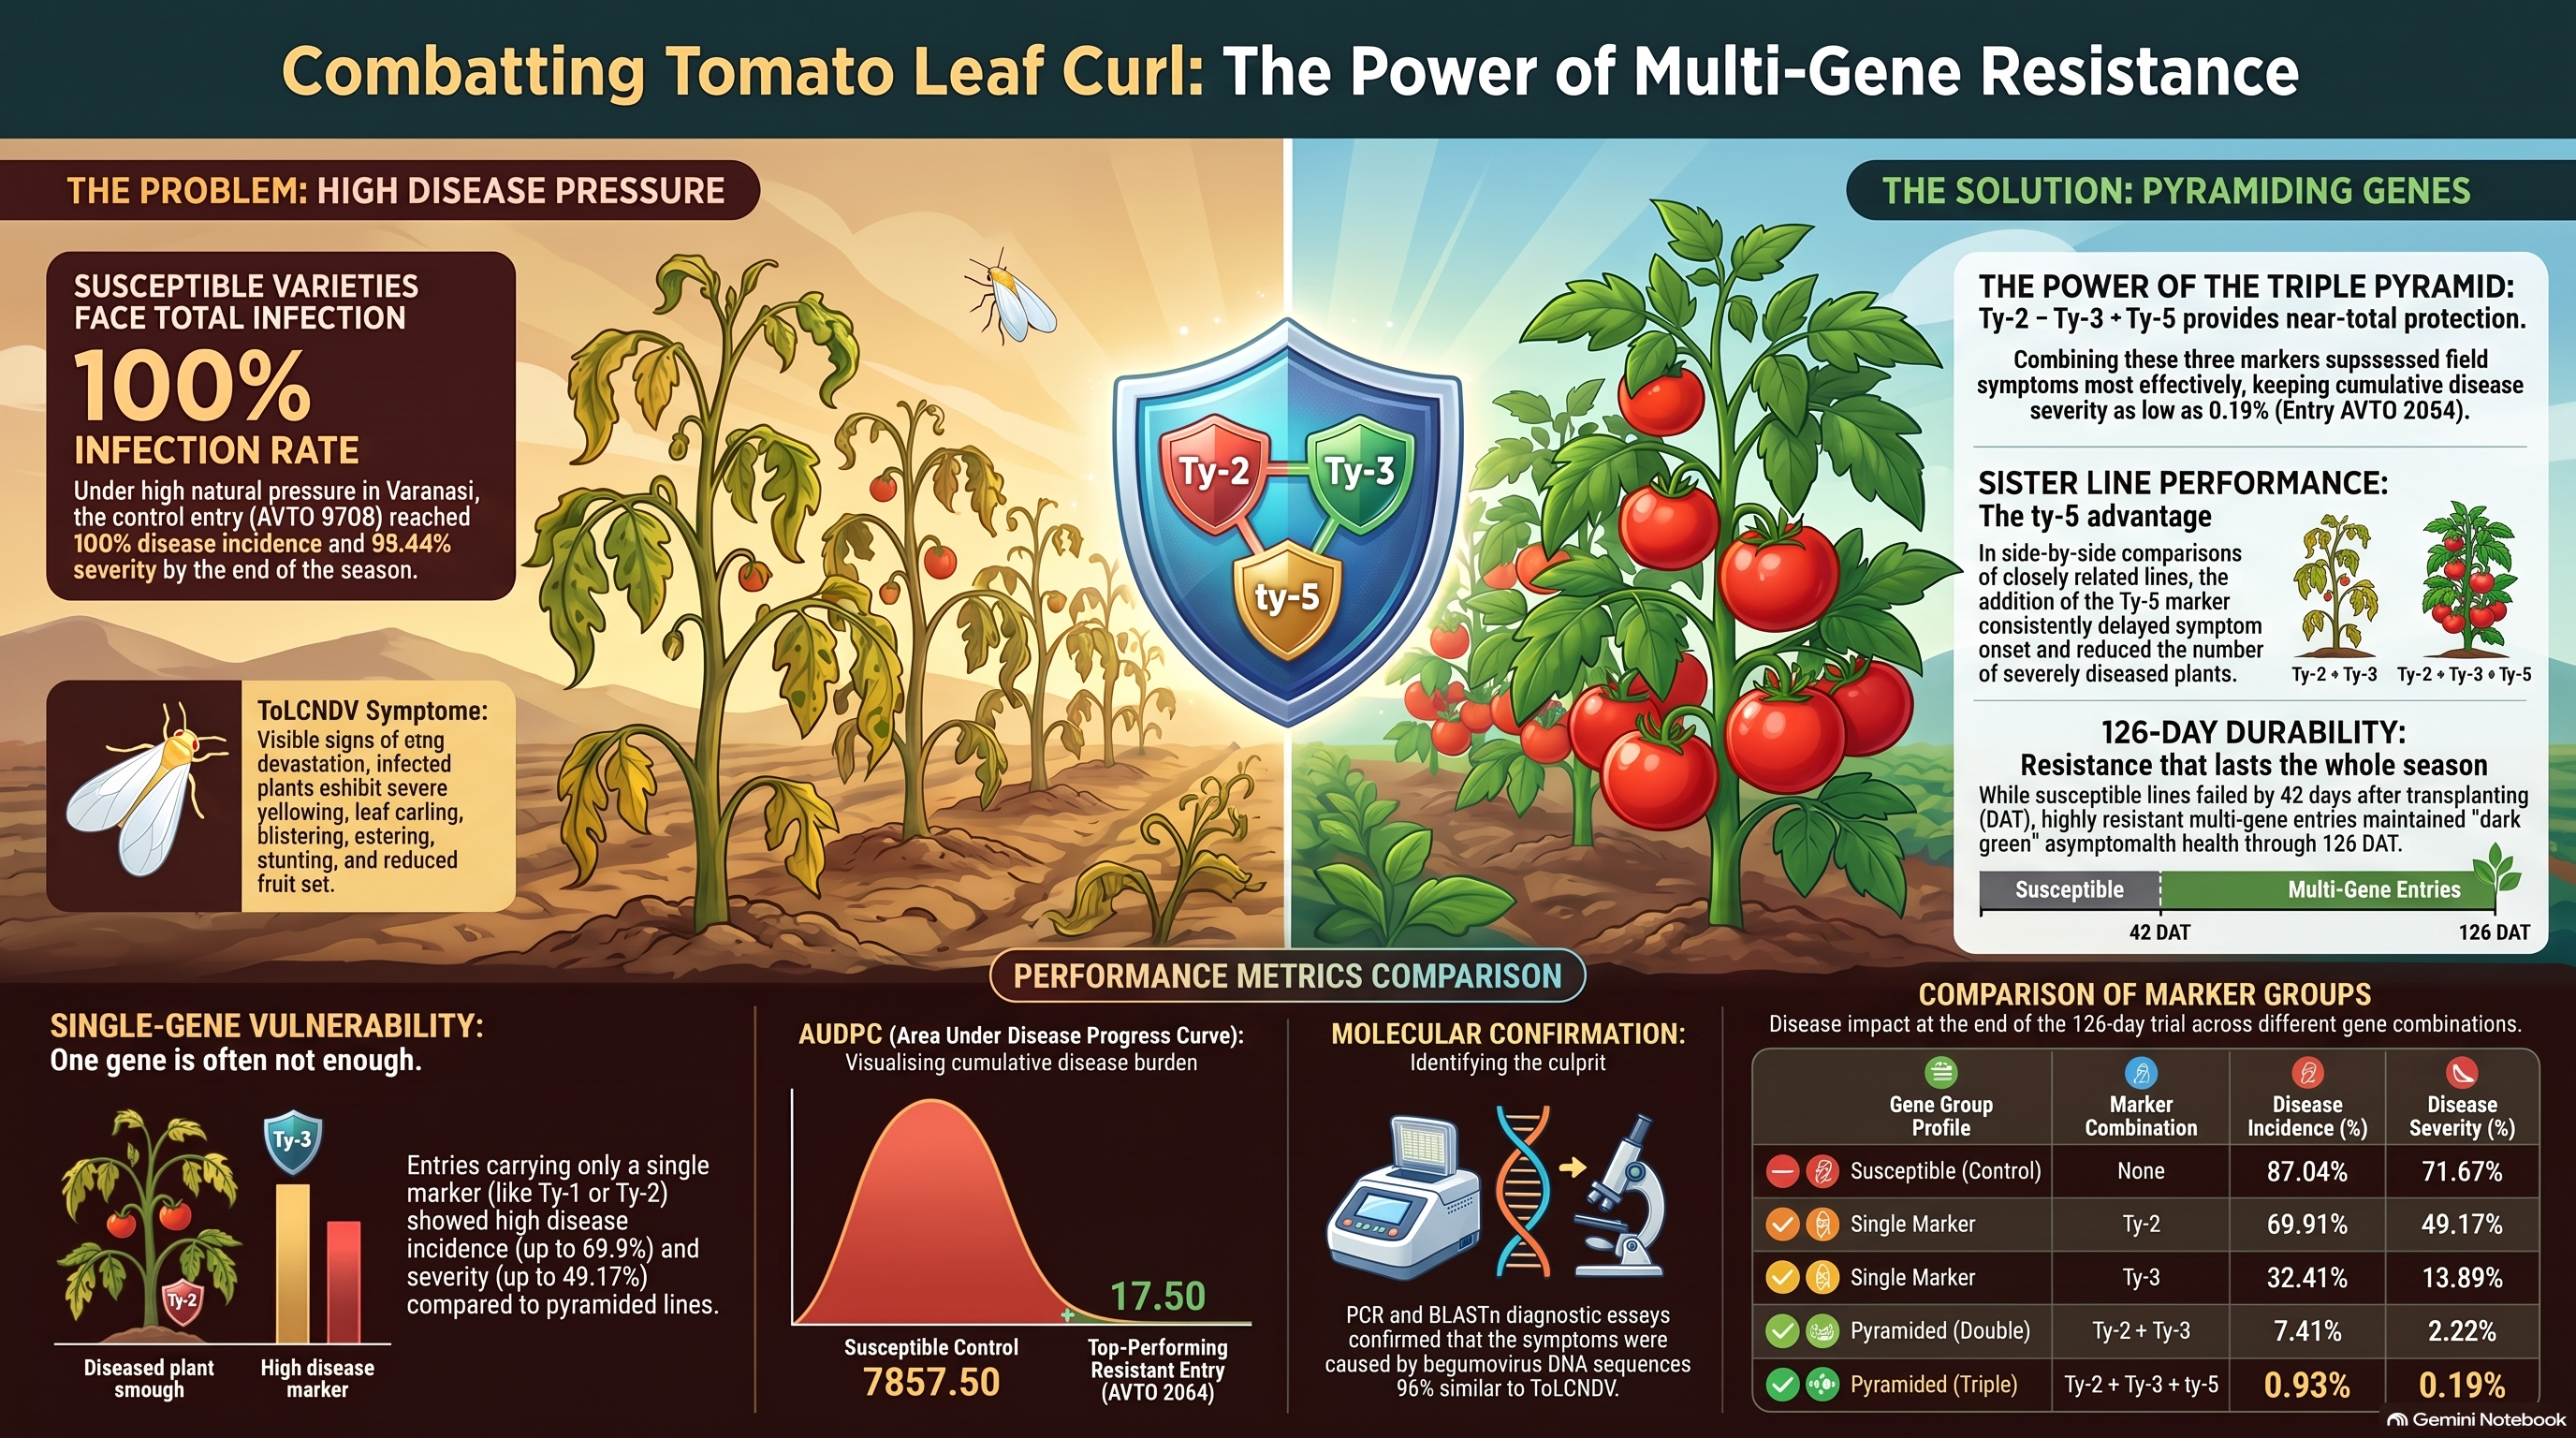
Across the six evaluation dates, mean disease incidence and severity peaked in group GN0 (AVTO 9708; 87.04% and 71.67%, respectively) and remained lowest in GN5 (0.93%–5.56% and 0.19%–1.76%) (Table 1). All four advanced lines in GN5 carrying reported Ty-2 + Ty-3/Ty-3a + ty-5 marker profiles demonstrated marked disease suppression compared with AVTO 9708, AVTO 0301 (Ty-2), and Kashi Aman (Ty-3). However, their performance did not differ significantly from AVTO 2045 (Ty-2 + Ty-3) or VIO 59341 (ty-5 + Ty-6). In addition, the single-locus line AVTO 2011 (Ty-1) exhibited low mean severity (7.22%), which did not differ significantly from AVTO 2067 or AVTO 2045. Therefore, the observed field differences cannot be attributed solely to specific marker combinations.
Temporal Divergence in Disease Incidence and Severity Across Assessment IntervalsClear separation among lines emerged early for both cumulative disease incidence and severity, with highly significant line effects at every assessment date (incidence F10,20 = 6.10–29.24; severity F10,20 = 9.73–81.53; P < 0.001, with incidence at 21 DAT showing P = 0.0003; Tables 2 and 3). Block effects were non-significant for incidence (P = 0.29–0.58) and achieved significance for severity only at 63 and 84 DAT (P = 0.046 and 0.034; P = 0.07–0.57 on remaining dates), reflecting transient localized variance rather than systematic field gradients; residual variances remained homogeneous at every interval (Levene P ≥ 0.70). AVTO 9708 and AVTO 0301 recorded the highest infection levels across the trial. At 126 DAT, AVTO 9708 exhibited 100.00% incidence (Figure 2) and 99.44% severity, whereas advanced lines harboring reported Ty-2 + Ty-3/Ty-3a + ty-5 combinations maintained minimal disease progression (severity 0.56%–2.78%; Figure 3).
Disease severity increased steadily in most of the lines, closely paralleling incidence progression (Tables 2 and 3). At 42 DAT, AVTO 9708 (56.11%), AVTO 0301 (26.11%), and Kashi Aman (11.11%) displayed the highest severity, whereas AVTO 2066 (6.11%) and the remaining lines showed delayed development. Mean severity in AVTO 2064, AVTO 2065, AVTO 2067, and AVTO 2044 remained below 5% throughout the evaluation period. AVTO 9708 surpassed 50% severity at 42 DAT and AVTO 0301 at 84 DAT, reaching 99.44% and 78.33% at 126 DAT, respectively. Cumulative disease severity at the final assessment (126 DAT) ranged from 0.56% (AVTO 2064) to 99.44% (AVTO 9708) across all lines (Figure 3).
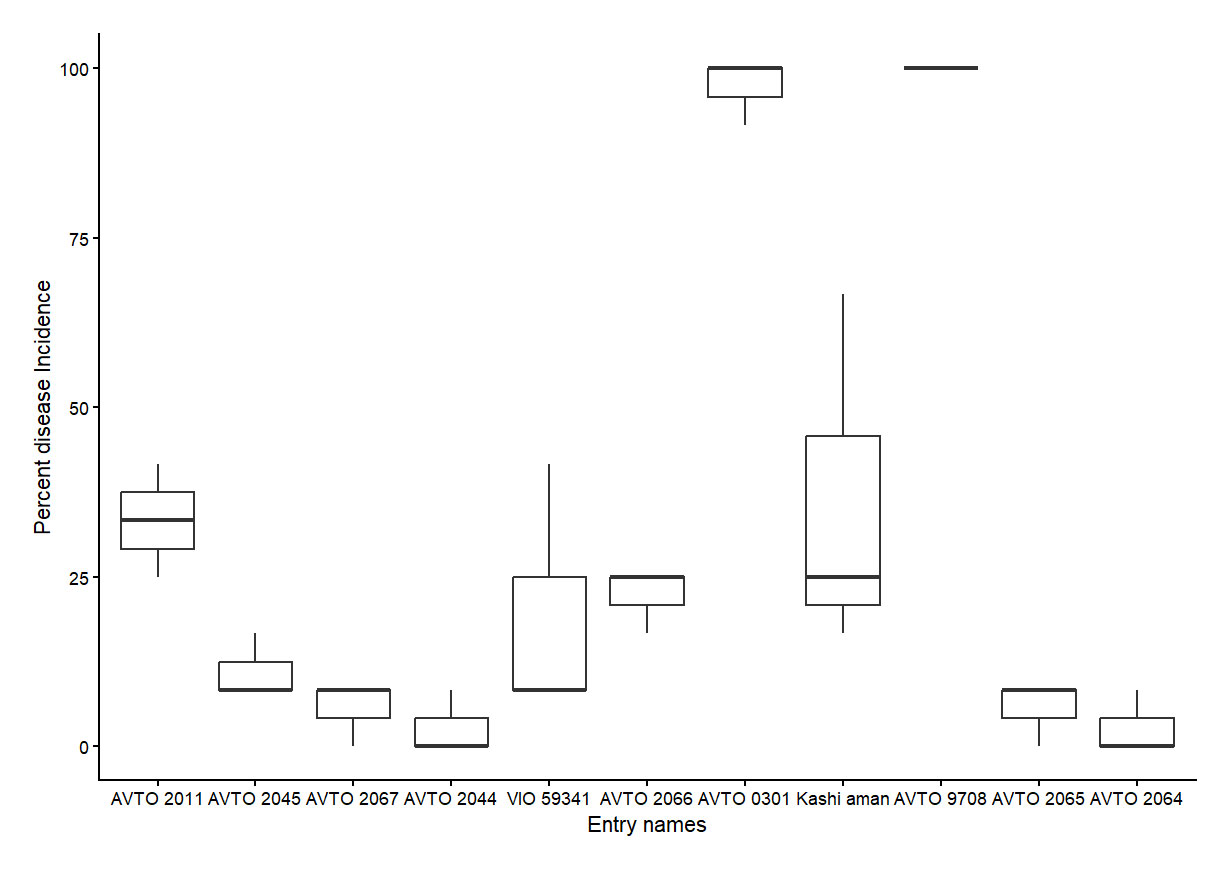 Figure 2. Percent disease incidence (%) across tomato lines with different reported Ty marker profiles and comparative controls under ToLCNDV-related begomovirus pressure at the final assessment (126 DAT); bars show mean ± SE.
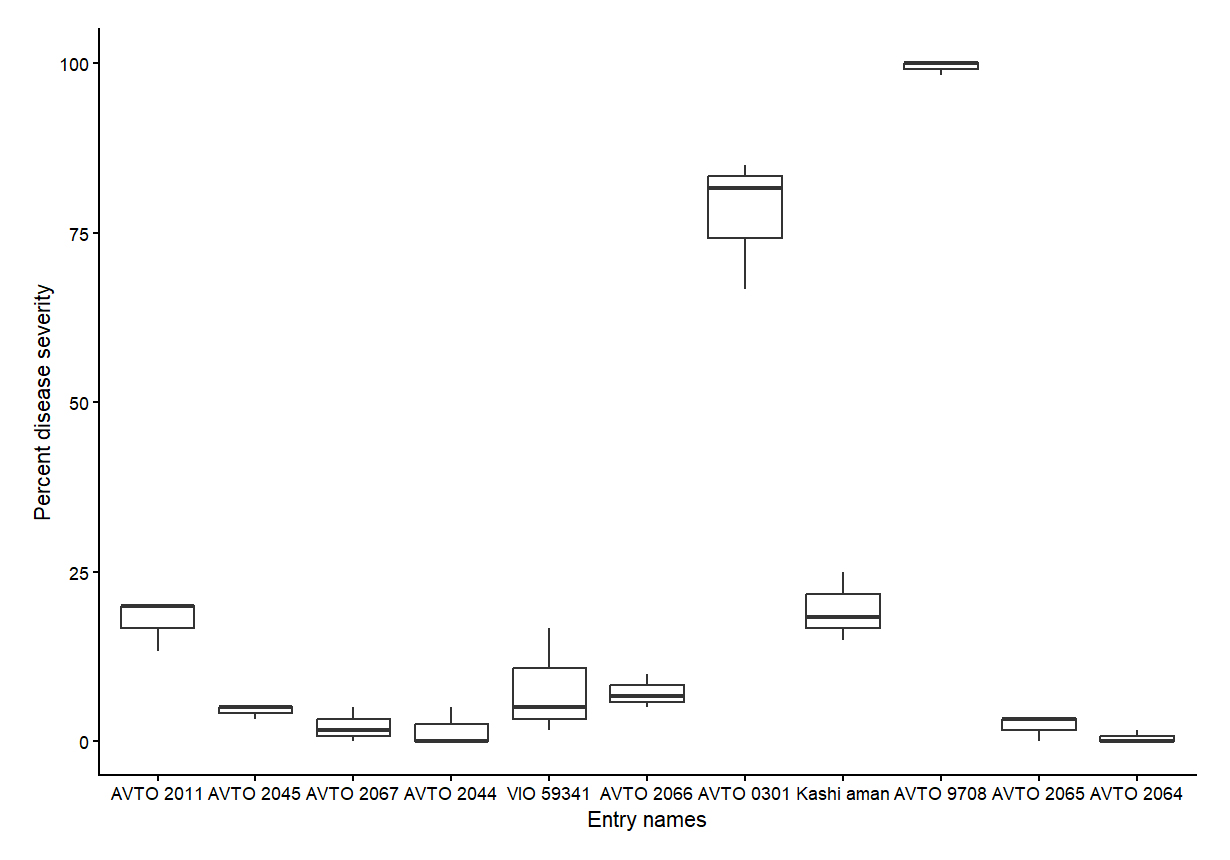 Figure 3. Percent disease severity across tomato lines with different reported Ty marker profiles and comparative controls under ToLCNDV-related begomovirus pressure at the final assessment (126 DAT); bars show mean ± SE.
To characterize individual-plant disease dynamics, heatmaps (Figure 4) were constructed from the 0–5 visual rating scale (0, dark green, asymptomatic; 1, light green, mild yellowing; 2, yellow, moderate curling; 3, orange, severe curling; 4, red-orange, severe blistering; 5, deep red, extreme stunting/death). In each matrix, rows delineate the three evaluation blocks (R I–R III) and columns represent individual plant observations across all six evaluation intervals. The resulting profiles allow direct comparison between the closely related sister pairs (AVTO 2044/AVTO 2045 and AVTO 2066/AVTO 2067) and the susceptible control AVTO 9708; they serve a strictly descriptive purpose and provide no independent statistical inference.
Across both sister-line comparisons, entries harboring the reported ty-5 locus exhibited reduced disease expression relative to their respective sister lines (Figure 4). In the first pair, AVTO 2044 (Ty-2 + Ty-3 + ty-5) showed no visual symptoms (grade 0) in nearly all plots, except for a single plant in position 9 that displayed moderate disease symptoms (grades 2–3) from 84 through 126 DAT. In contrast, AVTO 2045 (Ty-2 + Ty-3) accumulated more symptomatic plants between 84 and 126 DAT, with scattered mild to moderate scores (grades 1–2) across multiple blocks. In the second sister-line pair, AVTO 2067 (Ty-2 + Ty-3a + ty-5) remained largely symptom-free until 63 DAT, showing only minor chlorotic symptoms (grades 1–2) in isolated plants by 126 DAT. Sister line AVTO 2066 (Ty-2 + Ty-3a) displayed earlier symptom development (mild chlorosis by 42 DAT) and advanced to moderate disease grades (2–3) in several plants across the three replicates from 63 DAT.
From an inferential standpoint, overall seasonal means did not separate AVTO 2044 from AVTO 2045 for incidence or severity, whereas AVTO 2067 demonstrated significantly lower severity, but not incidence, than AVTO 2066 (Table 1). Thus, while visual heatmaps illustrate a subtle trend toward delayed disease onset and suppressed symptom severity in lines carrying the reported ty-5 recessive allele, these qualitative trends do not demonstrate the functional efficacy of the locus. The susceptible benchmark AVTO 9708 developed rapid infection by 42 DAT and sustained widespread, high severity scores (grades 4–5) across all replications from 63 to 126 DAT, confirming intense, uniform disease pressure and vector transmission throughout the trial.
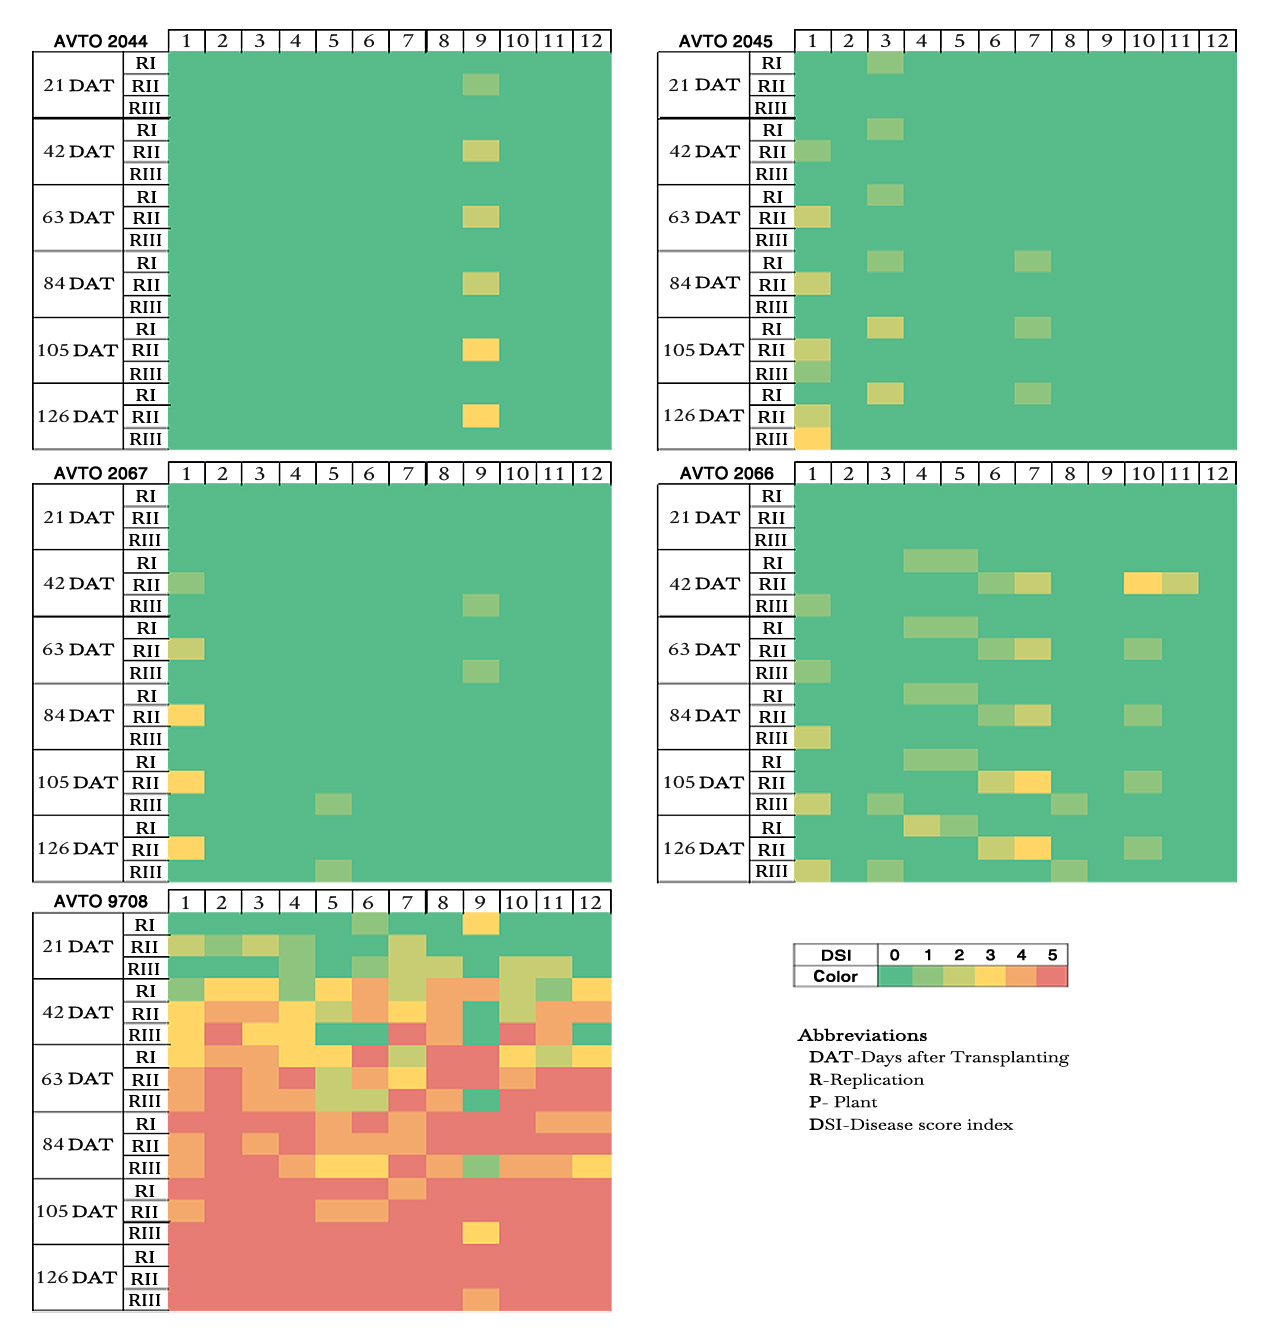 Figure 4. Individual plant-level disease severity heatmaps illustrating progressive visual symptom expression across sister-line pairs (AVTO 2044/AVTO 2045 and AVTO 2067/AVTO 2066) alongside susceptible control AVTO 9708.
Early infection and progressive viral buildup largely governed overall severity, which increased substantially over the evaluation window (Figure 5).
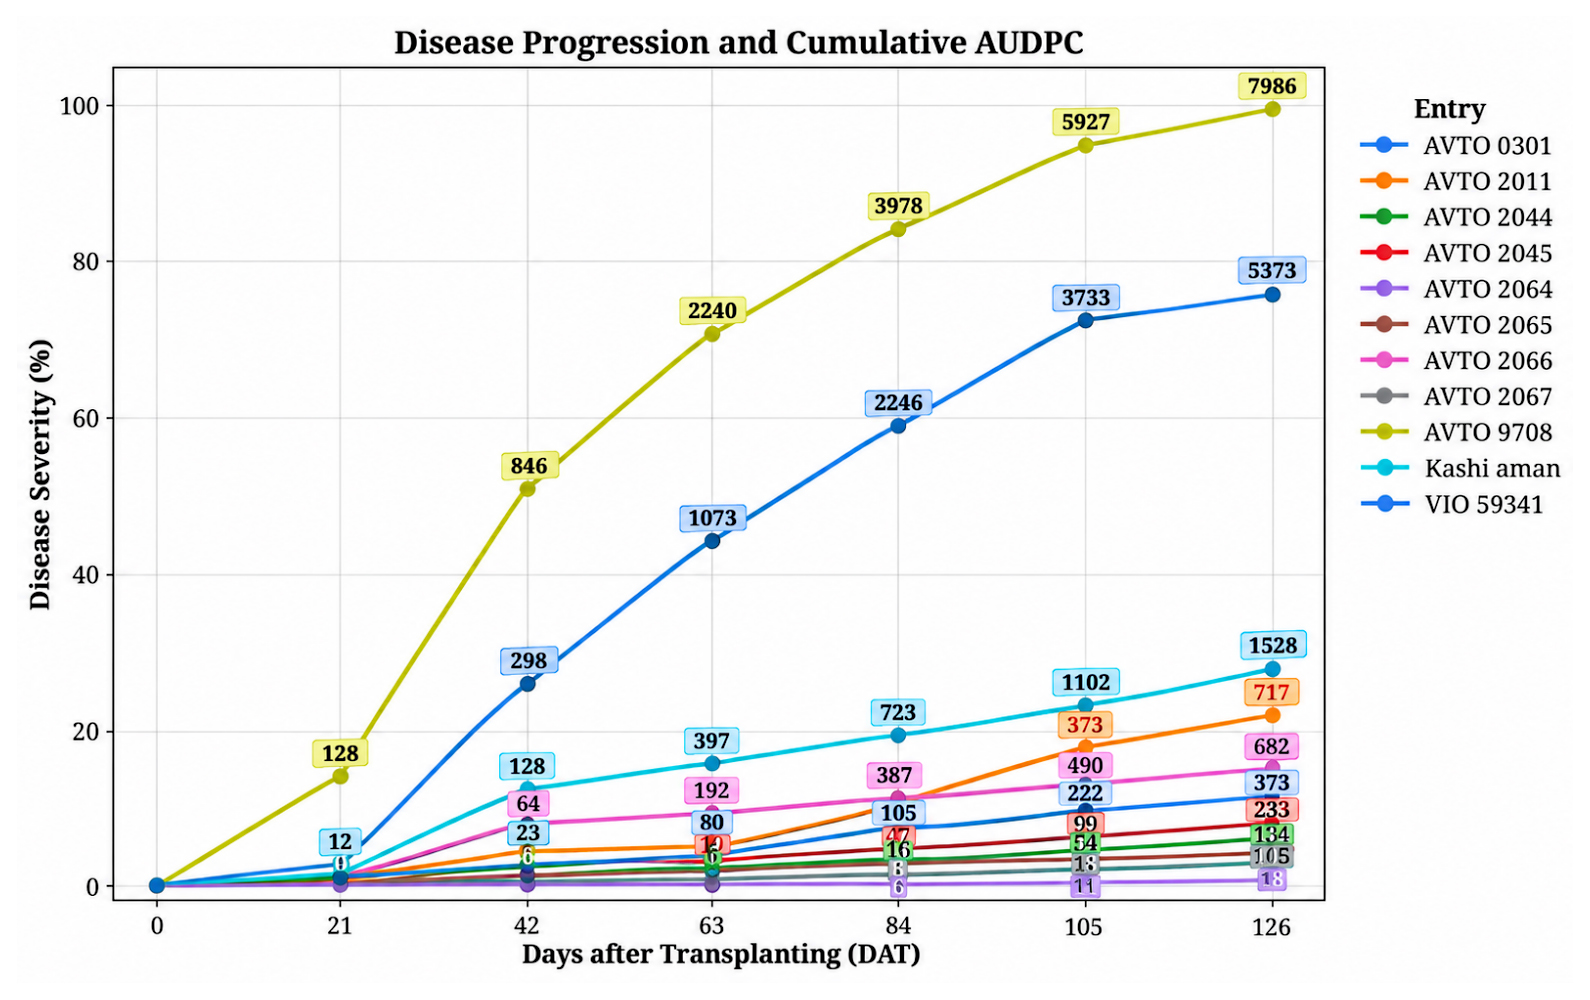 Figure 5. Conventional Tomato lines wise AUDPC calculated from plot-level disease-severity percentages across 21–126 DAT. Higher values indicate greater cumulative disease severity over the assessment interval.
Randomized complete block analysis of square-root-transformed plot AUDPC values demonstrated substantial line-to-line variation (F10,20 = 44.93, P < 0.001; LSD = 12.39 on transformed scale; CV = 25.71%), whereas block effects were not significant (F2,20 = 3.20, P = 0.062) (Table 4). Diagnostic evaluations supported normal residual distributions (Shapiro–Wilk P = 0.609; Levene P = 0.949), and line effects were further supported by permutation testing (P < 0.001) and the Friedman rank test (P = 0.003). The highest AUDPC occurred in AVTO 9708 (7986 %·days; rAUDPC = 0.75), followed by AVTO 0301 (5373 %·days; rAUDPC = 0.51) and Kashi Aman (1528 %·days; rAUDPC = 0.14) (Figure 5, Table 4). Moderate AUDPC values were recorded in AVTO 2011 (717 %·days; rAUDPC = 0.068), AVTO 2066 (682 %·days; rAUDPC = 0.065), and VIO 59341 (373 %·days; rAUDPC = 0.036). Minimal progression was documented for AVTO 2064 (18 %·days; rAUDPC = 0.0017), AVTO 2065 (117 %·days; rAUDPC = 0.011), AVTO 2044 (134 %·days; rAUDPC = 0.012), AVTO 2067 (193 %·days; rAUDPC = 0.018), and AVTO 2045 (233 %·days; rAUDPC = 0.022).
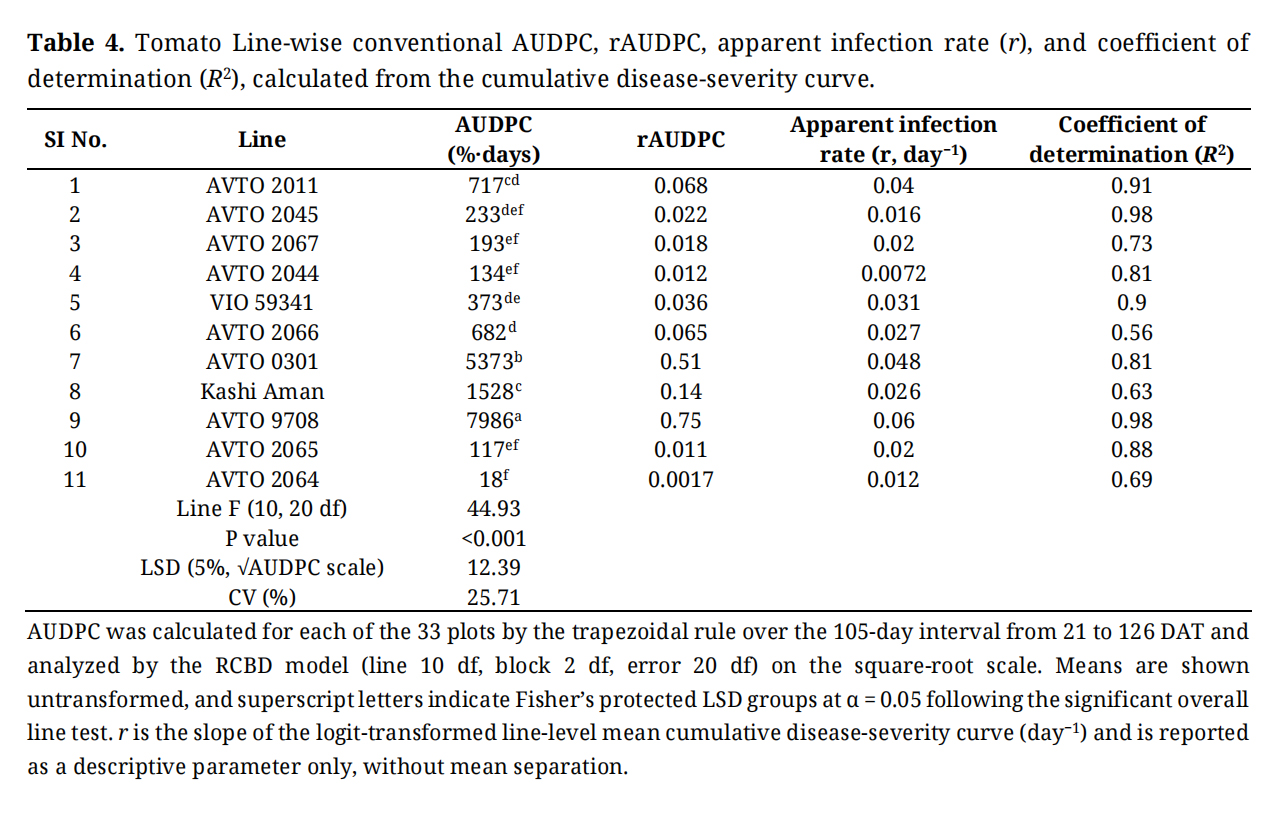 Table 4. Tomato Line-wise conventional AUDPC, rAUDPC, apparent infection rate (r), and coefficient of determination (R2), calculated from the cumulative disease-severity curve.
The apparent infection rate (r) and R2 were estimated alongside the AUDPC values (Table 4). AVTO 9708 displayed the steepest rate (r = 0.060 day−1; R2 = 0.98), followed by AVTO 0301 (0.048 day−1; R2 = 0.81). AVTO 2011 (0.040 day−1; R2 = 0.91) and VIO 59341 (0.031 day−1; R2 = 0.90) exhibited intermediate slopes but lower AUDPC, as symptom development was constrained early in the season. Among lines with suppressed AUDPC, AVTO 2044 recorded the lowest slope (0.0072 day−1; R2 = 0.81); AVTO 2064 (0.012 day−1; R2 = 0.69) exhibited no symptoms prior to 84 DAT and minimal progression thereafter (Figure 6); whereas AVTO 2045 (0.016 day−1; R2 = 0.98) and AVTO 2067 (0.020 day−1; R2 = 0.73) accumulated disease gradually over time. High coefficients of determination indicated strong logit-linear progression (AVTO 9708 and AVTO 2045, both 0.98), whereas lower values were noted in AVTO 2066 (0.56), Kashi Aman (0.63), AVTO 2064 (0.69), and AVTO 2067 (0.73), reflecting poorer fit to standard logistic growth.
Taken together, AUDPC, rAUDPC, r, and R2 indicate that susceptible genotypes sustained early, rapid disease accumulation, whereas resistant selections suppressed overall disease development through delayed onset or reduced rates of spread (Figure 5, Table 4). These epidemiological metrics describe the temporal dynamics observed in this trial but do not establish underlying genetic mechanisms conferring host resistance.
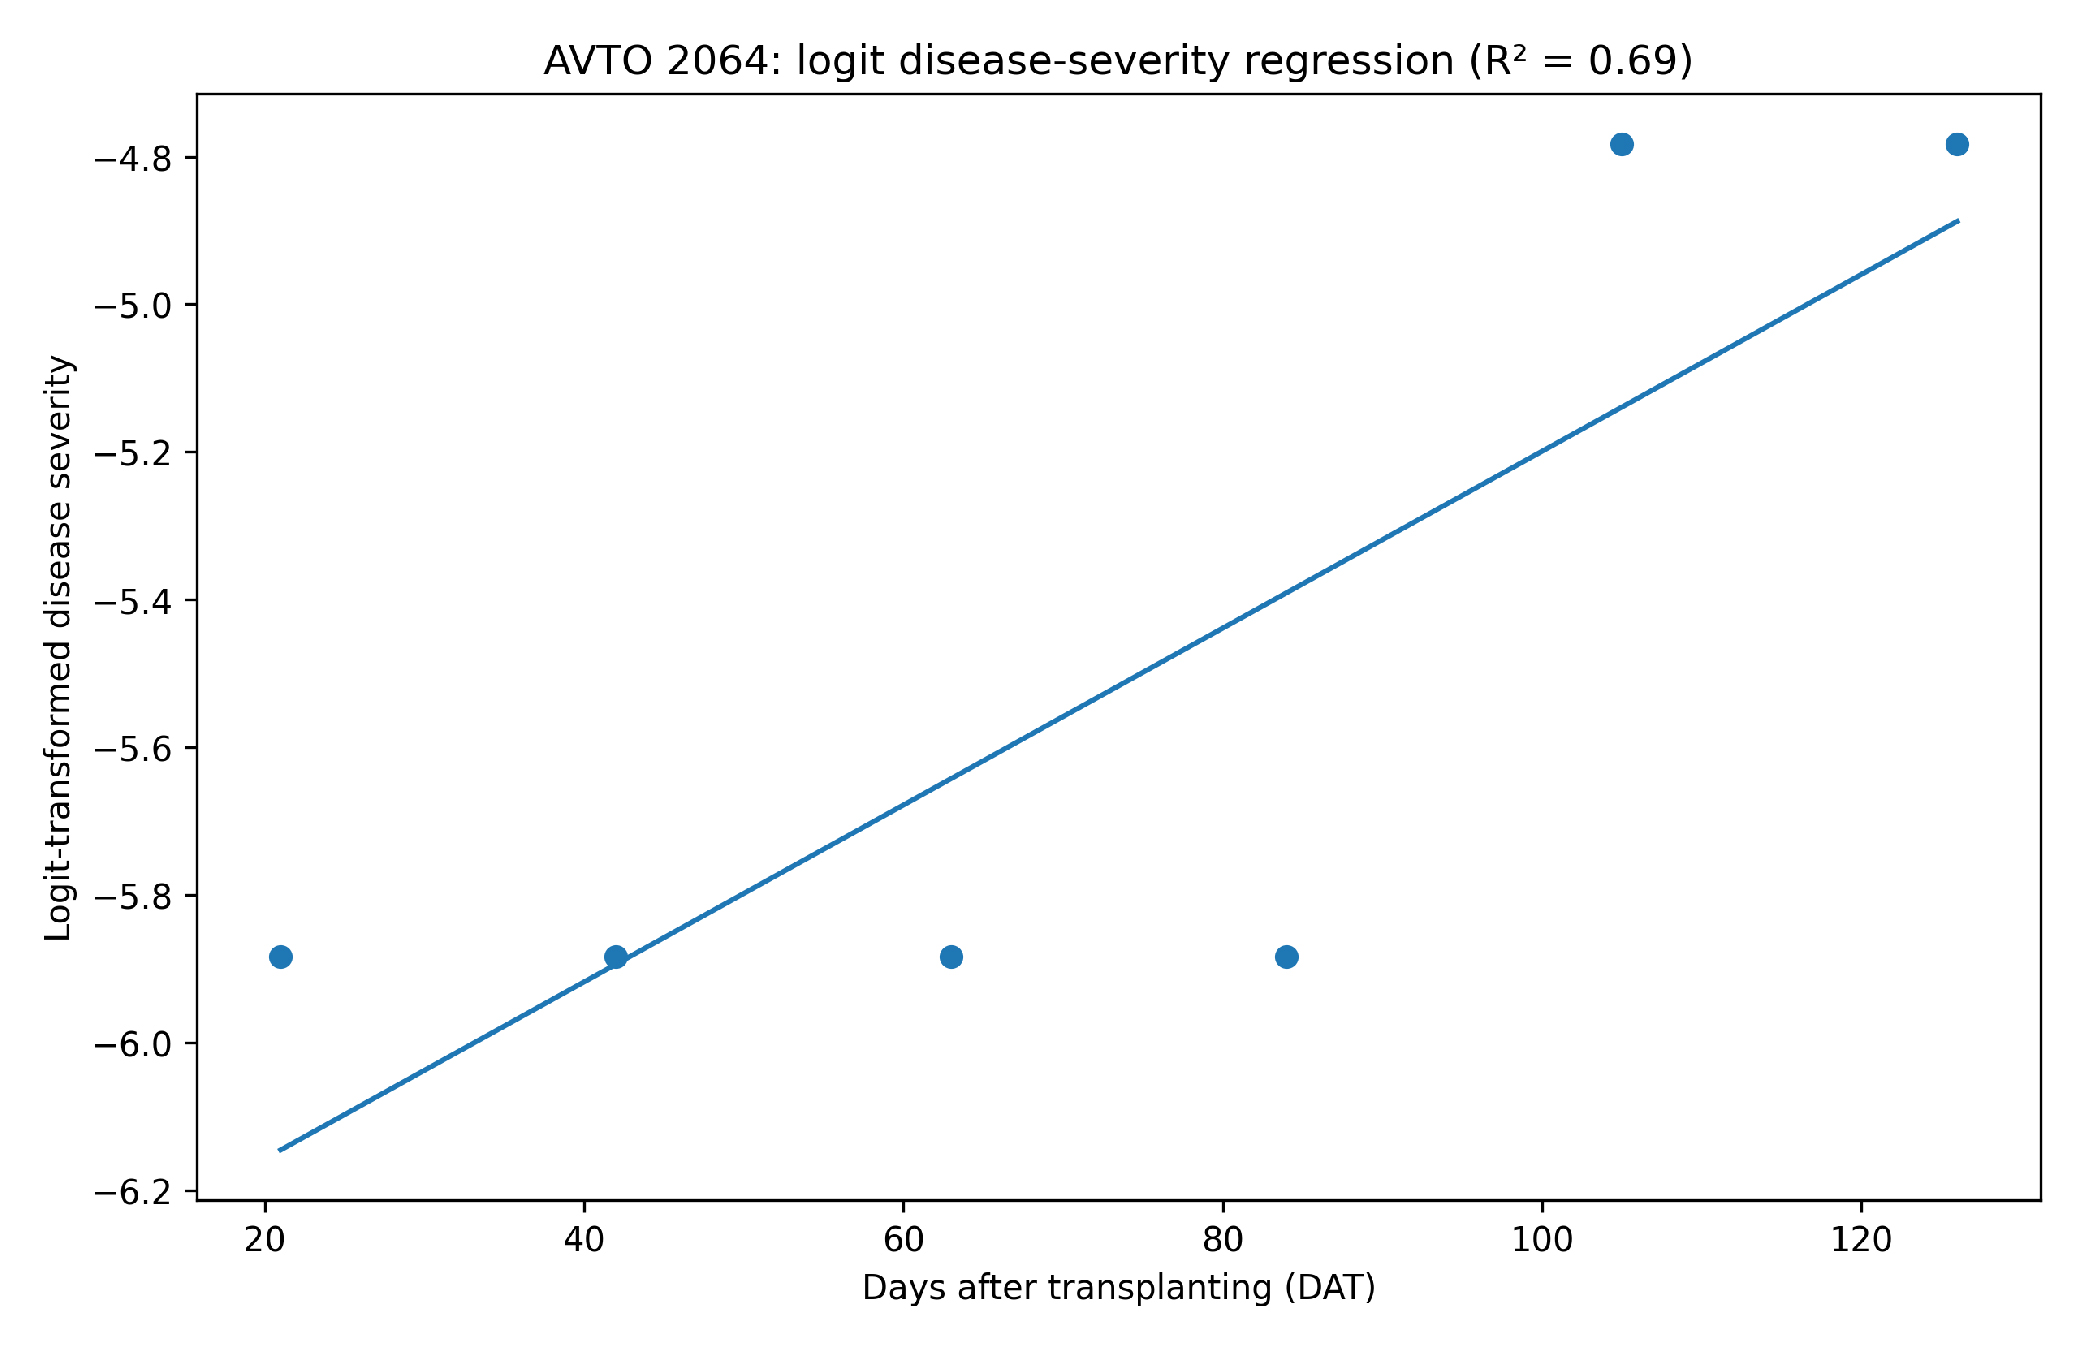 Figure 6. Logit-transformed disease severity of AVTO 2064 plotted against DAT with a linear regression fit. Dots represent the logit-transformed mean cumulative disease severity at each of the six assessment dates (21, 42, 63, 84, 105, and 126 DAT). A 0.5-count continuity correction was applied before logit transformation because early observations included zero disease; R2 = 0.69.
Nucleotide BLAST analysis of the cloned amplicons (File S1) revealed strong sequence homology with DNA-A components of the ToLCNDV lineage. The top alignment was to a reference ToLCNDV DNA-A accession (IG-DG region; bit score 1208, 81% query coverage, 96.57% sequence identity). Additional ToLCNDV DNA-A matches had bit scores of 1105–1116, query coverage of 78%–81%, and nucleotide identities of 94.2%–95.5%. These comparisons confirm that partial DNA-A fragments closely matching ToLCNDV were successfully amplified from the evaluated symptomatic leaf samples.
The recovered PCR amplicons mapped to conserved regions of DNA-A. Because molecular characterization was restricted to partial DNA-A segments, without amplification, sequencing, or analysis of the DNA-B genome, these data are insufficient to demonstrate a full bipartite ToLCNDV genome or to rule out co-infections. Consequently, the field responses documented here are described as disease symptoms associated with a ToLCNDV related begomovirus rather than verified strain specific infection or absolute genetic resistance.
Overall, lines harbouring reported Ty-2 + Ty-3/Ty-3a + ty-5 gene combinations showed lower incidence, severity, and AUDPC than Kashi Aman, AVTO 0301, and the susceptible control (AVTO 9708), and were statistically comparable to VIO 59341 and AVTO 2045 (Tables 1–4). These trends are preliminary phenotypic responses linked to historical marker profiles. Because natural vector transmission is uncontrolled and non-uniform, the observed field differences cannot be definitively assigned to individual Ty loci; host genetic background, uneven vector feeding pressure, and asymptomatic viral persistence may also have contributed.
Begomoviruses traditionally possess bipartite genomes (DNA-A and DNA-B); however, in this study, only a partial DNA-A component was characterized. Consequently, the causality or complete genomic organization cannot be definitively attributed to ToLCNDV, and the identified strain is referred to as a ToLCNDV related begomovirus
Field Performance of Lines with Different Reported Ty Marker ProfilesIn an endemic hotspot under intense natural whitefly vector transmission, tomato lines featuring stacked Ty-2 + Ty-3/Ty-3a + ty-5 marker profiles showed better phenotypic protection than single-locus lines and the controls. This pronounced suppression of disease incidence and severity may reflect complementary, non-overlapping resistance mechanisms acting at different stages of the viral infection cycle. The Ty-1/Ty-3 locus encodes a DFDGD-class RNA-dependent RNA polymerase (RdRP) that amplifies small interfering RNAs (siRNAs) to direct transcriptional gene silencing (TGS) via hypermethylation of geminiviral DNA promoters [14]. In contrast, the recessive ty-5 allele corresponds to a loss-of-function mutation in the eukaryotic translation elongation factor-like protein Pelota, which disrupts ribosome recycling and mRNA surveillance required for efficient translation of viral proteins [19]. When co-expressed with Ty-2, an NB-LRR resistance gene analogue targeting viral effector proteins [16], this multi-tiered defence restricts nuclear viral DNA replication, viral protein translation, and systemic movement concurrently [20–22].
The single-locus entries showed variable and generally insufficient protection under high vector inoculum, underscoring the limitations of deploying single genes against monopartite and bipartite begomoviruses. AVTO 0301 (carrying Ty-2) developed high cumulative severity (49.17%), consistent with previous reports that Ty-2 alone is ineffective against diverse Indian ToLCNDV strains, owing to isolate-specific suppression of host defences [22,27]. Kashi Aman (Ty-3) provided moderate suppression (13.89% severity), but remained susceptible to late-season symptom escalation as viral titers accumulated. In contrast, entries pyramided with Ty-2 + Ty-3/Ty-3a + ty-5 (AVTO 2044, AVTO 2064, AVTO 2065, and AVTO 2067) restricted mean severity to 0.19%–1.76%, suggesting that pyramiding recessive translational resistance (ty-5) with epigenetic silencing machinery (Ty-3) may create a robust barrier against begomovirus replication under field conditions [18,21]. Interestingly, AVTO 2011 (Ty-1) also maintained low severity (7.22%), suggesting that favourable genetic backgrounds or minor quantitative trait loci (QTLs) may modulate the efficacy of individual Ty introgressions [10,15]. These results support the view that stacking distinct, mechanistically complementary resistance genes is important for breeding durable tomato cultivars able to withstand evolving begomoviruses in India.
Genetic Background Effects on ty-5-Mediated ResistanceWithin both evaluated sister-line pairings, genotypes harbouring the reported ty-5 introgression showed reduced symptom severity (Figure 4). However, statistical separation of seasonal means was limited to a single contrast: AVTO 2067 had significantly lower severity than AVTO 2066, whereas AVTO 2044 and AVTO 2045 did not differ (Table 1). Because this sister line pairs lacked confirmed near-isogenicity and were subjected to natural vector-mediated inoculation under field conditions, these comparisons remain consistent with, but do not definitively confirm, a functional role for the ty-5 recessive allele. Furthermore, given the recessive nature of ty-5, homozygous state verification remains necessary.
The lines with the strongest disease suppression (AVTO 2044, AVTO 2064, AVTO 2065, and AVTO 2067) all contained the reported ty-5 marker stacked with Ty-2 and Ty-3/Ty-3a. Previous studies [22] show that stacking multiple Ty loci enhances resistance to begomoviruses. Gill et al. (2019) [18] established that Ty-6 conferred protection against monopartite and bipartite begomoviruses, and pyramiding Ty-6 with Ty-3 or ty-5 augmented resistance against TYLCV. In the present trial, VIO 59341 (ty-5 + Ty-6) had higher mean incidence and severity than the Ty-2 + Ty-3/Ty-3a + ty-5 lines, though seasonal means did not differ significantly (Table 1). These phenotypic patterns align with the premise that multi-locus combinations provide effective field protection. However, viral replication rates, RNA silencing dynamics, Pelota activity, transcriptional profiling, and inter-locus genetic interactions were not quantified; thus, any functional interplay between ty-5 (Pelota) and Ty-3 (RNA-dependent RNA polymerase) reflects the literature rather than an empirically demonstrated mechanism [19]. Genetic combinations incorporating Ty-6 require evaluation across diverse locations, growing seasons, and characterized ToLCNDV isolates before broad-spectrum, durable resistance can be conclusively established.
Disease Progress DynamicsUsing temporal epidemiological parameters, rather than relying solely on single terminal assessments, provided insight into the disease dynamics of lines carrying pyramided Ty combinations under intense field conditions. Combining integrated and rate-derived metrics, including AUDPC, relative AUDPC, apparent infection rate (r), and goodness-of-fit R2, revealed that multi-locus resistant lines not only delayed initial symptom onset but also substantially reduced epidemic velocity and total cumulative disease pressure. As in related field screenings of stacked-introgression genotypes under severe begomovirus exposure [50], monitoring cumulative disease progress throughout the season helped to distinguish broad-spectrum field protection from localized disease escape.
The pronounced variation in cumulative disease accumulation ranging from 7986 %·days in the susceptible control AVTO 9708 to 18 %·days in the pyramided line AVTO 2064 underscores the enhanced resolution offered by AUDPC relative to single terminal observations [27]. Under polycyclic begomovirus epidemics facilitated by continuous whitefly vector movement, integrated parameters capture the vulnerability of lines that show delayed but rapid late-season symptom progression [20]. Likewise, estimated apparent infection rates (r) suggest that combining distinct resistance mechanisms suppresses secondary virus spread across plant canopies, consistent with quantitative epidemiological studies [33,34] showing that stacked genetic defence acts primarily by reducing disease progress rates rather than entirely blocking initial vector transmission. Lower coefficients of determination (R2) in highly resistant lines further indicate non-linear disease development marked by extended latency and erratic symptom expression, suggesting that pyramided marker profiles alter typical logistic epidemic curves under natural disease pressure.
Methodological ConstraintsSeveral limitations should be considered when interpreting these results. Because vector transmission relied on free-moving whiteflies, observed differences among lines might reflect localized escape, uneven vector preference, or delayed inoculation rather than absolute genetic immunity, and asymptomatic systemic infection levels remained unquantified. The designated Ty introgressions were inferred from pedigree records without allele confirmation, which is essential for verifying homozygosity at the recessive ty-5 locus. Most marker groups comprised only one or two lines (except GN5), confounding marker effects with host genetic background, and the evaluated sister-line pairings lacked verified near-isogenicity. In addition, molecular identification was restricted to short DNA-A segments. Because field screening was limited to a single season and location, with three replications and visual disease ratings only, key traits, including agronomic yield, fruit quality, durable field performance, and multi-environment stability, require further evaluation.
In a single-season, replicated open-field screening at the Varanasi hotspot for leaf curl disease, the advanced tomato lines diverged markedly in disease incidence, visual severity, and AUDPC under intense ToLCNDV-related begomovirus exposure. Notably, four advanced lines harbouring reported Ty-2 + Ty-3/Ty-3a + ty-5 marker combinations showed pronounced symptom suppression, with mean cumulative severity of 0.19%–1.76% across six evaluation dates. These pyramided F8 lines significantly outperformed AVTO 0301, Kashi Aman, and the susceptible control AVTO 9708 but were statistically comparable to AVTO 2045 (Ty-2 + Ty-3) and VIO 59341 (ty-5 + Ty-6). In addition, PCR amplification confirmed partial DNA-A fragments closely matching ToLCNDV in symptomatic plants. Given the limitations of natural whitefly inoculation, pedigree-derived marker designations, and a single-location, single-season evaluation, these preliminary phenotypic responses characterize field performance without establishing gene-action mechanisms, isolate-specific immunity, or long-term durability. Following genotyping, controlled vector bioassays, and multi-location field trials, these elite lines have potential as donor parents for breeding tomato cultivars resistant to leaf-curl-causing begomoviruses in Indian tomato-growing regions.
The following supplementary materials are available online, Table S1: Molecular markers used to characterize reported Ty-1, Ty-2, Ty-3/Ty-3a, ty-5, and Ty-6 profiles; Table S2: Pedigree information for closely related sister inbred pairs AVTO 2044/AVTO 2045 and AVTO 2066/AVTO 2067; Table S3: Complete field disease incidence and severity raw scoring data; File S1: FASTA sequence reads, chromatograms, and sequence alignments.
All data generated in this study are included in the manuscript and its supplementary files.
SY: Conceptualization, Methodology, Formal Analysis, Research, and Writing Original Draft. AE: Conceptualization, Resources, Writing, Revision, Editing, Supervision, and Project Management. J-YY, Y-CH, and H-YC: Revision, Editing.
The authors declare that they have no conflicts of interest.
This work was funded by the Ministry of Agriculture, Taiwan [113AS-1.2.3-AS-04] and supported by long-term strategic donors to the World Vegetable Center, Taiwan: UK aid from the UK Government, the United States Agency for International Development (USAID), the Australian Centre for International Agricultural Research (ACIAR), Germany, Thailand, the Philippines, Korea, and Japan.
This study was conducted in close collaboration with the European Union Horizon 2020 Research and Innovation Program through the HARNESSTOM project [101000716]. We also thank the HARNESSTOM team for their invaluable support.
1.
2.
3.
4.
5.
6.
7.
8.
9.
10.
11.
12.
13.
14.
15.
16.
17.
18.
19.
20.
21.
22.
23.
24.
25.
26.
27.
28.
29.
30.
31.
32.
33.
34.
35.
36.
37.
38.
39.
40.
41.
42.
43.
44.
45.
46.
47.
48.
49.
50.
51.
52.
53.
54.
55.
Yerva S, Yen J-Y, Hsu Y-C, Chou H-Y, Eybishitz A. Evaluation of Field Performance of Tomato Lines Carrying Different Ty Marker Combinations Under ToLCNDV Related Begomovirus Pressure in an Indian Hotspot. Crop Breed Genet Genom. 2026;8(4):e260026. https://doi.org/10.20900/cbgg20260026.

Copyright © Hapres Co., Ltd. Privacy Policy | Terms and Conditions



