Location: Home >> Detail
Crop Breed Genet Genom. 2025;7(2):e250004. https://doi.org/10.20900/cbgg20250004
 ,
Tiegist Dejene Abebe 1,3 ,
Ermias Abate Desta 4 ,
Wuletaw Tadesse 5
,
Tiegist Dejene Abebe 1,3 ,
Ermias Abate Desta 4 ,
Wuletaw Tadesse 5
1 Department of Plant Sciences, College of Agriculture and Environmental Sciences, Bahir Dar University, Bahir Dar P.O. Box 79, Ethiopia
2 Amhara Regional Agricultural Research Institute, Crop Research Directorate, Bahir Dar P.O. Box 529, Ethiopia
3 Plant Breeding Department, University of Bonn, Kirschallee 1, Bonn 53115, Germany
4 Sasakawa Africa Association (SAA), Addis Ababa P.O. Box 24135, Ethiopia
5 International Center for Agricultural Research in the Dry Areas (ICARDA), Rabat P.O. Box 6299, Morocco
* Correspondence: Molla Mekonnen Kassie.
Ensuring the resilience and productivity of bread wheat (Triticum aestivum L.) across diverse environments is essential for sustainable food production, particularly in the context of climate change. However, genotype-by-environment interaction (GEI) significantly influences the selection of high-yielding and stable wheat genotypes across diverse environments. This study evaluated 250 bread wheat genotypes, including 240 elite lines from the International Center for Agricultural Research in the Dry Areas (ICARDA) and 10 released varieties in Ethiopia, across five environments during the 2022–2023 cropping season. The trials were conducted using an alpha lattice design with two replications, and agronomic traits, including grain yield, were analyzed using the Additive Main Effects and Multiplicative Interaction (AMMI) and Genotype + Genotype-by-Environment (GGE) biplot models. The analysis of variance revealed significant effects of genotype, environment, and their interaction on all measured traits. Environmental factors contributed the largest portion of the total variance, particularly for grain yield and plant height. The study identified G-180 and G-242 as the most stable genotypes across environments, demonstrating consistent performance and low genotype × environment interaction in both AMMI and GGE analyses. G-232 and G-234 were more specific to certain environments and might perform optimally in those settings but are less stable across diverse environments. Additionally, the study highlighted the importance of selecting genotypes based on mean yield and stability for breeding programs. The findings provide valuable insights into breeding strategies for wheat improvement, emphasizing the need for multi-environment trials in selecting resilient and high-yielding genotypes suitable for diverse agroecological zones.
Wheat (Triticum aestivum L. AABBDD: 2n = 6x = 42) is a critical cereal crop in global agriculture, with production surpassing 786 million tons (USDA, 2024), thereby serving as a staple food in numerous countries. It is a significant source of protein and calories, playing an essential role in human nutrition [1]. In Ethiopia, bread wheat cultivation is extensive and pivotal for food security, being the most important crop in the country and well-suited to various agro-ecological zones [2]. Ethiopian wheat production is conducted by smallholder farmers (SHF) in mid- and highland regions, ranging from 1500 m to 3200 m above sea level [3]. The Ethiopian government aims to achieve wheat self-sufficiency by expanding arable land, organizing farmers into agro-clusters, and enhancing irrigation-based wheat production during the dry season [4]. In the 2022 cropping season, wheat cultivation covered over 1.86 million hectares, involving 4.54 million SHF. The significance of wheat production in Ethiopia is substantial, contributing to the economic and nutritional well-being of its population. Its adaptability to diverse agro ecological conditions ensures sustainable cultivation across various regions of the country.
The average wheat productivity in Ethiopia is 3.1 t·ha−1, which is lower than the global average. This low yield is primarily attributed to the lack of high-performing varieties that can thrive in Ethiopia’s diverse wheat-growing regions [5,6]. Consequently, there is an urgent need to enhance wheat yields through a suitable breeding program, focusing on genetically resilient varieties capable of withstanding both biotic and abiotic stresses across different environments. To meet the country’s growing production needs, over 132 bread wheat varieties have been released or registered [7]. However, frequent disease outbreaks can rapidly overcome resistance genes in wheat varieties, necessitating regular variety turnovers. Significant genetic variability in source populations is essential to address the need for frequent variety replacements. Sufficient genetic diversity allows for the combination of novel traits that can withstand both biotic and abiotic stresses. To identify the most stable and high-performing varieties, breeding programs conduct multi-location trials with various advanced entries under diverse conditions, allowing for the assessment of genotype-by-environment interactions (GEI) and the development of effective breeding strategies. Common statistical methods for computing GEI include genotype + genotype-by-environment (GGE) biplot analysis, additive main effects, and multiplicative interaction (AMMI) analysis.
Conducting multi-environment trials with wheat germplasm sourced from ICARDA is expected to facilitate the development of improved wheat varieties by identifying genotypes that exhibit desirable agronomic traits and resistance to major diseases. This study aimed to evaluate phenotypic stability and genotype-environment interactions across various traits in a diverse group of elite and commercial bread wheat genotypes.
We hypothesize that significant genetic variability exists among the tested wheat genotypes and that certain genotypes will exhibit stable performance and broad adaptability across diverse environments, making them suitable candidates for breeding programs targeting both yield and resistance traits.
In this study, 250 bread wheat genotypes were evaluated under rainfed and irrigation conditions during the 2022–2023 cropping season in Ethiopia. These genotypes included 240 elite bread wheat genotypes from the International Center for Agricultural Research in the Dry Areas (ICARDA) wheat breeding program, as well as 10 bread wheat varieties that had been released in Ethiopia. ICARDA developed these elite wheat lines using shuttle breeding strategies to create desirable new varieties for Central and West Asia, North Africa, and Sub-Saharan Africa countries [8].
Field trials were conducted at four locations known for wheat production: Adet, Koga, Dabat, and Kulumsa (Table 1). Hereafter, the term ‘genotypes’ will be used to refer to both the elite breeding lines and released varieties.
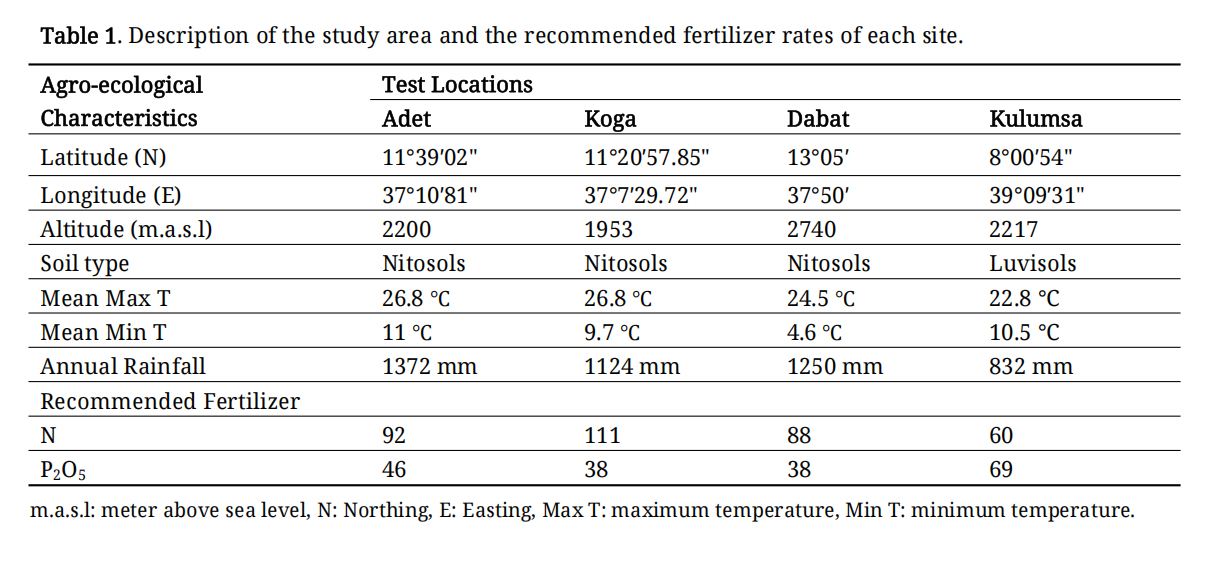 Table 1. Description of the study area and the recommended fertilizer rates of each site.
The field trials were laid out using an alpha lattice design with two replications, and genotypes were randomly assigned to each replication using R software. Each plot comprised two rows of genotypes, each 1 m long and spaced 0.2 m apart. To ensure an appropriate nutrient supply, fertilizers were applied to each plot based on the recommendations of the specific site. At planting, all recommended P2O5 and half of the recommended N were applied, while the remaining half of the N was applied at tillering stage. In the irrigation trial, furrow irrigation the most commonly used method in the region was employed. For the first four weeks, irrigation was applied at intervals of three to four days. Thereafter, irrigation was provided every seven days until 15 days before harvest, after which it was completely discontinued. Other agronomic practices were consistently implemented across the experimental area.
Measurements of Phenotypic TraitsThe phenotypic data were scored as days to heading (when the spikes of 50% of the plants were fully visible), plant height (average height of five plants measured from the ground to the tip of the spike excluding their own (cm)), spike length (average length of five spikes containing grains (cm)), and grain yield (gm/plot). This yield data was taken from the whole plot and converted to ton per hectare (t·ha−1) at 12.5% moisture content. Five plants per plot were randomly selected for traits scored at the individual plant level.
Data AnalysisThe phenotypic data from each trial and the combined environment were subjected to analysis using a Multi-environment Trial Analysis ‘metan’ software package in R [9]. The homogeneity of error variance was tested using Bartlett’s test in R statistical software. To investigate the genotype-environment interaction, the genotypes were considered fixed effects, while the test locations were treated as random effects. The stability parameters of the data were assessed using R statistical software. Additionally, the analysis of AMMI and GGE-biplot was performed using the R ‘metan’ software package.
The AMMI model is expressed by:
In this formula, 𝑌𝑖𝑗 denotes the yield of the ith genotype in the jth environment, μ represents the overall mean, while gi and ej are the j indicate the deviations of genotype and environment from the overall mean, respectively. The term 𝜆𝑘 is the square root of the eigen value of the PCA axis 𝑘, 𝛼𝑖𝑘 and 𝛾𝑗𝑘 are the principal component scores for PCA axis 𝑘 of the 𝑖th genotype and the 𝑗th environment, respectively, and εij is the residual term [10].
For each genotype, the AMMI stability value (ASV) was determined by evaluating the relative contributions of the principal component axis scores (IPCA1 and IPCA2) to the interaction sum of squares. The ASV as described by [11,12] was calculated as follows:
In this equation, IPCA1 Sum of squares/IPCA2 Sum of squares represents the weight assigned to the IPCA1-value, calculated by dividing the IPCA1 sum of squares by the IPCA2 sum of squares (obtained from the AMMI analysis of variance table). A genotype’s adaptation to a specific environment is indicated by a larger IPCA score, whether positive or negative. Conversely, lower ASV scores suggest a genotype exhibits greater stability across various environments [13].
The GGE-biplot model is
Where:
Yij is the expected yield of genotype i in environment j; µ is the grand mean of all observations; βj is the main effect of environment j; p1, and p2 are the singular values of first and second largest principal components, PC1 and PC2, respectively; the square of the singular value of a PC is the sum of squares explained by the PC; σi1 and σi2 are the eigenvectors of genotype for PC1 and PC2, respectively; and are the eigenvectors of environment for PC1 and PC2, respectively; and is the residue not explained by the primary and secondary effects.
Table 2 presents the mean performance, standard deviations, and ranges of genotypes for grain yield and phenotypic traits across five environments. The mean values of DH ranged from 57.0 days at Adet-2023 to 64.3 days at Kulumsa-2023. PH recorded its highest mean value (85.4 cm) at Adet-2023 and lowest (75.1 cm) at Koga-2023. Spike length showed notable variation among environments, with the longest average spike observed at Adet-2022 (9.1 cm) and the shortest at Dabat-2023 (7.82 cm). Grain yield exhibited the widest range of variability across all traits and environments, with mean values ranging from 2.2 t·ha−1 (Kulumsa-2023) to 3.23 t·ha−1 (Adet-2022).
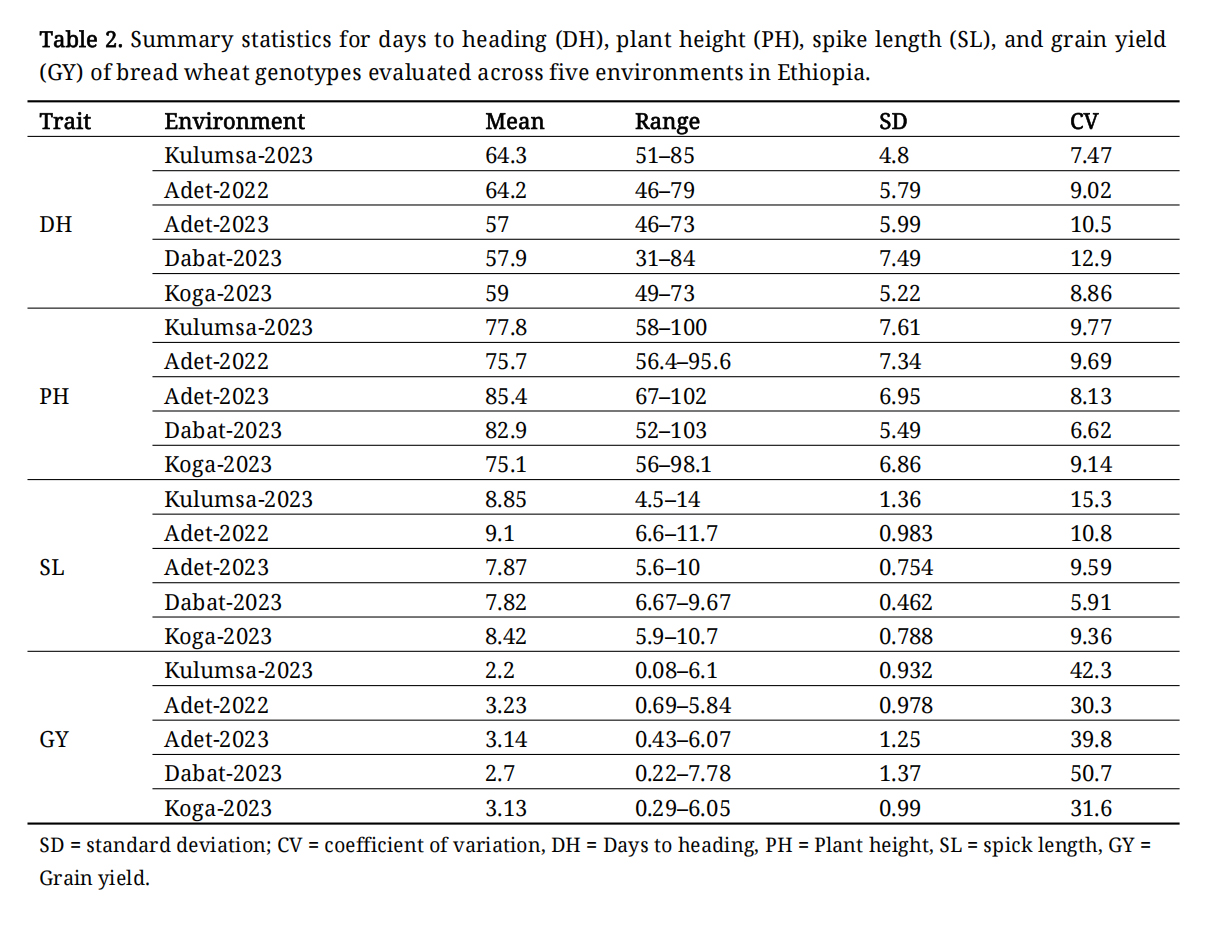 Table 2. Summary statistics for days to heading (DH), plant height (PH), spike length (SL), and grain yield (GY) of bread wheat genotypes evaluated across five environments in Ethiopia.
Significant differences among genotypes were observed across all five environments for all measured agronomic traits and grain yield, with the exception of spike length at Dabat (Table 3). Plant height and days to flowering exhibited the highest genotypic variance across all environments, whereas spike length showed the lowest genotypic variance.
The analysis of variance demonstrated a significant impact of GEI across all traits (Table 4). GEI accounted for 13%–47% of the total variation in various traits, as indicated by the percentage of the total sum of squares (PTSS) values from the AMMI analysis (Table 4).
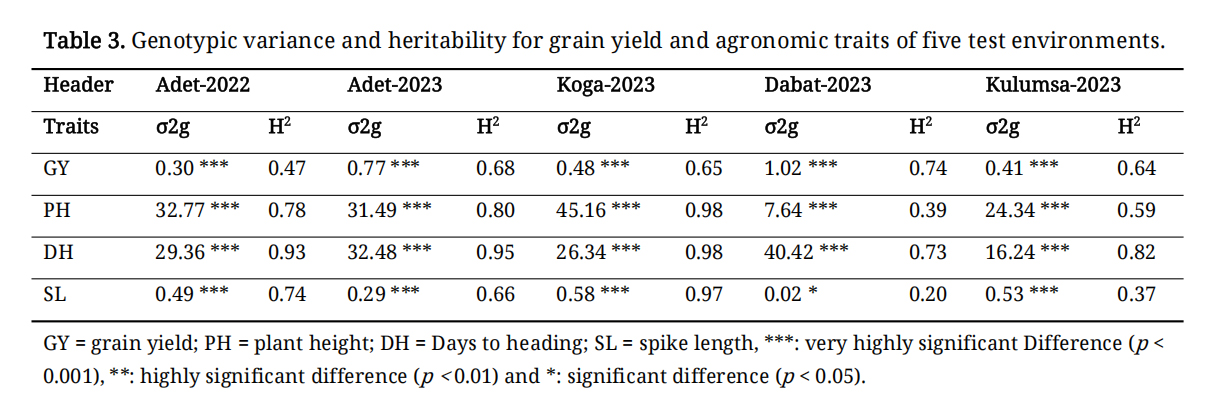 Table 3. Genotypic variance and heritability for grain yield and agronomic traits of five test environments.
The AMMI analysis revealed significant effects of genotype (G), environment (E), and genotype-environment interaction (GEI) on all phenotypic traits analyzed (Table 4). Among the sources of phenotypic variance (E, G, and GEI), the environment accounted for the largest variance for all traits, highlighting its critical role in determining phenotypic values (Table 4). The proportion of the total sum of squares attributed to the environment ranged from 13.89% for grain yield to 30.72% for plant height, underscoring the importance of growing conditions for the targeted traits. The first two interaction principal component analysis (IPCA) axes explained about 70.34% of the GEI across all the environments for grain yield.
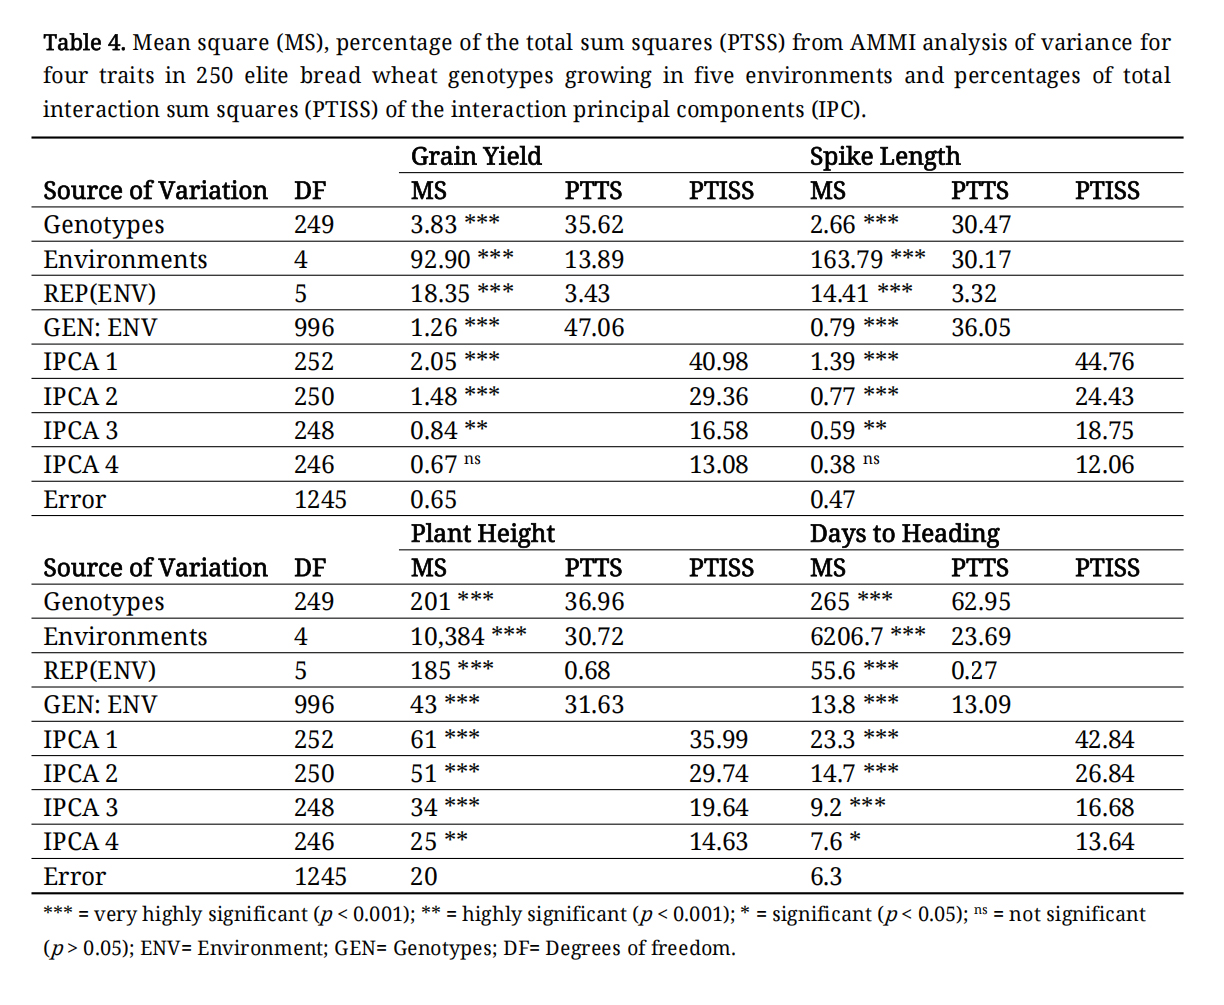 Table 4. Mean square (MS), percentage of the total sum squares (PTSS) from AMMI analysis of variance for four traits in 250 elite bread wheat genotypes growing in five environments and percentages of total interaction sum squares (PTISS) of the interaction principal components (IPC).
The mean grain yield of genotypes varied widely by location, from 0.26 t·ha−1 for genotype G-259 at Kulumsa to 6.68 t·ha−1 for genotype G-215 at Dabat. The average performance of genotypes differed across the five test locations, with the lowest and highest mean grain yields recorded at Kulumsa-2023 (2.2 t·ha−1) and Adet-2022 (3.23 t·ha−1), respectively (Table 5). The performance of agronomic traits also varied by location: plant height ranged from 75.09 cm in Koga-2023 to 85.43 cm in Adet-2023; spike length varied from 7.87 cm in Adet-2023 to 9.09 cm in Adet-2022; and days to heading ranged from 56.96 days in Adet-2022 to 64.28 days in Kulumsa-2023 (Table 5). The AMMI analysis identified the top four genotypes for all measured phenotypic traits at each test location. Typically, the top four genotypes varied across test locations for a specific trait (Table 5). However, genotype G-216 consistently ranked among the top four genotypes at both Kulumsa-2023 and Koga-2023.
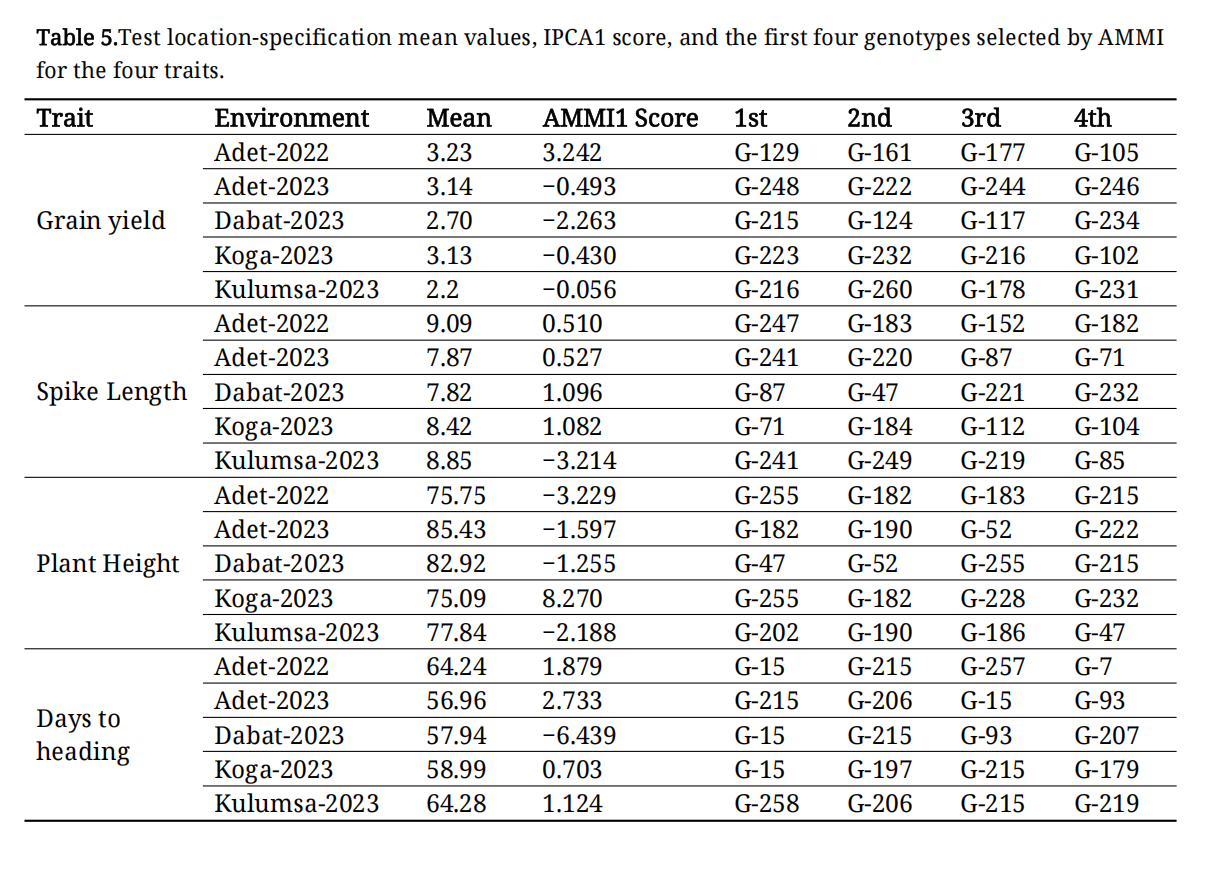 Table 5. Test location-specification mean values, IPCA1 score, and the first four genotypes selected by AMMI for the four traits.
The AMMI analysis is frequently employed to identify high-performing, stable genotypes, with an IPCA1 value close to zero indicating stability. The AMMI, additive main effects, and multiplicative interaction stability value (ASV) for grain yield of to 10% and bottom 10% of the genotypes is presented in Tables 6 and 7. The range of ASV value from 0.011 (G-82) to 1.35 (G-117) was observed for grain yield.
AMMI 1The AMMI biplots of the grain yield of 250 bread wheat genotypes across five locations are presented Figure 1A. In the current study, IPCA1 for grain yield explained 41% of the variation attributed to GEI (Figure 1). In this biplot, the horizontal axis represents the mean grain yield, while the vertical axis captures the interaction effects through IPCA1 scores. Genotypes positioned close to the x-axis and near the origin (IPCA1 ≈ 0) are considered more stable across environments, with minimal interaction effects. Several high-yielding genotypes across the test locations were found to have low IPCA1 values (between −0.2 and 0.2), including G-180, G-242, G-254, G-260, G-257, G-5, G-244, and G-178 as the most stable genotypes. In this study, genotypic stability was further assessed using the AMMI Stability Value (ASV) and Yield Stability Index (YSI). Genotypes G-180, G-260, and G-242 had ASV values below 0.23, indicating exceptional stability across environments. Similarly, these genotypes also recorded YSI scores below 100, reinforcing their desirability for both yield performance and stability. Genotypes with a low YSI, overlapping with those having a low ASV indicating their stability across test locations (Table 6).
AMMI 2The AMMI2 biplot (Figure 1B), which plots IPCA1 against IPCA2 (explaining an additional 29.4% of the GEI variance), provides a more nuanced view of specific and broad adaptability. In this biplot, environments Adet-2022 and Dabat-2023 are positioned furthest from the origin, and exhibited the highest IPCA1 (either positive or negative) for grain yield, making them suitable test sites for differentiating genotypes based on grain yield (Table 5), suggesting they possess strong discriminative ability, and thus are highly informative for identifying genotypic differences. These locations could serve as effective selection environments in future trials. Conversely, environments such as Koga and Kulumsa, which cluster near the origin, exhibited less GEI, implying greater environmental stability and limited capacity to discriminate among genotypes.
In terms of genotypic behavior, those located near the center of the biplot (origin) demonstrate general adaptability, showing minimal crossover interaction across environments. Meanwhile, genotypes positioned farther from the origin exhibit greater interaction effects and thus more specific adaptability to particular environments. Notably, genotype G-215, which was distantly located from the origin toward the positive IPCA1 axis, indicates possible specific adaptability to high-yielding or more favorable environments such as Dabat-2023.
Overall, the combination of AMMI1 and AMMI2 biplot analyses provides a comprehensive understanding of both the stability and adaptability of the tested bread wheat genotypes. Genotypes such as G-180, G-260, and G-242 are recommended for broader adaptation breeding, while environments like Adet-2022 and Dabat-2023 are key sites for future selection and testing efforts.
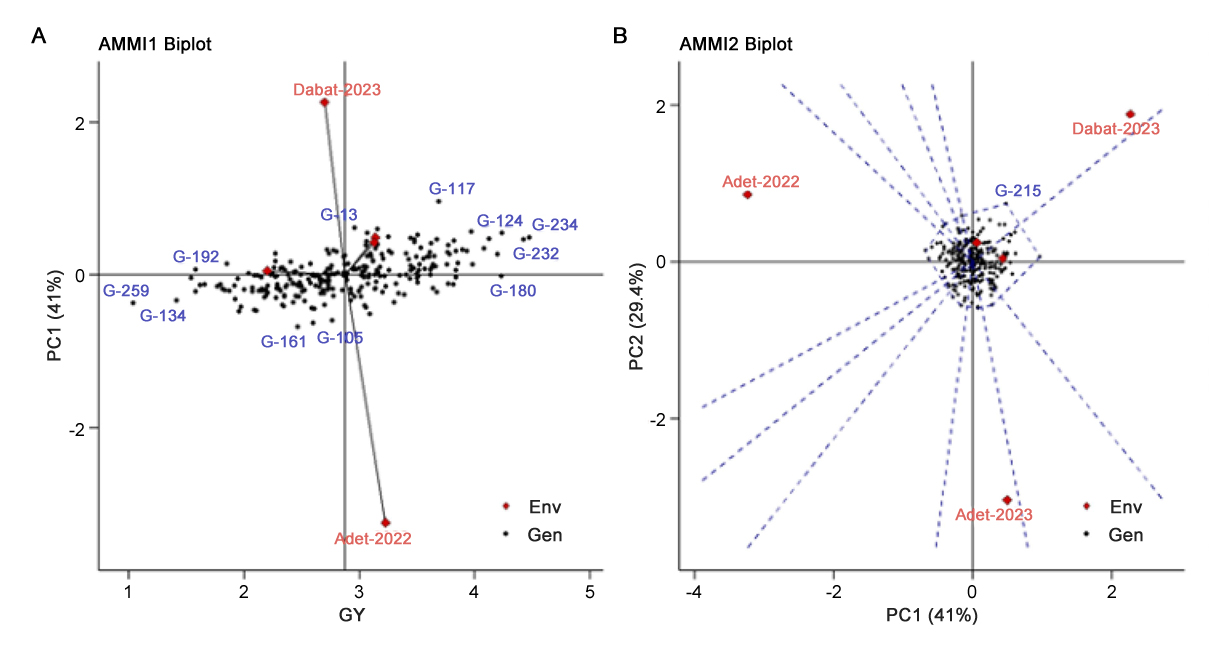 Figure 1. AMMI 1 (A) and AMMI2 (B) Biplot for the grain yield of 250 bread wheat genotypes and five locations respectively. Where, Env: Environment and Gen: Genotypes.
The GGE-biplot methodology offers breeders an enhanced approach for making selection decisions based on mean performance and stability. As illustrated in Figure 2A, 250 bread wheat genotypes were ranked according to mean grain yield performance and stability using an Average Environment Coordinate (AEC) on the genotype-focused biplot.
“Which-Won-Where” ApproachesFigure 2B depicts a which-won-where polygon view of the biplot, illustrating the environments in which each wheat genotype exhibited optimal performance. The biplots accounted for approximately 69.11% of the total variation in grain yield, attributed to genotype and genotype-environment interaction (GEI). The genotypes located at the vertices of each sector in the biplot were the highest performers in the respective environments. Genotypes positioned closer to the center of the biplot demonstrated high stability compared to those at the vertices. The polygonal representation of the GGE-biplot identified G-225, G-117, G-234, G-232, G-106, G-258, G-138, G-104, G-259, and G-240 as the genotypes most responsive to environmental interactions for grain yield, as they occupied the vertices of the polygon. Genotypes situated within the polygon exhibited low responsiveness to environmental interactions.
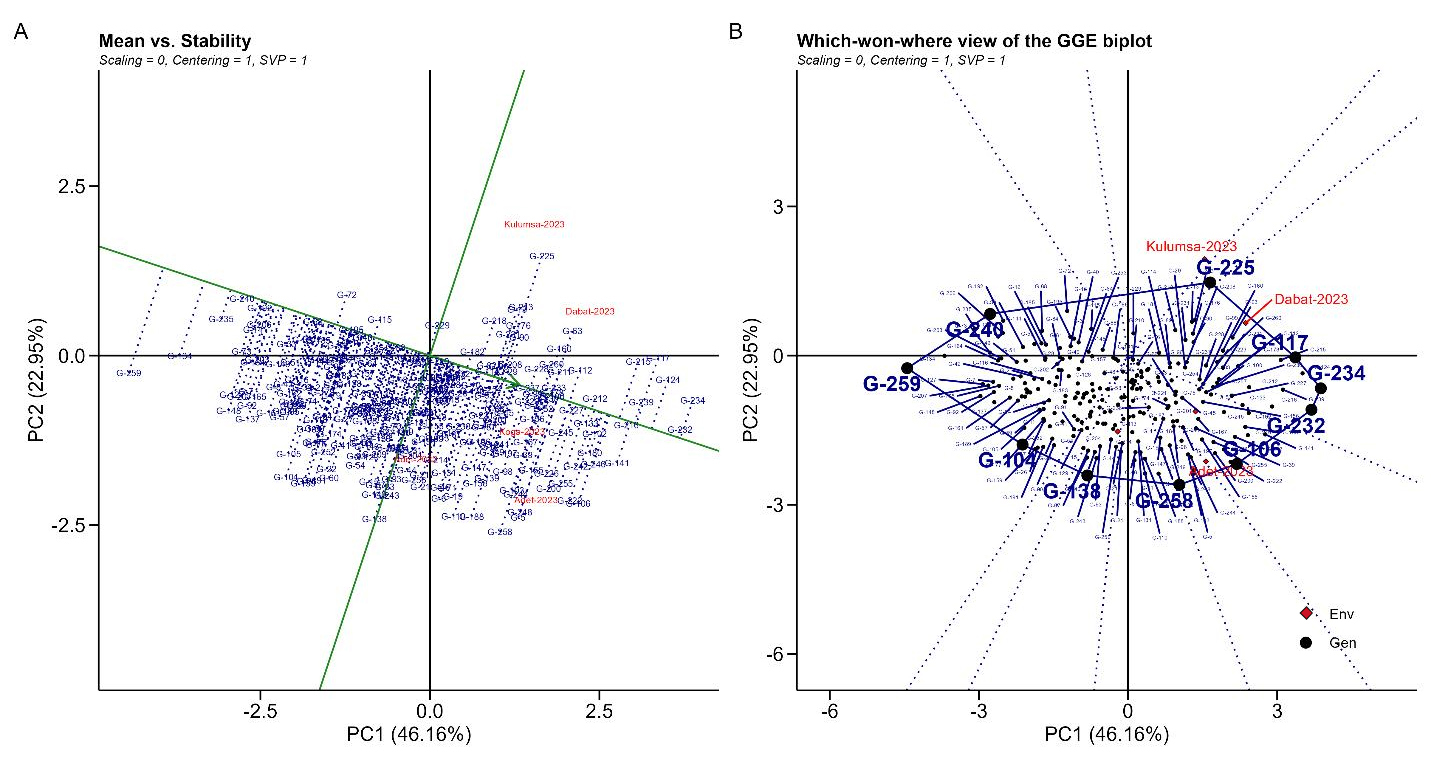 Figure 2. GGE-biplot for grain yield showing ranking genotypes (A) Means vs. Stability (B) Which-won where of the GGE biplot under five test locations for yield and stability performance. Where, Env: Environment and Gen: Genotypes.
When the single value portioning is set to one (SVP = 1), the average environment coordinate (AEC) line intersects the origin of the biplot. The “mean vs stability” perspective, commonly referred to as AEC and SVP, facilitates the evaluation of genotypes by focusing on average performance and stability across diverse environmental conditions (Figure 2A). The biplot comprises two lines: (i) the AEC ordinate and (ii) the AEC abscissa. The arrow on the first line in Figure 2A indicates superior mean performance for the trait under investigation. It is noted that G-234 attained the highest grain yield, whereas G-259 exhibited the lowest. G-232, G-216, and G-212 demonstrated both high grain yield and stability, as they are positioned on the AEC abscissa with minimal projection onto the AEC ordinate.
Performance of Genotypes and Genotypic VariationThe performance of genotypes and genotypic variation was significant, with mean grain yield ranging from 2.1 to 4.5 (as shown in Tables 6 and 7). The genotypes G-137, G-2, G-7, G-42, G-169, G-68, G-149, G-207, G-148, and G-51 were among the lowest-performing genotypes (Table 7), whereas G-234, G-232, G-124, G-180, G-216, G-2015, G-141, G-242, G-239, and G-212 were among the top-performing genotypes in terms of mean grain yield (Table 6). The AMMI1 analysis of grain yield revealed that G-117, G-161, G-105, G-13, and G-225 had higher IPCA1 values than the other genotypes, making them more significant contributors to the overall GEI. In contrast, G-234, G-232, G-124, G-180, G-216, and G-215 exhibited the highest mean grain yields with lower IPCA1 values.
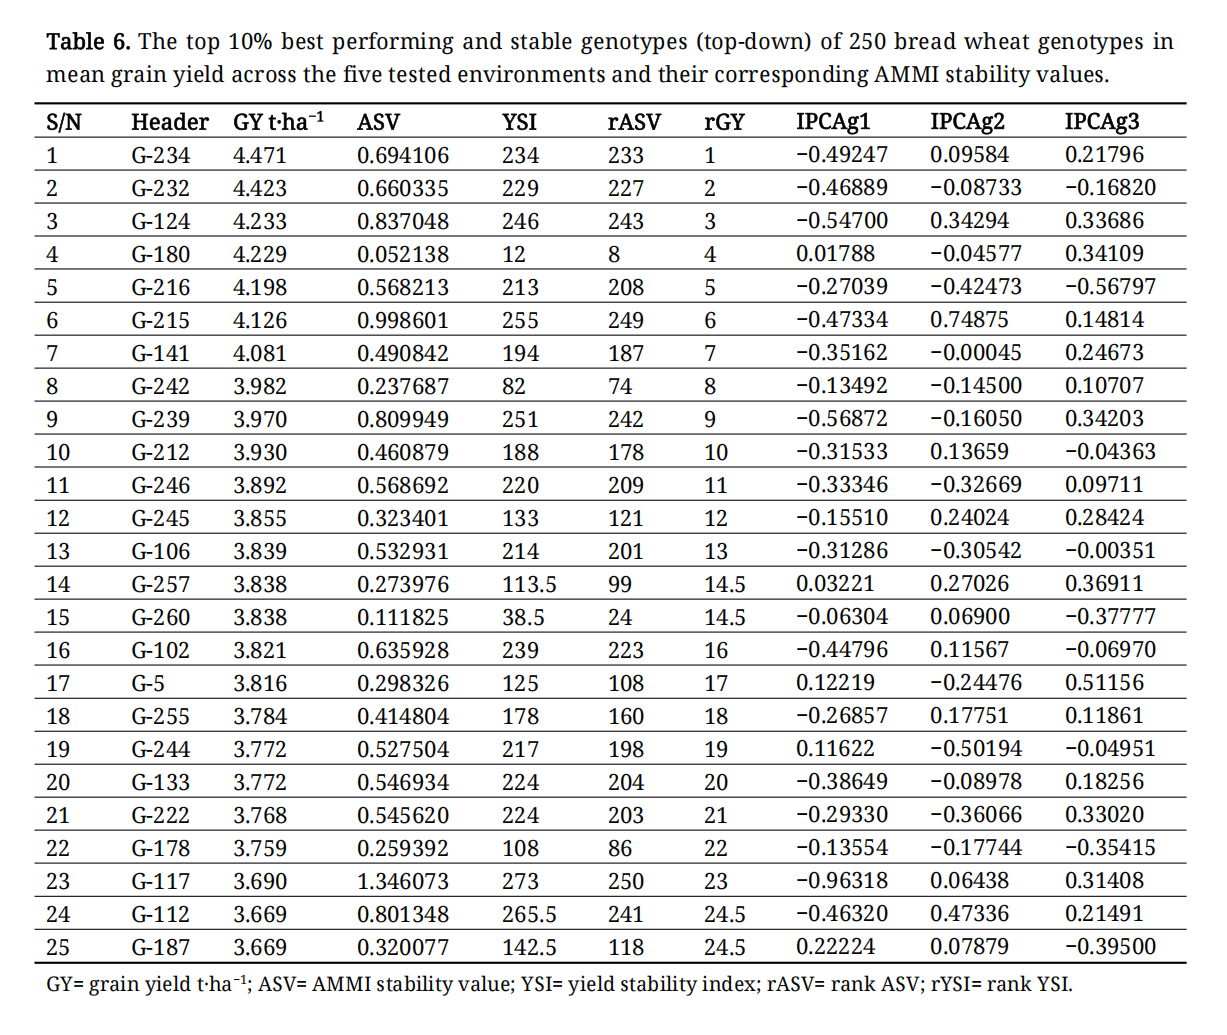 Table 6. The top 10% best performing and stable genotypes (top-down) of 250 bread wheat genotypes in mean grain yield across the five tested environments and their corresponding AMMI stability values.
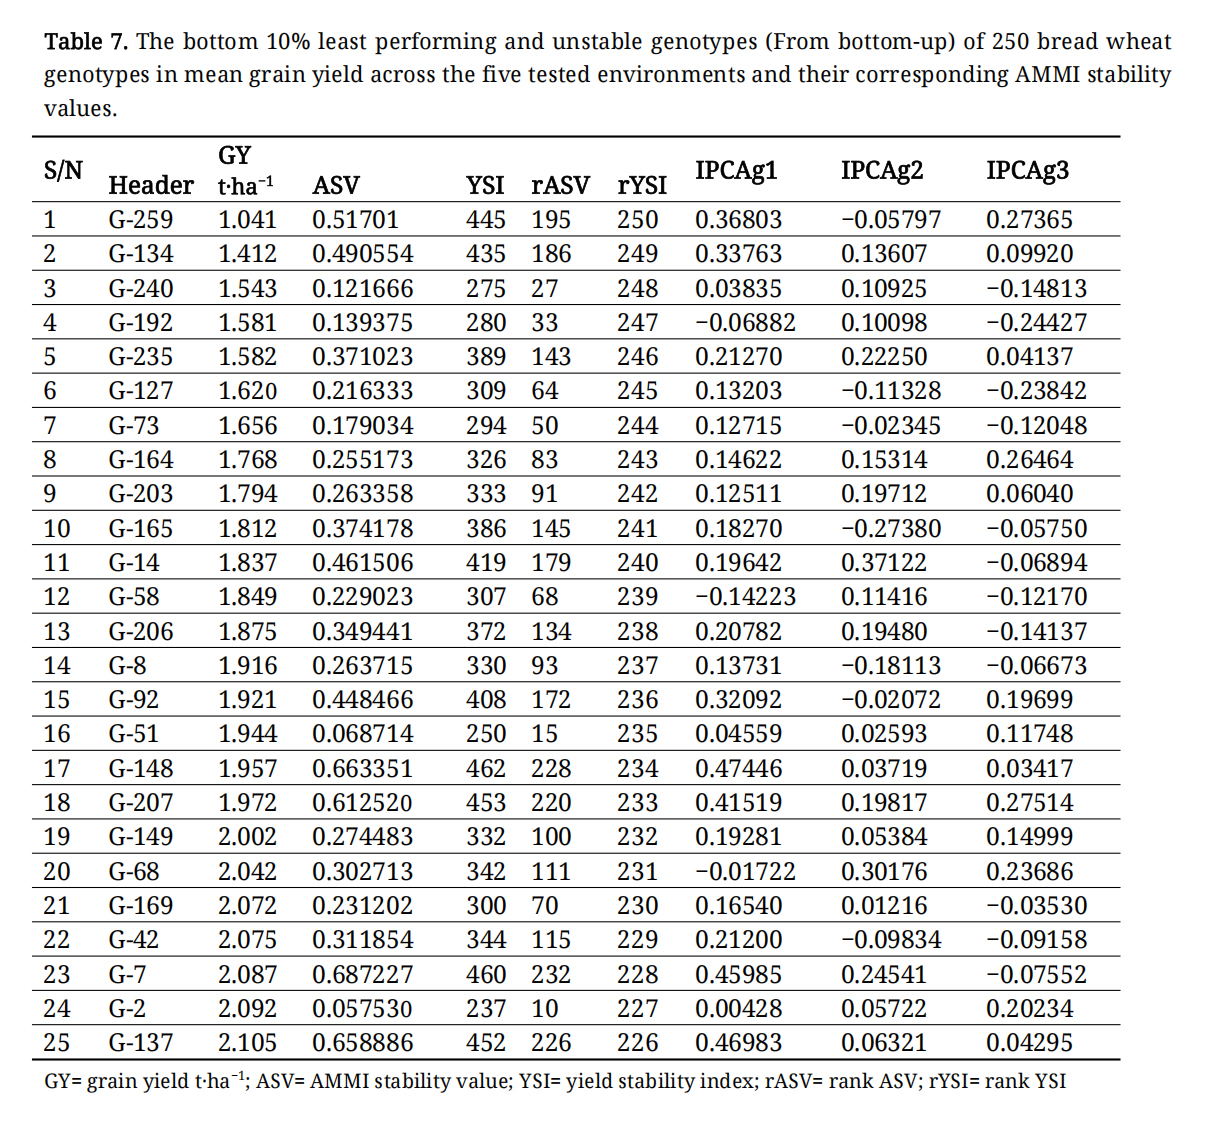 Table 7. The bottom 10% least performing and unstable genotypes (From bottom-up) of 250 bread wheat genotypes in mean grain yield across the five tested environments and their corresponding AMMI stability values.
The primary objective of a plant breeder is to identify favorable genotypes through the analysis of data from trials conducted in various environments to develop a variety that exhibits both high yield potential and consistent performance under diverse environmental conditions [14,15]. The use of appropriate statistical models and methodologies aids in forecasting the mean performance of genotypes across multiple environments, thus enabling the identification of high-performance genotypes with broad adaptability [16,17]. The current study was conducted to determine the genotypic variability among bread wheat genotypes tested for grain yield and other agronomic traits and to assess the impact of GEI.
Genetic variation is pivotal in crop breeding programs, facilitating the development of new varieties with enhanced grain yield potential and stability across diverse climatic conditions [18,19]. The analysis of variance indicated significant differences among the tested genotypes for all agronomic traits in each environment. Combined ANOVA further confirmed that genotype, location, and their interaction significantly affected grain yield and other agronomic traits. Similarly, [6,20,21] reported substantial genetic variability in grain yield and other agronomic traits among bread wheat genotypes in Ethiopia. The pronounced impact of highly significant genotype-environment interaction (GEI) on the ranking order of the tested genotypes across environments highlights the importance of multi-environmental trials for identifying and selecting superior genotypes [22]. The presence of a crossover interaction necessitates the consideration of both genotype (G) and GEI when evaluating and selecting wheat genotypes for grain yield. This aligns with previous research [23,24], which demonstrated through GGE-biplot analysis the significance of G+GE on the yield performance of the tested genotypes. The GGE-biplot accounted for 70.04% of the total G+GE variation.
Previous research has employed AMMI 1 and AMMI 2 biplots to explore and evaluate the relationship between environment (E), genotype (G), and GEI. The current study utilized AMMI analysis to identify four top-performing and stable genotypes for grain yield and other relevant traits at each of the five test sites. Additionally, AMMI biplot analysis identified G-180, G-260, G-257 and 242 as high-yielding and stable genotypes across all test sites. Consequently, these genotypes are well-suited for inclusion in bread wheat breeding programs aimed at developing new varieties capable of producing high and consistent grain yields in environments like those examined in the present study.
AMMI 2 analysis revealed that the first and second interaction principal component axes (IPCA1 and IPCA2) were highly significant for all measured traits, with the two principal components together explaining more than 70% of the variance due to GEI. These findings are consistent with previous studies [25,26], which emphasized the importance of GEI in genotype performance across various test locations. It is advantageous to select testing locations with high IPCA1 and low IPCA2 scores to discriminate and identify undesirable genotypes [27,28]. The IPCA value obtained in the current study suggests a strong discriminating ability of Adet-2022 and Dabat-2023 for grain yield. The AMMI analysis demonstrated that different genotypes exhibited varying performances in different environments for different traits. These results underscore the importance of understanding the influence of the environment on physiological traits and grain yield to develop a successful plant breeding program, as indicated by previous studies [29].
According to previous research [22], the average-environment coordination (AEC) perspective of the GGE biplot was found to be an effective tool for evaluating genotype performance and stability across multiple test locations in this study. Similarly, in alignment with earlier findings [30,31], the arrow of the average environment axis (AEA), which directs toward genotypes with superior mean performance across test sites, was employed to identify those closest to the ideal genotype in terms of both performance and stability. Notably, genotypes G-232, G-216, and G-212 exhibited both high grain yield and stability, as evidenced by their positioning along the AEC abscissa with minimal deviation onto the AEC ordinate.
The present study utilized AMMI and GGE-biplot models to assess the yield performance and stability of bread wheat genotypes in Ethiopia’s key wheat-growing locations. Both methods consistently identified G-180 and G-242 as high yielding and stable elite bread wheat genotypes. However, some discrepancies were observed: GGE-biplot highlighted G-232, G-216, and G-212 as high-yielding and stable, while AMMI identified G-260 as among the top performers. These differences stem from variations in the underlying assumptions of the two analytical models [6, 30].
This study demonstrated that the interaction between genotype and environment significantly influences the performance and stability of bread wheat genotypes. Consequently, when selecting genotypes for breeding programs aimed at achieving consistently high grain yields, it is imperative to consider the impact of genotype-environment interactions. The findings suggest that selecting genotypes suitable for breeding adaptable varieties on a broader scale is more effective than focusing on genotypes for locally adapted varieties. The study underscores the importance of genetic variability in determining traits of interest, which is essential for identifying potential parental lines for breeding purposes. The agronomic traits analyzed exhibited moderate to high heritability, indicating potential for improvement through selection. The study identified G-180 and G-242 were the most stable genotypes across environments, showing consistent performance and low genotype × environment interaction in both AMMI and GGE analyses. G-232 and G-234 are more specific to certain environments and might perform best in those settings but are less stable across diverse environments. These genotypes are promising candidates for the development of new varieties to enhance wheat production and productivity in Ethiopia and other regions.
The dataset of the study is available from the authors upon reasonable request.
Conceptualization, MMK, TDA, EAD, WT; Formal Analysis, MMK; Data Curation, MMK; Writing—Original Draft Preparation, MMK; Writing—Review & Editing, MMK, TDA, EAD, WT.
The authors declare no conflicts of interest.
The authors received no direct funding for this research.
We sincerely thank Wondwesen Shiferaw, Melese Awoke, Chalie Leyew, Mequanint Andualem, and Birhanu Fentahun for their invaluable assistance in field trial management and data collection. Their contributions were instrumental to the success of this study.
1.
2.
3.
4.
5.
6.
7.
8.
9.
10.
11.
12.
13.
14.
15.
16.
17.
18.
19.
20.
21.
22.
23.
24.
25.
26.
27.
28.
29.
30.
31.
Kassie MM, Abebe TD, Desta EA, Tadesse W. Multi-Environment Evaluation of Bread Wheat Genotypes for Yield Stability in Ethiopia Using AMMI and GGE-Biplot Analyses. Crop Breed Genet Genom. 2025;7(2):e250004. https://doi.org/10.20900/cbgg20250004

Copyright © Hapres Co., Ltd. Privacy Policy | Terms and Conditions